AI Infrastructure Investment Map: From GPU, HBM and CoWoS to Data Center Stocks




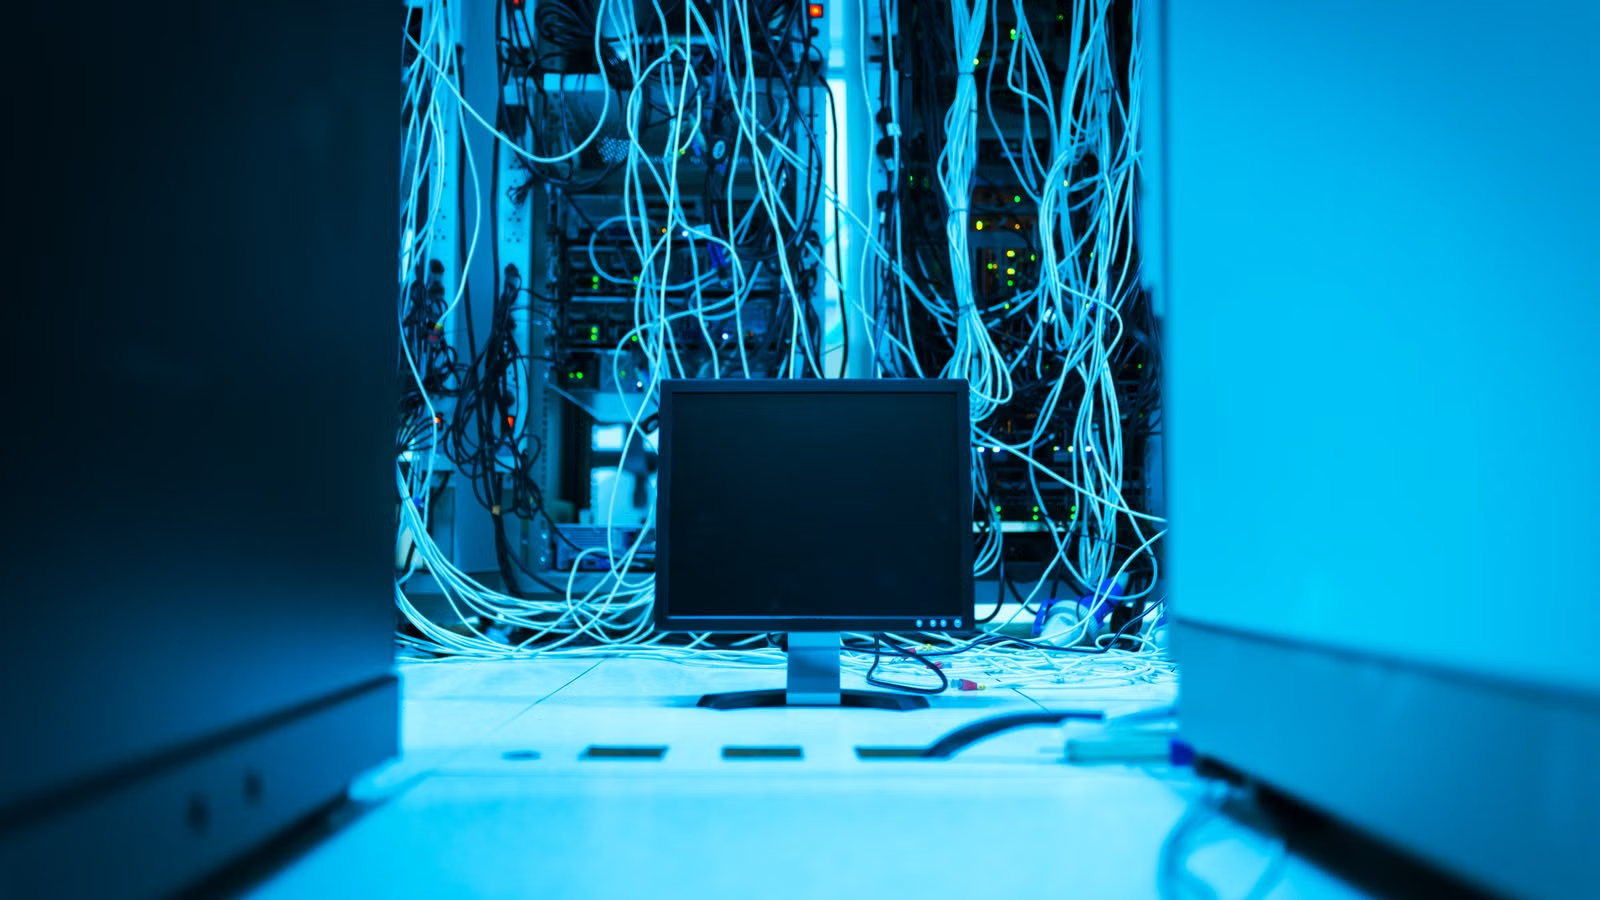
The core of AI infrastructure investing is not simply finding “the next NVIDIA,” but understanding how capital flows from cloud provider CAPEX into chips, memory, packaging, servers, networking, power and data centers. You can view it as an industry map: the upstream layer determines compute supply, the middle layer determines delivery speed, and the downstream layer determines commercial returns. If you want to invest in the AI supply chain, you need to compare growth visibility, supply bottlenecks, earnings quality, valuation pressure and cyclical risk at the same time.
Key Takeaways
- AI infrastructure investing starts with cloud CAPEX and ends with AI service revenue realization.
- GPUs remain the compute core, but ASICs and high-speed networking are taking more incremental budgets.
- HBM and CoWoS determine whether high-end AI chips can be delivered smoothly.
- Data center bottlenecks are expanding from chips to power, liquid cooling and construction cycles.
- When selecting AI infrastructure stocks, focus on growth, moats, cash flow and valuation.
- ETFs can reduce single-stock risk, but holdings purity and expense ratios still matter.
How to Understand the AI Infrastructure Investment Map: Where Cloud CAPEX Flows
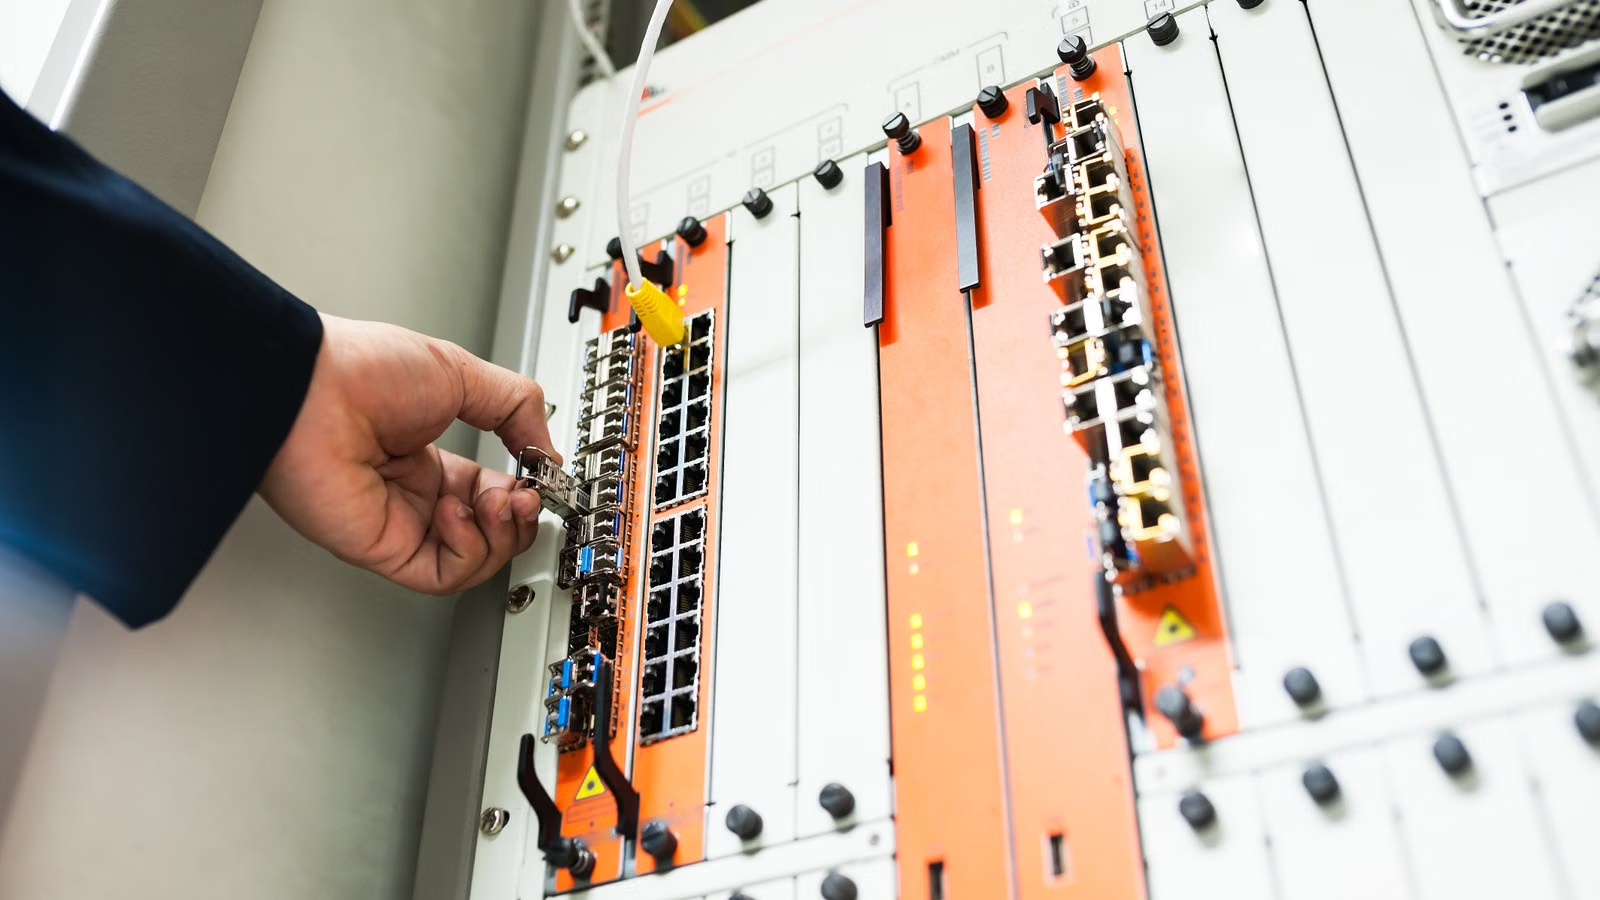
AI infrastructure investing can be broken down along the chain of “cloud provider spending—compute chips—server clusters—data centers—cloud revenue.” You first need to identify who is spending the money, then track which hardware and engineering layers receive that capital, and finally judge whether those investments can become sustainable revenue. If you only focus on one chip stock, you may easily miss how profits are distributed and how bottlenecks migrate across the supply chain.
Large cloud providers are the main funders of AI infrastructure demand. Microsoft continued to emphasize the contribution of Cloud and AI to revenue growth in its FY26 Q3 results. Alphabet listed technical infrastructure as the main component of capital expenditure in its 2026 investor presentation. Meta raised its full-year CAPEX range to $125 billion to $145 billion in its 2026 capital expenditure outlook. Amazon’s AWS operating income also shows that cloud remains the core support for its infrastructure investment.
However, higher CAPEX does not mean every supply-chain company benefits at the same pace. GPUs, HBM, advanced packaging, servers, switches, optical modules, power distribution, liquid cooling and data center operators all recognize revenue at different speeds and operate with different margin structures. Chip companies may enjoy higher gross margins. Server assemblers can have strong revenue elasticity but thinner margins. Data center operators may have long-term contracts, but they also face high leverage and long construction cycles.
| Supply Chain Layer | Core Products or Services | Main Demand Driver | Key Metrics to Watch |
|---|---|---|---|
| Cloud platforms | AI cloud services, training and inference | Enterprise AI demand and model calls | CAPEX, cloud revenue, RPO |
| Compute chips | GPUs, ASICs, CPUs | Model scale and inference workloads | Data center revenue, gross margin |
| Memory and packaging | HBM, CoWoS, advanced nodes | Bandwidth, energy efficiency and system integration | Yield, capacity, customer qualification |
| Systems and networking | AI servers, switches, optical modules | Cluster expansion | Orders, port speed, customer concentration |
| Physical infrastructure | Power, liquid cooling, facilities | Rising rack power density | MW capacity, delivery cycle, leverage |
You can use five signals to assess where the AI infrastructure cycle stands: whether cloud CAPEX guidance continues to rise; whether GPU and HBM lead times are shortening; whether CoWoS capacity is moving from shortage to balance; whether liquid cooling, power and networking orders are still accelerating; and whether cloud revenue can cover depreciation and operating costs.
Summary: The key to the AI infrastructure map is to look first at the source of capital, then at order transmission, and finally at where profits land. Cloud CAPEX determines total demand. GPUs and ASICs define the compute core. HBM and CoWoS determine chip delivery. Data centers, power and liquid cooling determine actual deployment. You should not treat the whole supply chain as one single rising sector. Instead, identify the current scarcity point and assess whether companies in that layer can convert shortage into profits, cash flow and long-term competitive advantages.
GPU, ASIC and High-Speed Networking: Which Stocks Matter in the AI Compute Layer
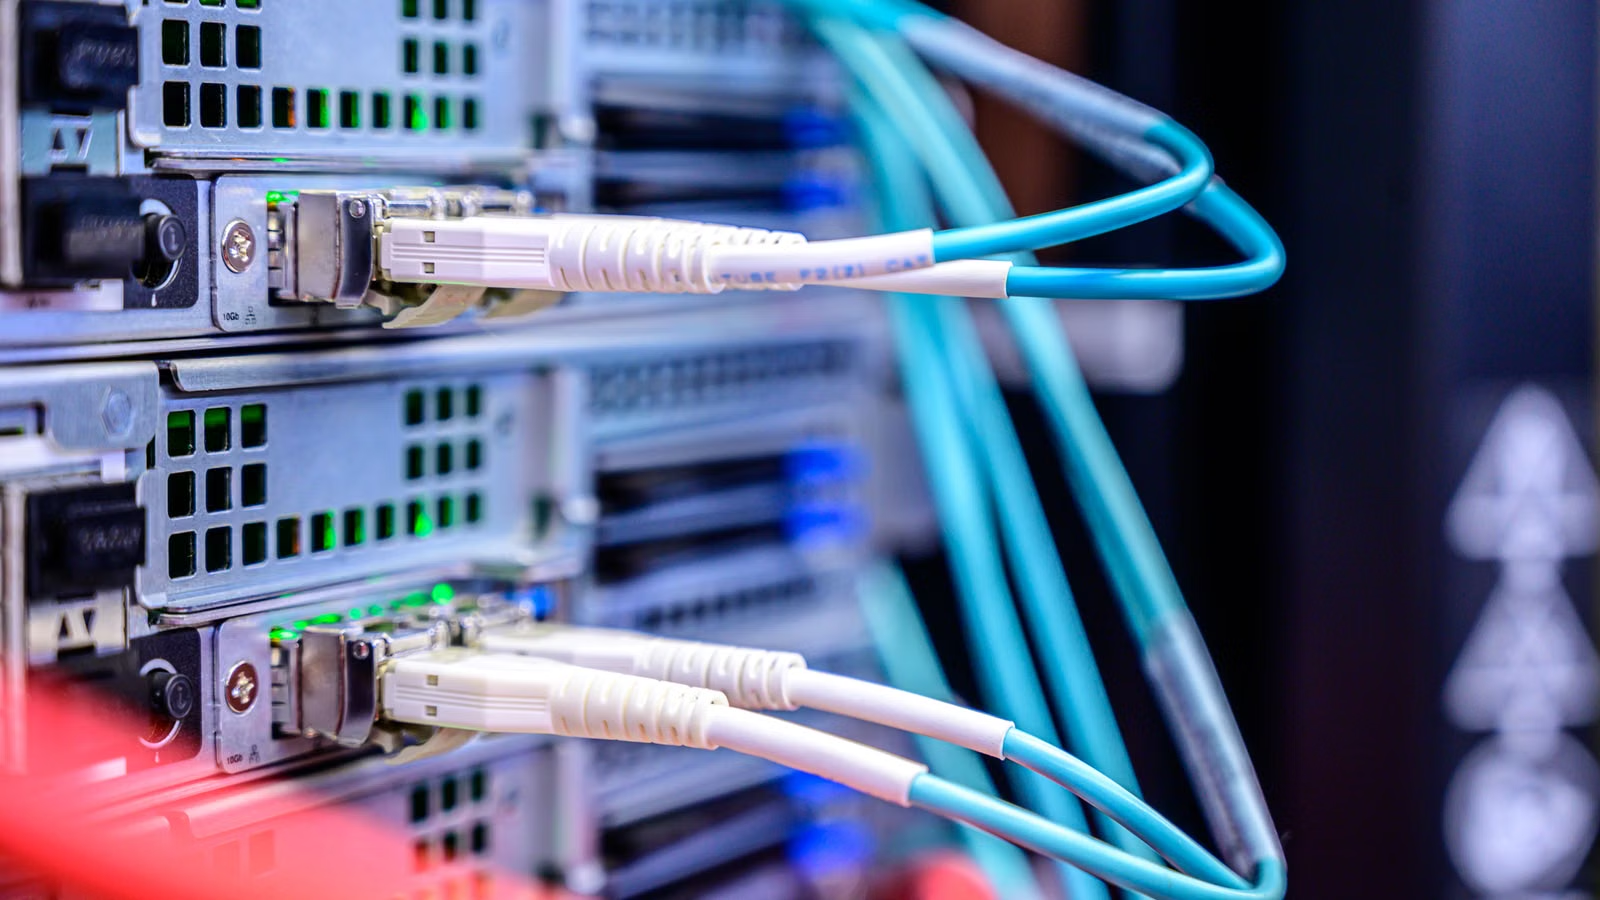
GPUs remain the core assets for AI training and general-purpose inference, but the compute layer has moved from “single GPU performance competition” to a system-level competition involving chips, software, interconnects, networking and full rack systems. When researching AI compute stocks, you should not only look at benchmark performance. You also need to evaluate ecosystem strength, customer stickiness, supply capability and full-cluster delivery.
NVIDIA’s advantage is not just the GPU. It is the combination of GPU, CPU, NVLink, switch chips, full systems and software ecosystem. Its data center revenue has become the core of its business, showing that AI infrastructure spending first concentrates on high-end accelerator platforms. AMD’s opportunity lies in alternative GPUs, an open software ecosystem and cloud customer diversification, but it still needs to keep proving supply capability, software maturity and customer adoption.
Custom ASICs are another important route. Large cloud providers want to use self-developed or co-designed chips to reduce unit inference costs. Broadcom’s growth in AI semiconductor revenue reflects the expansion of custom accelerators and AI networking demand. ASICs do not necessarily replace GPUs. They are more often used in specific models, stable workloads and large-scale inference scenarios. For investors, GPUs represent a general-purpose compute platform, while ASICs represent deep customer integration and cost optimization.
High-speed networking determines whether AI clusters can scale. Large model training requires many GPUs to compute synchronously, while inference clusters also require low-latency, high-throughput connectivity. Arista’s Q1 2026 revenue growth reflects the rising importance of Ethernet in large data centers and AI clusters. Going forward, you need to watch InfiniBand, Ethernet, Spectrum-X, 800G, 1.6T, DSPs, optical modules and copper interconnects, because networking bottlenecks directly affect GPU utilization.
| Compute Route | Main Advantage | Main Limitation | Metrics to Watch |
|---|---|---|---|
| General-purpose GPU | Mature ecosystem and wide applicability | High cost and tight supply | Data center revenue, system shipments |
| Custom ASIC | Higher efficiency for specific tasks | Customer concentration and limited generality | AI revenue, number of design projects |
| AI CPU | Control, preprocessing and general computing | Hard to handle large-scale training alone | Server platform share |
| High-speed networking | Determines cluster expansion efficiency | Fast-changing technology routes | Port speed, orders, customer structure |
When researching compute-layer stocks, you can screen them in three steps. First, determine whether the company sits in a core compute or networking bottleneck. Second, check whether its customers include leading cloud providers. Third, evaluate whether the expected growth has already been fully reflected in valuation. If a company only has an “AI concept” but lacks real orders, revenue contribution and customer validation, its investment logic is much weaker than that of companies truly embedded in the supply chain.
Summary: GPUs remain the center of the AI compute layer, but opportunities are spreading to ASICs, high-speed networking and full systems. NVIDIA’s core moat lies in platform capability. Broadcom and similar companies benefit from custom chips and networking. Arista and related players benefit from Ethernet data center expansion. What you need to compare is not simply “whose chip is faster,” but who can reliably deliver large-scale clusters, bind core customers and capture higher-quality profits from AI CAPEX.
HBM, CoWoS and Advanced Nodes: Who Controls AI Chip Delivery Bottlenecks
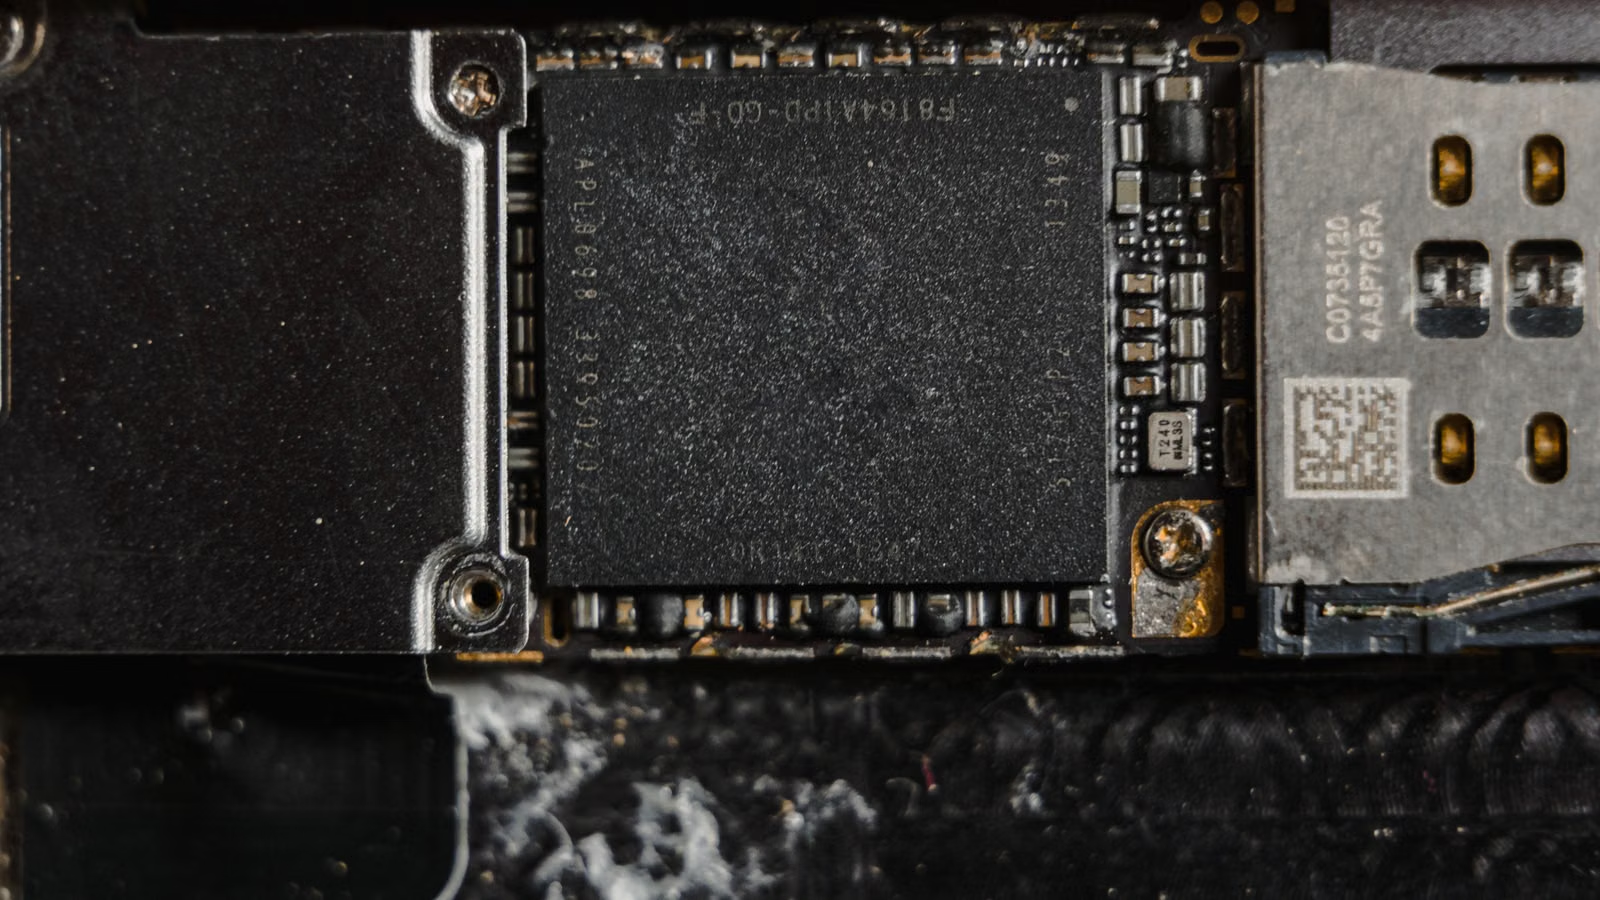
HBM and CoWoS are key bottlenecks in AI chip delivery. Even if a GPU or ASIC design is complete, the final server cannot ship on schedule without enough high-bandwidth memory, advanced packaging capacity and mature yields. When researching AI semiconductors, you must place logic chips, memory and packaging on the same map.
HBM’s value lies in bandwidth and energy efficiency. Traditional DRAM is more like general-purpose memory, while HBM uses a stacked structure close to the compute chip to deliver higher data throughput within limited space. The larger AI models become and the denser inference calls get, the higher the demand for memory bandwidth. Micron emphasized AI’s pull on its storage business in disclosures related to data center revenue, showing that HBM is no longer a small product line inside the memory cycle, but a crucial component of AI system cost and performance.
CoWoS connects GPUs or ASICs with HBM inside the same high-performance packaging system. TSMC’s CoWoS technology shows how advanced packaging uses interposers and substrates to enable high-density connections. You can understand it simply this way: advanced nodes manufacture the core logic chip, HBM provides high-speed memory, and CoWoS connects both into a stable, mass-producible product.
Advanced process nodes and equipment companies also benefit indirectly. AI chips require more advanced nodes, higher yields and more complex inspection flows. EUV, etching, deposition, metrology, inspection and packaging equipment are all related to the expansion cycle. However, equipment company revenue is usually more affected by order cycles, customer CAPEX and capacity planning. It should not be equated directly with AI chip sales.
| Layer | Core Function | Main Moat | Main Risk |
|---|---|---|---|
| HBM | Provides high-bandwidth memory | Stacking, yield, customer qualification | Overexpansion, pricing cycle |
| Advanced nodes | Produce high-performance logic chips | Process node, yield, customer ecosystem | High CAPEX, geopolitical risk |
| CoWoS | Integrates logic chips and HBM | Interposer, packaging capacity, yield | Pricing changes after capacity balance |
| Semiconductor equipment | Supports manufacturing and packaging expansion | Technical certification and R&D investment | Order volatility, delivery cycle |
To judge the investment value of this layer, do not only ask “who has capacity.” You also need to look at customer qualification, mass-production yield, product generation, unit capacity and pricing trends. HBM3E, HBM4, more stacks, larger die sizes and more complex packaging will keep shifting the short-term bottlenecks.
Summary: HBM, CoWoS and advanced nodes jointly determine AI chip delivery. HBM provides data bandwidth, advanced nodes provide compute density, and CoWoS completes high-performance integration. For investors, the real question is whether scarcity comes from technology leadership, customer qualification, yield advantage or capacity shortage. If capacity expansion is only nominal and lacks high-end customer validation, earnings elasticity may be weaker than the market expects. Companies with technology, capacity and customer lock-in are more likely to benefit continuously from the AI infrastructure cycle.
From Servers to Power and Liquid Cooling: How Data Center Stocks Absorb AI CAPEX
AI data center stocks do not only include facility operators. They also include servers, networking, power distribution, backup power, liquid cooling, transformers, construction engineering and utilities. As AI rack power density rises, the bottleneck is shifting from “whether chips are available” to “whether power, cooling and deliverable facilities are available.” You need to view data centers as engineering systems, not just real estate assets.
AI server companies usually have strong revenue elasticity, because cloud providers need to buy full systems, racks and clusters. But server assembly margins are often lower than those of chips and software platforms, and they are easily affected by component prices, inventory and customer concentration. When researching these companies, focus on order quality, customer structure, working capital and whether gross margins improve alongside revenue.
Power and liquid cooling are becoming more important. The International Energy Agency estimates that by 2030, global data center electricity consumption could reach about 945 TWh, with AI as one of the main sources of incremental demand. Higher-power GPU racks require more stable electricity supply, more efficient UPS systems, power distribution, transformers and cooling solutions. Vertiv’s view on AI data center design trends also highlights high density, liquid cooling and the data center as a computing unit.
Eaton’s content on data center power distribution and thermal pressure shows that dense GPU clusters place higher requirements on electrical systems, thermal management and operational stability. For investors, power equipment and thermal management companies may not look as visible as GPU companies, but they serve as the “delivery condition” for AI infrastructure expansion.
| Data Center Layer | Revenue Source | AI Sensitivity | Key Risks |
|---|---|---|---|
| AI servers | Full systems, racks, clusters | High | Gross margin, inventory, customer concentration |
| Networking and optical communication | Switches, optical modules, cables | High | Technology upgrades, price competition |
| Power distribution equipment | UPS, transformers, distribution systems | High | Delivery cycle, raw materials |
| Liquid cooling equipment | Cold plates, piping, heat exchange systems | High | Technology route changes |
| Data center operations | Leasing, colocation, cloud compute | Medium-high | High leverage, construction delays, interest rates |
| Utilities | Power sales and grid connection services | Indirect | Regulation, return cycle |
Data center operators need separate evaluation. Built capacity, capacity under construction, pre-leasing rates, power reserves, customer credit, debt maturities and financing costs all affect shareholder returns. If a company only has land or an “AI data center transformation” story but lacks power access, customer contracts and financing capability, its risk is clearly higher than that of mature operators.
Summary: The investment logic of AI data centers is spreading from server procurement to power, liquid cooling and construction delivery. You cannot judge a company only by whether it carries the “data center” label. You need to assess whether it has real orders, available power, deliverable capacity and a reasonable capital structure. Server companies have high revenue elasticity but margin pressure. Power and liquid cooling companies may benefit from the high-density trend. Data center operators face high CAPEX, leverage and interest-rate risks.
How to Select AI Infrastructure Stocks: Compare Growth, Moats, Valuation and Cyclical Risk
When selecting AI infrastructure stocks, you need to first identify which supply-chain layer the company belongs to, then assess AI revenue exposure, competitive moat, cash-flow quality and valuation margin of safety. Being close to a bottleneck does not necessarily make a stock better, because the market may already have priced in several years of growth. The key question is whether growth can be converted into profit and free cash flow.
You can use five dimensions for initial screening:
- AI revenue purity: How much AI-related revenue contributes to total revenue, and whether it already appears in financial results.
- Competitive moat: Whether the company has technology, software ecosystem, customer qualification, capacity or contracts that are difficult to replicate.
- Earnings quality: Whether gross margin, operating cash flow and return on capital improve alongside revenue.
- Growth visibility: Whether orders, backlog, long-term contracts and customer CAPEX support forecasts.
- Valuation tolerance: Whether the current market capitalization has already priced in future growth for several years.
Investors with different risk preferences can divide AI infrastructure stocks into several categories:
| Investment Type | Layers to Focus On | Potential Advantage | Main Risk |
|---|---|---|---|
| Core platform | GPU, cloud platform, foundry | Strong scale and ecosystem moat | High valuation, regulatory impact |
| High-growth supply chain | HBM, networking, liquid cooling | High sensitivity to AI CAPEX | Cyclicality and customer concentration |
| Cyclical expansion | Semiconductor equipment, server manufacturing | Clear order growth during expansion | Inventory and demand reversal |
| Asset operation | Data centers, utilities | More visible contracts and cash flow | High leverage, interest-rate pressure |
| Diversified tool | AI, semiconductor, data center ETFs | Lower single-stock judgment difficulty | Holdings purity and fee differences |
Mid-stage research should also include trading cost considerations. If you follow GPU, HBM, semiconductor equipment or data center stocks, you should understand actual trading costs in addition to company fundamentals. U.S. stock trading costs usually do not only include commissions. They may also include platform fees, external institutional fees, trading activity fees and other fees shown on the order page. Biya charges $0 commission for U.S. stock trading. Platform fees, external institutional fees and other costs are subject to the U.S. stock trading fee schedule and the order page. Public market information, trading rules and fee structures are for research reference only and do not constitute investment advice.
There are three common mistakes in AI infrastructure investing. First, treating all data center companies as AI beneficiaries while ignoring power, customers and financing capability. Second, extrapolating short-term supply shortages linearly into the long term while ignoring the possibility that prices and margins may fall after capacity expansion. Third, focusing only on revenue growth while ignoring free cash flow and depreciation pressure. Especially in high-CAPEX layers, revenue growth does not necessarily lead to higher shareholder returns.
Summary: AI infrastructure stock selection should start with supply-chain positioning, but it cannot stop at concept classification. You need to confirm whether AI revenue is real, whether customers are stable, whether moats are strong, whether cash flow keeps up, and whether valuation still offers room for error. GPUs, ASICs, HBM, CoWoS, networking, power and data centers can all benefit, but each layer has different margins, cyclicality and sources of risk. A more prudent approach is to use the supply-chain map to build a research list, then screen companies step by step using financial results, orders, valuation and trading costs.
If you want to track AI infrastructure stocks over the long term, you can separate GPU, HBM, foundry, semiconductor equipment, networking, liquid cooling and data center operators into different watchlists instead of viewing them as one broad “AI concept stock” group. Users who meet local service availability, identity verification and platform rules can use Biya to view related U.S. and Hong Kong stocks, and use U.S. stock information search to compare company profiles, quotes and trading information. If you later choose to trade, you should understand order types, fee structures, exchange-rate movements and your own risk tolerance in advance, and rely on platform rules, the order page and local regulatory requirements. For mobile use, you can download the app and then check whether the service is available in your location.
FAQ
How can individual investors distinguish AI chip stocks from AI infrastructure stocks?
AI chip stocks are usually part of the broader AI infrastructure universe. Chip stocks mainly cover GPUs, ASICs, CPUs, HBM, foundries and advanced packaging. AI infrastructure stocks have a wider scope, including servers, networking, power, liquid cooling, data center operations and cloud platforms. The key is to look at revenue sources, not only whether a company uses the AI label.
Will rising HBM demand lift all memory chip stocks?
Rising HBM demand will not automatically lift all memory chip stocks. You need to compare each company’s HBM generation, customer qualification, production yield, capacity mix and exposure to traditional DRAM and NAND. If traditional memory prices fall, they may offset part of the HBM growth contribution, so financial results and industry pricing cycles still matter.
Will CoWoS capacity expansion weaken the value of advanced packaging companies?
CoWoS capacity expansion may ease short-term scarcity, but it does not necessarily weaken long-term value. Larger chip sizes, more HBM stacks and more complex packaging can continue to increase advanced packaging demand. The key is to evaluate utilization, yield, pricing, customer structure and expansion pace, not only nominal capacity increases.
Which financial metrics matter most for AI data center stocks?
For AI data center stocks, focus on pre-leasing rates, available power, capacity under construction, order backlog, capital expenditure, net debt and free cash flow. If revenue growth relies on continuous borrowing and high-cost expansion, actual shareholder returns may be lower than revenue growth suggests. Interest rates, grid approvals and customer concentration also matter.
Are AI infrastructure ETFs more suitable for beginners than buying GPU stocks directly?
AI infrastructure ETFs are usually more suitable for beginners who do not want to take single-company risk, but they are not risk-free. Different ETFs may focus on semiconductors, cloud platforms, data centers or power equipment. Before investing, review holdings concentration, expense ratio, index rules and regional exposure, and rely on fund documents and trading platform information.
What fees should investors check before trading AI infrastructure stocks?
Before trading AI infrastructure stocks, investors should check commissions, platform fees, external institutional fees, trading activity fees, exchange-rate costs and order execution rules. Different platforms, markets and order types may have different costs. Always rely on platform fee disclosures, the order page, billing details and local regulatory requirements, rather than a single “commission” figure.
*This article is provided for general information purposes and does not constitute legal, tax or other professional advice from BiyaPay or its subsidiaries and its affiliates, and it is not intended as a substitute for obtaining advice from a financial advisor or any other professional.
We make no representations, warranties or warranties, express or implied, as to the accuracy, completeness or timeliness of the contents of this publication.
Related Blogs of

What Are AI Data Center Concept Stocks? Who Benefits Across Servers, Storage, Networking, and Power?


Could HBM Shift from Shortage to Oversupply? The Cycle Risks AI Memory Investors Must Watch


Which Stocks Are Affected by AI Chip Export Controls? A Risk Breakdown of Nvidia, ASML, and TSMC


Is SMH ETF Worth Buying? NVIDIA, TSMC, Micron and ASML Weight Analysis

Choose Country or Region to Read Local Blog
 Australia
 Austria
 Belgium
 Canada
 Cyprus
 Czech Republic
 Denmark
 Estonia
 Finland
 France
 Germany
 Greece
 Hong Kong
 India
India Indonesia
 Ireland
 Italy
Italy Japan
Japan Latvia
 Lithuania
 Luxembourg
 Malaysia
 Malta
Malta Morocco
 Nepal
Nepal Netherlands
 New Zealand
 Norway
 Pakistan
 Philippines
 Poland
 Portugal
 Romania
 Singapore
 Slovakia
 Slovenia
 South Africa
 South Korea
 Spain
Spain Sweden
 Thailand
 The United States
 Turkey
 United Arab Emirates
 United Kingdom
 Vietnam
Contact Us




BIYA GLOBAL LLC is registered with the Financial Crimes Enforcement Network (FinCEN), an agency under the U.S. Department of the Treasury, as a Money Services Business (MSB), with registration number 31000218637349, and regulated by the Financial Crimes Enforcement Network (FinCEN).
BIYA GLOBAL LIMITED is a registered Financial Service Provider (FSP) in New Zealand, with registration number FSP1007221, and is also a registered member of the Financial Services Complaints Limited (FSCL), an independent dispute resolution scheme in New Zealand.