Will AI Infrastructure Stocks Pull Back? Valuation Risk Through CAPEX, Margins, and Market Expectations




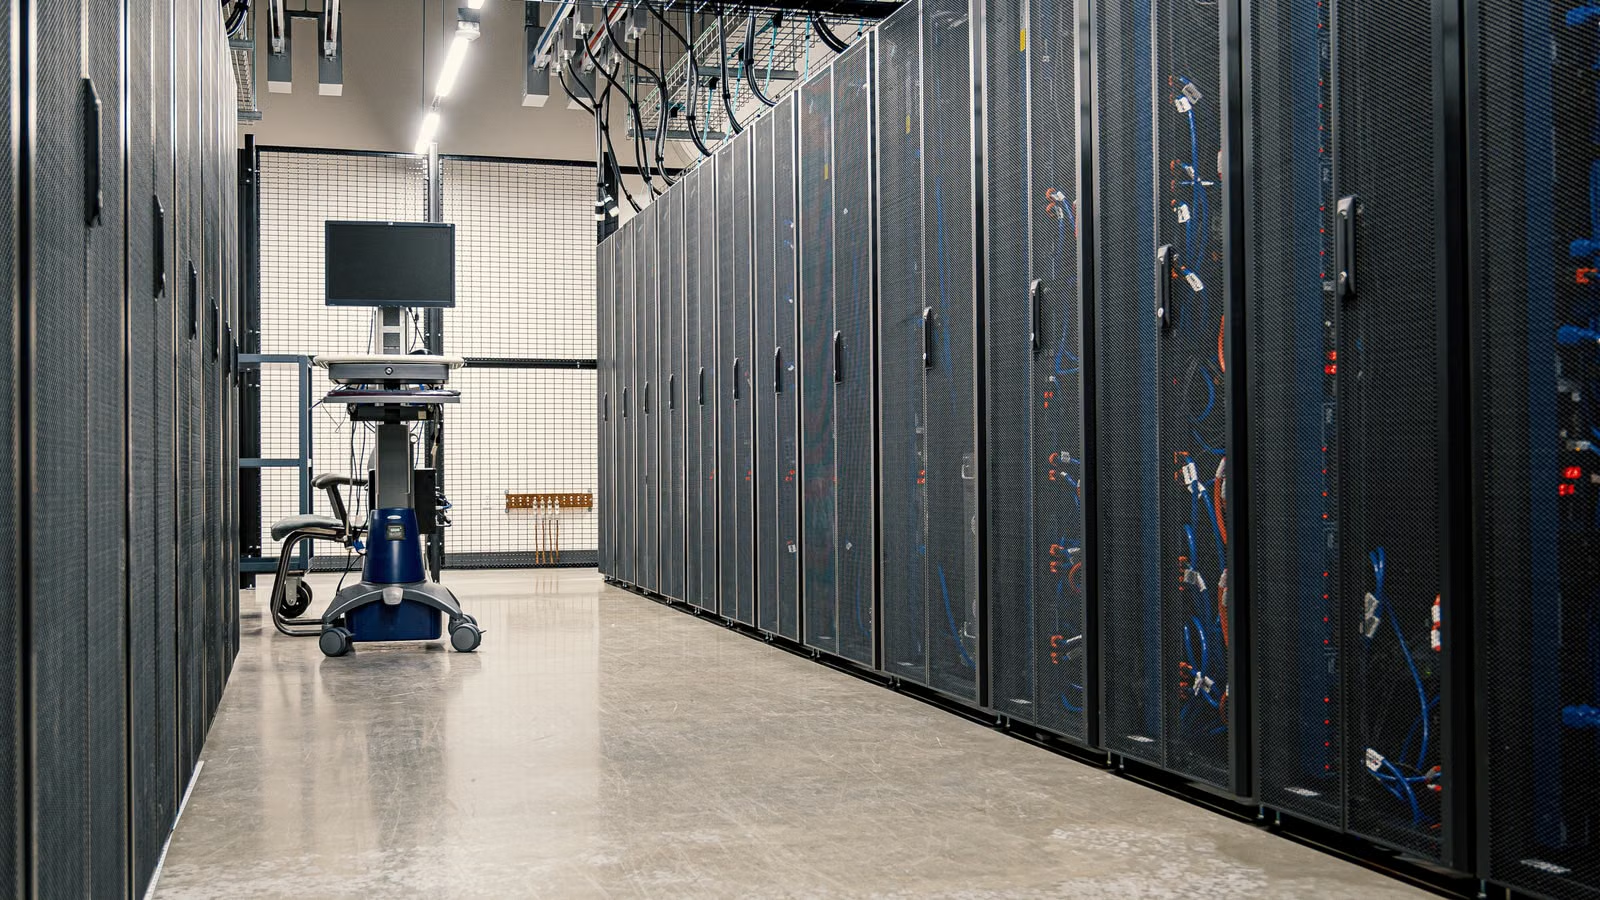
AI infrastructure stocks still have industry growth behind them, but that does not mean share prices cannot pull back. You need to separate “AI demand continues to grow” from “stock valuations have already priced in too much future growth.” If cloud CAPEX growth slows, margins come under pressure, or earnings expectations stop being revised upward, high-valuation AI infrastructure names may first enter a valuation digestion phase. The key question is not whether AI still matters, but whether capital spending can turn into revenue, profit, and free cash flow.
Key Takeaways
- Strong AI infrastructure demand does not mean related stocks cannot correct.
- Markets focus more on CAPEX growth changes than absolute spending levels.
- Depreciation, power, and financing costs may pressure margins with a lag.
- Order visibility and valuation risk differ widely across the supply chain.
- High valuations depend on earnings delivery continuing to beat expectations.
- To judge a pullback, watch orders, margins, and cash flow together.
If AI Infrastructure Demand Is Still Strong, Why Can Stocks Still Pull Back?

AI infrastructure stocks may pull back, but a correction does not necessarily mean AI demand has disappeared. More often, share prices have already reflected several years of high growth in advance. Once revenue growth, order growth, or management guidance no longer exceeds already elevated expectations, valuation multiples may be revised lower. When looking at AI infrastructure stocks, you should not only ask whether AI will keep growing. You also need to ask how much growth the current price has already priced in.
AI infrastructure is not a single uniform sector. It includes GPUs, ASICs, HBM, enterprise SSDs, optical modules, switching chips, AI servers, power equipment, liquid cooling systems, data center REITs, cloud computing, and compute leasing platforms. These segments have different business models: chip companies depend more on product cycles and gross margins; server companies depend more on shipment scale and supply chain efficiency; power and cooling companies depend more on backlog and project execution; cloud providers must bear depreciation, energy, and utilization pressure.
That means you cannot use Nvidia as a proxy for the entire AI infrastructure chain, nor can you directly infer that all suppliers’ shares will rise simply because cloud CAPEX is growing. For example, Nvidia reported first-quarter fiscal 2027 revenue of $81.6 billion and a GAAP gross margin of 74.9%, showing that its core accelerated computing platform still has strong profitability. But this does not mean servers, optical modules, power equipment, and cloud providers can all maintain the same margin elasticity.
| Pullback Type | Common Trigger | Fundamental Condition | What Investors Should Watch |
|---|---|---|---|
| Liquidity pullback | Rising rates, weaker risk appetite | Orders have not clearly deteriorated | Valuation multiples, real rates |
| Expectations pullback | Growth remains fast but misses high expectations | Revenue grows, but marginal growth slows | Earnings revisions, earnings reaction |
| Fundamental reversal | CAPEX cuts, order cancellations | Orders and margins weaken together | Backlog, inventory, cash flow |
For you, the most important task is to separate “valuation digestion” from an “industry reversal.” If share prices fall but orders, gross margins, free cash flow, and guidance have not deteriorated, the pullback is more likely the market cooling down high valuations. If share prices fall alongside order cancellations, delivery delays, rising inventory, and repeated earnings downgrades, the industry thesis needs to be reassessed.
Summary: Strong AI infrastructure demand does not eliminate valuation pullback risk. Stock prices trade future expectations, not just demand that has already materialized. When the market already believes AI compute will remain structurally scarce, even strong earnings may fail to lift share prices if they are not “stronger than strong.” To assess AI infrastructure pullback risk, you need to break the supply chain apart: chips require margin and product-cycle analysis; servers require order conversion analysis; power and cooling require project execution analysis; cloud providers require CAPEX return and free cash flow analysis. The real warning sign is not one-day volatility, but demand, orders, margins, and cash flow weakening at the same time.
CAPEX Is Still Accelerating. Why Is the Real Risk a Return-on-Investment Mismatch?
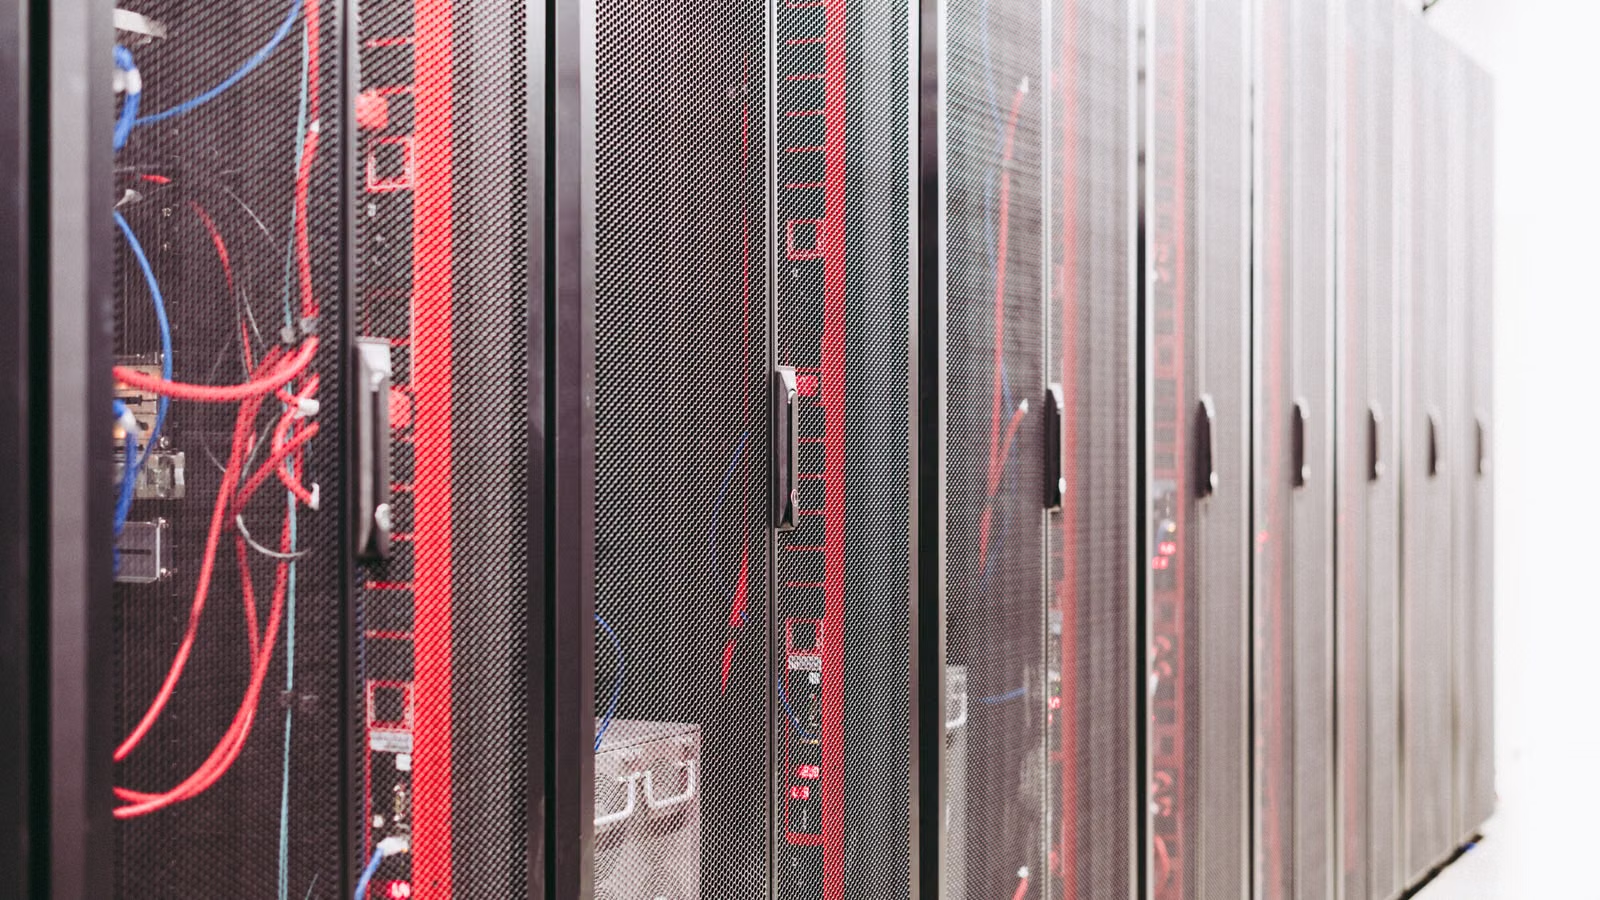
Cloud providers continue to raise capital spending, which supports near-term demand for GPUs, networking equipment, servers, and data center power infrastructure. But the higher CAPEX goes, the higher the future return hurdle becomes. The risk for AI infrastructure stocks is not that cloud providers will stop investing tomorrow. The risk is that capital spending grows faster than revenue, profit, and free cash flow, causing the market to question whether these investments can generate sufficient returns.
Latest disclosures show that AI CAPEX remains elevated. Microsoft reported capital expenditures of $31.9 billion in its fiscal third quarter, with roughly two-thirds allocated to shorter-lived assets such as GPUs and CPUs. Alphabet raised its 2026 capital expenditure guidance to $180 billion to $190 billion. Meta expects 2026 capital expenditures of $125 billion to $145 billion, above its previous range. Amazon also expects roughly about $200 billion in capital expenditures in 2026.
These numbers suggest AI infrastructure demand has not clearly cooled. But what the market is really worried about is that capital spending is moving from a “scarce compute land grab” phase into a “return verification” phase. The Bank for International Settlements noted in its 2026 annual economic report that the five largest hyperscalers are expected to spend more than $1 trillion in AI-related capital expenditures during 2025 and 2026, with some commitments growing faster than corporate earnings and free cash flow.
| Indicator | Healthy Expansion | Rising Risk |
|---|---|---|
| CAPEX growth | Grows in line with cloud revenue and orders | Clearly outpaces revenue and cash flow |
| Backlog | Continues to grow and converts faster | Grows but delivery is delayed |
| Compute supply and demand | Demand still meaningfully exceeds supply | Supply and demand begin to balance |
| Free cash flow | Temporarily pressured but explainable | Persistently weaker than market expectations |
| Financing structure | Mainly funded by operating cash flow | Debt and external financing rise |
CAPEX slowdowns usually do not happen all at once. They tend to move through the supply chain in stages: cloud providers first adjust data center timelines, then GPU, networking, server, and power equipment orders are affected; after that, supply chain lead times shorten and inventory rises; finally, revenue growth and valuation multiples reflect the change. Markets often price this shift before CAPEX actually declines.
Summary: AI CAPEX remains elevated, which supports the AI infrastructure supply chain, but it also creates valuation risk. The larger capital spending becomes, the more investors will ask about returns: Are these GPUs being fully utilized? Can AI cloud revenue cover depreciation and energy costs? Will customer commitments turn into cash revenue? If CAPEX, revenue, profit, and free cash flow improve together, high valuations still have support. If CAPEX keeps rising while cash flow deteriorates, AI infrastructure stocks may pull back even while fundamentals are still growing.
Why Margin Sustainability Matters More Than Revenue Growth
When the market already expects AI infrastructure companies to grow rapidly, revenue growth alone may not be enough. You need to focus on whether incremental revenue can turn into gross profit, operating profit, and free cash flow. AI infrastructure is capital intensive. Servers, GPUs, networking equipment, and data centers do not all become expenses immediately. They gradually affect the income statement through depreciation, energy, and maintenance costs.
This is why cloud providers and upstream suppliers may show very different margin trends. Upstream chip companies can maintain high gross margins when technical barriers are strong and supply-demand conditions remain tight. Cloud providers, however, must bear data center costs, server depreciation, power, cooling, and network operations. If AI service prices fall faster than usage grows, margins may come under pressure.
Financial results across different segments already show this divergence. Broadcom reported second-quarter AI semiconductor revenue of $10.8 billion, up 143% year over year, showing strong demand for custom AI accelerators and AI networking. Vertiv reported first-quarter adjusted operating margin of 20.8%, suggesting that power and cooling segments may also benefit from scale. Dell reported first-quarter AI orders of $12.1 billion and backlog of $14.4 billion, but server businesses generally require closer attention to whether margins can keep pace with revenue scale.
| Supply Chain Segment | Source of Profit | Main Risk | Key Indicator |
|---|---|---|---|
| GPUs and accelerators | Technology barriers, ecosystem lock-in | Product transitions, export restrictions | Gross margin, data center revenue |
| ASICs | Large customer custom orders | Customer concentration, self-developed alternatives | AI revenue, order visibility |
| Optical modules and networking | Cluster expansion, bandwidth upgrades | Price competition, inventory cycles | ASP, lead time, inventory |
| AI servers | Shipment volume and supply chain efficiency | Lower hardware margins | Backlog, operating margin |
| Power and liquid cooling | Higher data center density | Project execution, raw material costs | Orders, adjusted margin |
| Cloud platforms | Compute utilization and software revenue | Depreciation, power, price competition | Cloud margin, free cash flow |
There is also a practical cost layer that is easy to overlook. If you are paying attention to trading opportunities in AI infrastructure stocks, you should not only look at price volatility. You also need to understand actual trading costs. U.S. stock trading costs usually include more than commissions. They may also include platform fees, external agency fees, trading activity fees, and order execution-related costs. Biya charges $0 commission for U.S. stock trading, while platform fees, external agency fees, and other costs are subject to Biya U.S. stock trading fees and the order page. Public market information and fee structures can help you understand trading costs, but they do not constitute investment advice.
Summary: Whether AI infrastructure stocks can keep high valuations depends not only on revenue growth, but on revenue quality. For upstream chip companies, gross margins and product mix matter most. For server companies, order conversion and operating margins matter more. For cloud providers, depreciation, power, utilization, and free cash flow are central. Fast revenue growth with declining margins may lead the market to question growth quality. Slower revenue growth with stable margins may provide stronger valuation support. When assessing pullback risk, you should evaluate revenue growth and profit conversion together.
Are AI Infrastructure Stocks Overvalued? Look at What the Market Has Already Priced In
To judge whether AI infrastructure stocks are overvalued, you cannot rely only on whether their P/E ratios are above historical averages. You need to understand how many years of high growth, what level of gross margin, and what free cash flow margin the current stock price already implies. High valuation itself is not the problem. The problem is high valuation meeting stalled expectation revisions.
Markets trade expectation gaps. A company may report strong earnings, but if its stock does not rise, that may mean the good news was already fully priced in. A company may only slightly lower guidance, but if the stock falls sharply, that means valuation is highly sensitive to growth assumptions. Many AI infrastructure stocks have rallied significantly, and a number of names have shifted from an “earnings improvement trade” to a “long-term industry winner trade,” which increases valuation volatility.
You can use a reverse DCF or simplified valuation framework to understand current pricing. Start with enterprise value and work backward to implied future revenue. Then estimate long-term operating margin and free cash flow margin, and finally judge whether these assumptions match industry growth and company competitiveness. Compared with static P/E ratios, the following indicators are more useful for observing AI infrastructure valuation risk:
- Whether next-12-month earnings estimates are still being revised upward;
- Whether EV/EBITDA is far above EBITDA growth;
- Whether free cash flow yield continues to decline;
- Whether backlog-to-revenue ratios are improving;
- Whether revenue is overly concentrated in one large customer;
- Whether stocks still rise after earnings beats;
- Whether higher CAPEX leads to matching revenue and profit.
| Financial Result | Original Market Expectation | Possible Stock Reaction |
|---|---|---|
| Revenue growth accelerates | Expectations were even higher | Falls or trades sideways |
| Revenue growth stabilizes | Market expected deceleration | Rises |
| CAPEX increases | Demand is validated | Rises |
| CAPEX increases | Returns remain unclear | Falls |
| Gross margin declines slightly | Already priced in | Limited impact |
| Gross margin declines slightly | Market expected expansion | Clear pullback |
If you need to track multiple U.S.-listed AI infrastructure companies, you can first use U.S. stock information search to compare tickers, company information, and market performance, then combine that with earnings reports to review revenue, orders, gross margins, and cash flow. The goal is not to chase short-term price moves, but to compare valuation and fundamentals within the same framework.
Summary: Valuation risk is not simply about a stock being “expensive.” It is about whether the reasons for being expensive can continue to hold. When a stock price has already priced in years of high growth, valuation can compress as soon as earnings expectations stop rising. When analyzing AI infrastructure stocks, focus on three questions: Is the company still beating expectations? Does the stock still respond positively to those beats? Is cash flow keeping up with capital spending? If the answers start to weaken, shares may enter valuation digestion even while industry demand continues to grow.
How to Judge Whether an AI Infrastructure Stock Pullback Is an Opportunity or a Trend Reversal
To judge whether an AI infrastructure stock pullback is an opportunity, you cannot look only at the size of the decline. You need to confirm whether demand, orders, margins, and valuation are deteriorating together. If share prices fall while orders and profits remain largely unchanged, the move is closer to valuation digestion. If CAPEX guidance, order conversion, gross margins, and earnings expectations weaken at the same time, the pullback may become a trend reversal.
You can evaluate AI infrastructure stocks through three scenarios:
| Dimension | Bullish Scenario | Base Scenario | Bearish Scenario |
|---|---|---|---|
| Cloud CAPEX | Continues to rise | Stays high | Clearly cut |
| AI revenue | Accelerates | Continues growing | Misses expectations |
| Equipment orders | Demand exceeds supply | Growth normalizes | Delays or cancellations |
| Margins | Stable or expanding | Slightly pressured | Decline continuously |
| Free cash flow | Gradually improves | Temporarily pressured | Continues to deteriorate |
| Valuation multiples | Remain elevated | Compress moderately | Re-rate quickly lower |
You can use the following checklist to track risk:
- Have cloud providers lowered full-year CAPEX guidance?
- Are AI orders still converting into revenue on schedule?
- Are GPU, HBM, and networking equipment lead times shortening?
- Are server, optical module, and storage inventories rising?
- Is gross margin pressure caused by product transitions or by weaker demand and pricing?
- Is free cash flow meaningfully below management’s earlier expectations?
- Are analysts repeatedly lowering earnings forecasts for the next two years?
- After the stock falls, have valuation assumptions returned to a more achievable range?
Power constraints are another important variable. The IEA expects global data center electricity consumption to double to about 945 TWh by 2030, while data center construction cycles are often faster than grid expansion cycles. This means power supply, grid connection, cooling, and land resources may become bottlenecks for AI infrastructure expansion and may also drive valuation divergence across the supply chain.
Summary: After AI infrastructure stocks pull back, you should not mechanically conclude that “a drop is an opportunity” or that “a drop means the bubble has burst.” A more reliable approach is to check CAPEX, orders, margins, cash flow, and valuation together. If only valuation multiples fall from extremely high levels while orders and profits remain stable, the risk-reward profile may improve. If cloud providers cut budgets, supply chain inventory rises, earnings estimates fall, and free cash flow weakens at the same time, the original thesis needs to be reassessed. For ordinary investors, the most important point is to avoid trading the entire AI infrastructure chain as if it were one single stock.
If you follow AI infrastructure stocks, semiconductor names, or cloud computing companies, you need to consider not only industry trends, but also trading availability, order fees, and account rules. Eligible users can use Biya to view U.S. stocks, Hong Kong stocks, digital assets, and other multi-asset market information, while checking fee structures, order types, and risk disclosures before placing orders. Biya is a global multi-asset trading wallet. Service availability depends on the user’s location, identity verification result, platform rules, and applicable laws and regulations. If you need to track the AI infrastructure theme over time, you can also use the Biya App to compare market data, stock information, and trading costs. Public market information, fee explanations, and trading tools are for reference only and do not constitute investment advice.
FAQ
Can AI infrastructure ETFs reduce chip stock pullback risk?
AI infrastructure ETFs can reduce single-company risk, but they cannot remove industry-wide pullback risk. Many thematic ETFs may still be heavily concentrated in a few major chip, cloud computing, or power equipment companies. You should review constituent weights, index rules, expense ratios, and rebalancing mechanisms instead of assuming ETFs always have lower volatility.
Will lower AI inference prices hurt AI chip companies?
Lower AI inference prices do not necessarily hurt AI chip companies. Price declines may reduce revenue per unit of service, but they may also stimulate more applications to use compute. The final impact depends on demand elasticity, GPU utilization, cloud pricing power, and whether hardware performance gains can reduce unit computing costs.
Will data center power bottlenecks affect AI infrastructure stocks?
Data center power bottlenecks can affect valuation divergence among AI infrastructure stocks. Grid connection, power supply, and cooling constraints may delay data center launches, affecting server and chip delivery schedules. However, power equipment, liquid cooling, and infrastructure suppliers may also benefit from higher construction demand.
What valuation risks can AI chip export controls create?
AI chip export controls can affect serviceable markets, product mix, and inventory risk. The impact on each company depends on chip performance, customer region, licensing requirements, and alternative markets. For cross-border trading and compliance questions, investors should refer to the latest regulatory documents, company disclosures, and platform rules.
What should ordinary investors prioritize in AI infrastructure earnings reports?
Ordinary investors should prioritize revenue growth, gross margins, backlog, free cash flow, and next-quarter guidance. GAAP data reflects accounting costs, while non-GAAP data helps explain operating performance. However, investors should review adjustment items, stock-based compensation, and cash flow together instead of relying on a single EPS figure.
*This article is provided for general information purposes and does not constitute legal, tax or other professional advice from BiyaPay or its subsidiaries and its affiliates, and it is not intended as a substitute for obtaining advice from a financial advisor or any other professional.
We make no representations, warranties or warranties, express or implied, as to the accuracy, completeness or timeliness of the contents of this publication.
Related Blogs of

Is SMH ETF Worth Buying? NVIDIA, TSMC, Micron and ASML Weight Analysis


AI Infrastructure Investment Map: From GPU, HBM and CoWoS to Data Center Stocks

What Are CoWoS Concept Stocks? An Investment Map of the Advanced Packaging Supply Chain


Choose Country or Region to Read Local Blog
 Australia
 Austria
 Belgium
 Canada
 Cyprus
 Czech Republic
 Denmark
 Estonia
 Finland
 France
 Germany
 Greece
 Hong Kong
 India
India Indonesia
 Ireland
 Italy
Italy Japan
Japan Latvia
 Lithuania
 Luxembourg
 Malaysia
 Malta
Malta Morocco
 Nepal
Nepal Netherlands
 New Zealand
 Norway
 Pakistan
 Philippines
 Poland
 Portugal
 Romania
 Singapore
 Slovakia
 Slovenia
 South Africa
 South Korea
 Spain
Spain Sweden
 Thailand
 The United States
 Turkey
 United Arab Emirates
 United Kingdom
 Vietnam
Contact Us




BIYA GLOBAL LLC is registered with the Financial Crimes Enforcement Network (FinCEN), an agency under the U.S. Department of the Treasury, as a Money Services Business (MSB), with registration number 31000218637349, and regulated by the Financial Crimes Enforcement Network (FinCEN).
BIYA GLOBAL LIMITED is a registered Financial Service Provider (FSP) in New Zealand, with registration number FSP1007221, and is also a registered member of the Financial Services Complaints Limited (FSCL), an independent dispute resolution scheme in New Zealand.