How to Analyze Micron’s HBM Business Share When Exact Data Is Unavailable




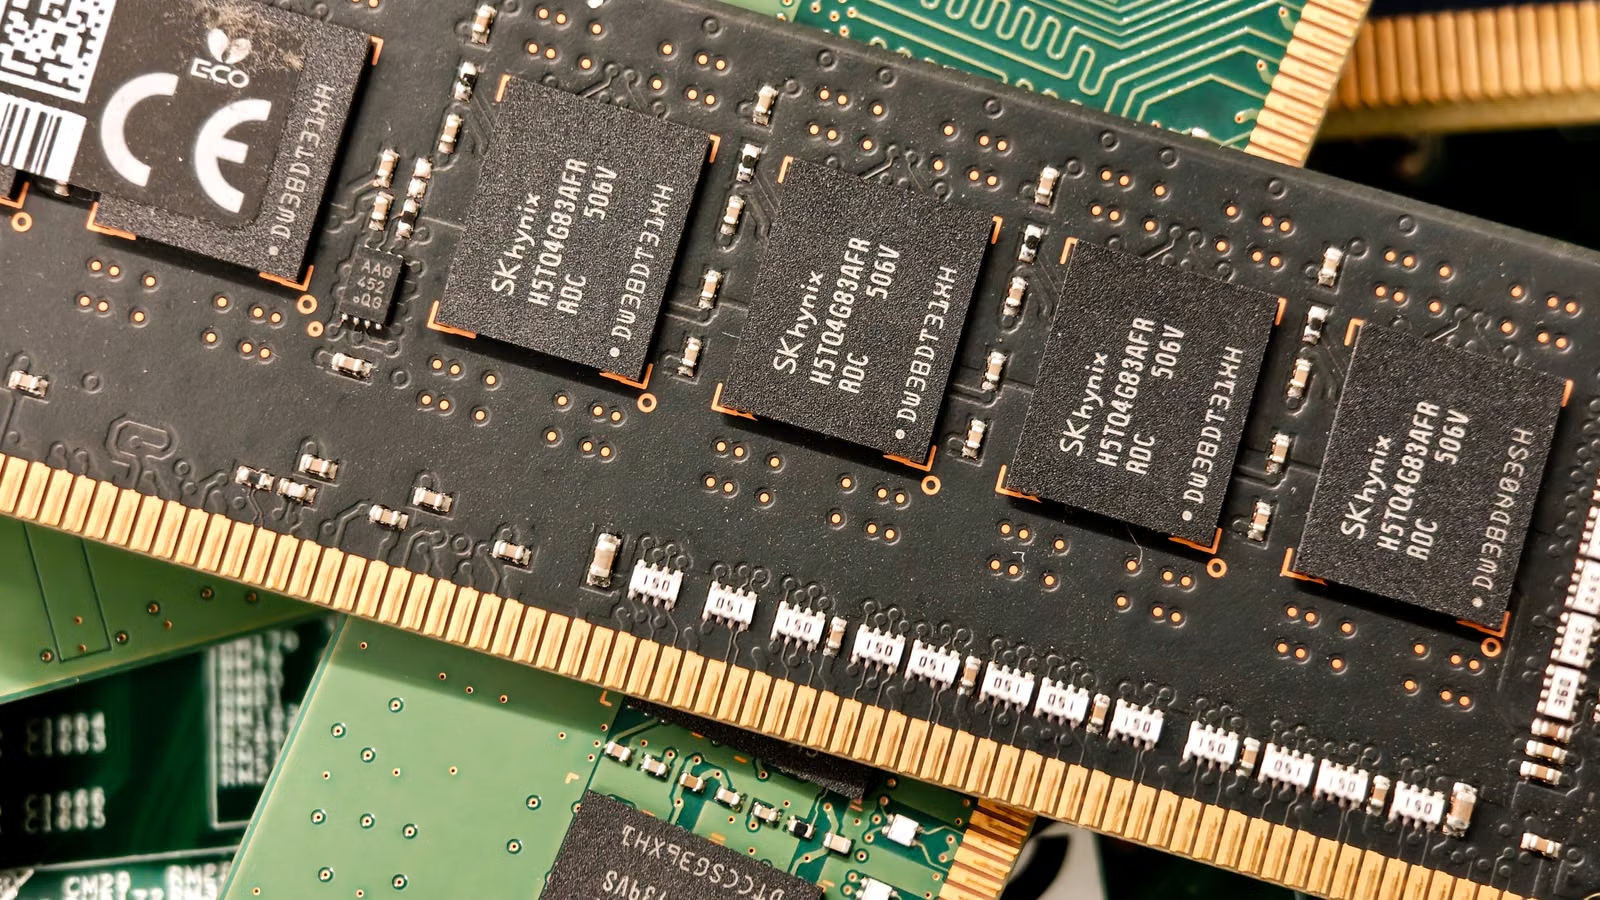
Micron’s HBM business share cannot be answered with one precise percentage, because the company does not consistently disclose HBM as a standalone revenue item. A better approach is to analyze HBM through Cloud Memory Business Unit, DRAM revenue, data center revenue, HBM4 ramp-up, customer agreements, and advanced packaging capacity. This helps you avoid mistaking all CMBU revenue for HBM, while also judging whether AI memory demand is only improving short-term revenue or beginning to reshape Micron’s long-term earnings structure.
Key Takeaways
- Micron does not fully disclose standalone HBM revenue, so HBM share should be estimated by range.
- CMBU is the key window for tracking HBM, but it is not the same as HBM revenue.
- DRAM revenue reflects the broader memory cycle, while HBM is the high-value segment within it.
- HBM4, customer qualification, and advanced packaging capacity determine future upside.
- When analyzing MU stock, look at revenue, gross margin, cash flow, and risk together.
Why Micron’s HBM Share Cannot Be Judged by One Number
You should not expect “how much of Micron’s revenue comes from HBM” to be a simple percentage directly available in a financial statement. The reason is straightforward: HBM is a product technology category, CMBU is a business-unit category, DRAM is a technology category, and data center revenue is an end-market category. These categories overlap, but they are not the same. When Micron announced its market-focused business-unit reorganization in 2025, it defined the Cloud Memory Business Unit as covering memory solutions for large cloud customers and HBM for all data center customers. This makes CMBU the closest reporting window for HBM, but not a dedicated HBM revenue line.
HBM is special because it is both part of DRAM and highly dependent on advanced packaging, TSV, stacking yield, customer qualification, and GPU / ASIC platform integration. Standard DRAM can be used in servers, PCs, smartphones, vehicles, and industrial devices. HBM is mainly tied to AI accelerators and high-performance computing platforms. If you only look at total DRAM revenue, you may underestimate HBM’s high-value characteristics. If you treat all CMBU revenue as HBM revenue, you will likely overestimate HBM’s true share.
A clearer approach is to separate the disclosure layers first:
| Reporting Lens | What It Can Tell You | What It Cannot Tell You |
|---|---|---|
| HBM | Demand for high-bandwidth memory used in AI accelerators | Micron does not consistently disclose full standalone HBM revenue |
| CMBU | The main window for cloud memory and HBM | It cannot be treated entirely as HBM |
| DRAM | Micron’s memory pricing and shipment cycle | It does not separate HBM, DDR, LPDDR, and GDDR |
| Data center revenue | Strength of AI infrastructure demand | It cannot all be attributed to HBM |
| Strategic customer agreements | Visibility into long-term supply and pricing | They cannot be directly converted into quarterly HBM share |
From a search-intent perspective, international investors often search for terms such as “Micron HBM revenue,” “MU HBM exposure,” “Micron CMBU revenue,” “HBM share of Micron revenue,” and “Micron AI memory stock.” Behind these searches, the real question is not just a percentage. Investors want to know whether MU’s AI memory story has become verifiable revenue, margin expansion, and cash flow.
Summary: The first step in analyzing Micron’s HBM share is not to apply a formula, but to define the reporting lens. HBM is a high-end DRAM product, CMBU is the closest business-unit window, DRAM is the broader technology revenue pool, and data center revenue reflects end-market demand. You can use CMBU as the main HBM tracking window, DRAM as the broader pricing-cycle backdrop, and data center revenue as a signal of AI demand strength. But these categories should not be used interchangeably. As long as Micron does not fully disclose standalone HBM revenue, the most reasonable approach is to build a range-based and trend-based framework rather than chase a precise but unreliable single-point estimate.
Where HBM Appears in Micron’s Financial Reporting
If you want to find Micron’s HBM revenue clues, you should first look at CMBU, then DRAM, and then CDBU and other data center-related products. In Micron’s FQ3 2026 earnings release, the company reported total revenue of $41.456 billion, DRAM revenue of $31.328 billion, accounting for 76% of total revenue, CMBU revenue of $13.769 billion, or about 33% of total revenue, and CDBU revenue of $11.524 billion, or about 28% of total revenue. These numbers show that AI-related memory and data center demand are very strong, but they still do not provide a precise standalone HBM share.
CMBU is the most important entry point to watch. It covers memory solutions for large hyperscale cloud customers and HBM for all data center customers. In other words, if HBM ramps quickly, it is most likely to show up first in CMBU revenue growth, gross margin improvement, and management commentary. But CMBU also includes other cloud memory products, such as high-capacity DDR, low-power server DRAM, GDDR, and other memory solutions for cloud customers. That means CMBU is better used as an “HBM-related upper-bound window,” not as HBM itself.
DRAM revenue answers a different question: whether Micron is benefiting from a strong memory cycle. In its FQ3 2026 presentation materials, Micron disclosed that DRAM ASP increased in the low-60% range sequentially, while bit shipments increased only in the low-single-digit range. This means revenue growth was driven mainly by pricing and product mix rather than shipment volume alone. HBM clearly contributes to product mix, but not all ASP improvement should be attributed to HBM.
CDBU should not be ignored either. CDBU includes memory solutions for OEM data center customers, as well as storage solutions for all data center customers. AI data centers need more than HBM. They also need high-capacity server DRAM, SOCAMM, enterprise SSDs, QLC SSDs, PCIe Gen6 SSDs, and other products. Micron’s announcement of HBM4, PCIe Gen6 SSD, and SOCAMM2 presented AI-optimized memory and data center SSDs together, showing that AI infrastructure demand is spreading across multiple storage layers.
| Metric | FQ3 2026 Data | Relationship to HBM |
|---|---|---|
| Total revenue | $41.456 billion | Baseline for company-wide growth |
| DRAM revenue | $31.328 billion | HBM is the high-value segment within this category |
| CMBU revenue | $13.769 billion | The closest business-unit window for HBM |
| CDBU revenue | $11.524 billion | Indicates AI data center spillover demand |
| Non-GAAP gross margin | 84.9% | Result of stronger pricing and high-value product mix |
Summary: To find HBM in Micron’s financials, you should not focus on one revenue line alone. Instead, analyze the layers. CMBU is closest to HBM, but it includes more than HBM. DRAM revenue reflects pricing and high-value product mix, but does not isolate HBM. CDBU shows that AI data center demand is also spilling over into SSDs, NAND, and server storage. A more reliable approach is to first look at CMBU as a percentage of total revenue, then study DRAM ASP and margin trends, and finally combine those signals with HBM4 shipments, customer platforms, and packaging capacity to judge whether HBM is moving from a story-driven catalyst to a real profit driver.
How to Estimate Micron’s HBM Business Share When Data Is Unavailable
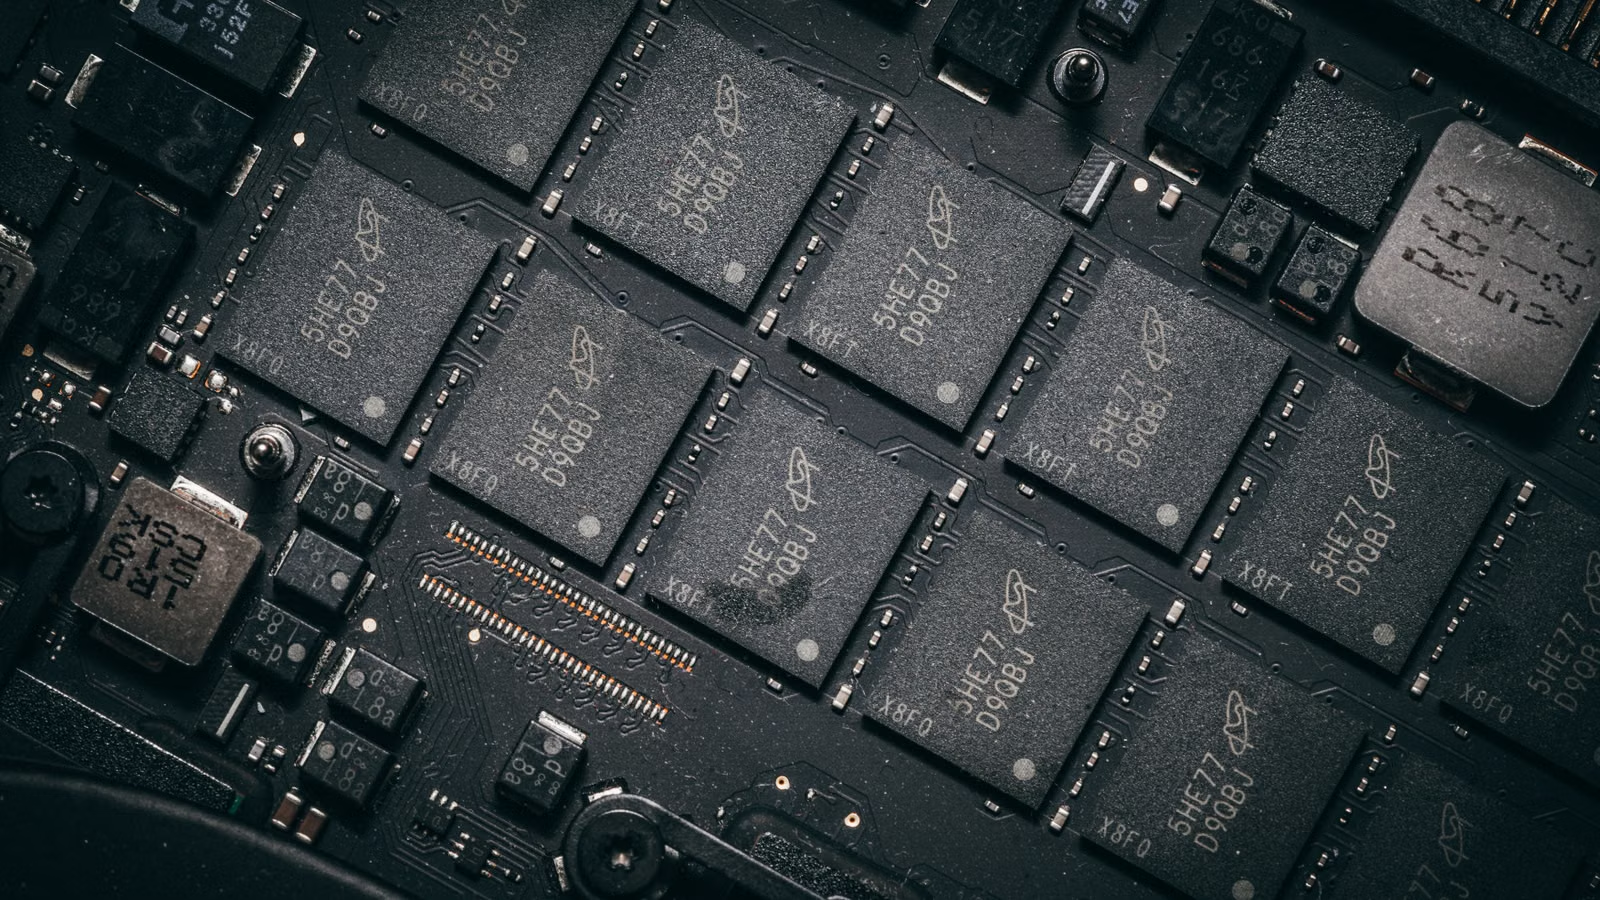
When standalone HBM data is unavailable, you should estimate it through four steps: upper bound, lower bound, trend, and verification. The upper bound can be based on CMBU, because HBM sits within this observation window. The lower bound should not come from rumors or isolated product milestones unless the company clearly links them to revenue or shipments. The trend should be checked through CMBU, DRAM ASP, gross margin, customer agreements, and capacity expansion. The verification items are HBM4, HBM4E, TSV, advanced packaging, and customer platform adoption.
First, establish an upper bound. FQ3 2026 CMBU revenue was $13.769 billion, about 33% of total revenue. In theory, HBM cannot exceed the portion of CMBU that is related to HBM, and certainly cannot exceed total CMBU revenue. This upper bound is broad, but it prevents you from mistakenly treating all DRAM revenue or all data center revenue as HBM.
Second, identify confirmed data points. In its FQ3 2026 prepared remarks, Micron stated that its HBM4 12-high ramp was twice as fast as its HBM3E 12-high ramp, and that it had already shipped more than $1 billion of HBM4 revenue. This is important because it confirms that HBM4 has reached commercial revenue scale. But it still does not tell you total quarterly HBM share, because it does not cover all HBM generations, all customers, or the full quarterly revenue mix.
Third, track ratios to judge direction. Useful ratios include:
| Estimation Metric | Calculation | Question It Helps Answer |
|---|---|---|
| CMBU / total revenue | 13.769 / 41.456 | How large is the HBM-related window within Micron? |
| CMBU / DRAM revenue | 13.769 / 31.328 | How important are cloud memory and HBM-related products within DRAM? |
| CDBU / total revenue | 11.524 / 41.456 | How strong is AI data center spillover demand? |
| DRAM ASP change | Sequential increase in the low-60% range | Are pricing and mix improving? |
| Gross margin trend | Non-GAAP gross margin of 84.9% | Are high-value products improving profitability? |
Fourth, adjust with qualitative variables. HBM revenue recognition does not depend only on demand. It also depends on packaging capability, yield, customer qualification, platform timing, and supply agreements. Micron has said Singapore will become an advanced packaging center of excellence, and that it expects meaningful contribution to HBM packaging capacity from the first half of 2027. This matters more than short-term market rumors because HBM bottlenecks are often not only about DRAM wafers, but also TSV, stacking, packaging, and testing.
Summary: When standalone HBM revenue is unavailable, you can use CMBU as an upper-bound reference, company-disclosed HBM4 shipments as confirmed evidence, CMBU / total revenue, CMBU / DRAM revenue, DRAM ASP, gross margin, and CDBU growth as trend indicators, and HBM4 ramp-up, customer platforms, TSV, and advanced packaging capacity as qualitative adjustments. The result is not a mechanical percentage, but a range-based framework that is more useful for investment analysis. For MU, the most important question is not exactly what percentage HBM represents today, but whether that share is rising and whether it can keep translating into higher gross margin and more stable customer relationships.
Where HBM Truly Affects Micron’s Growth Leverage
HBM affects Micron not only by increasing revenue share, but by changing revenue quality. In a traditional memory cycle, DRAM and NAND manufacturers are highly exposed to supply-demand swings. When prices rise, profit leverage is strong; when prices fall, earnings can weaken quickly. HBM is different because it is more closely tied to AI GPUs, ASICs, cloud capital expenditure, advanced packaging capacity, and long-term customer agreements. If customer demand remains strong and supply expansion remains constrained, Micron may benefit from higher ASP, higher gross margin, and stronger revenue visibility.
Micron’s HBM4 progress is especially important. In its HBM4 36GB 12H announcement, the company said the product had entered volume shipment in the first quarter of 2026 and was designed for NVIDIA’s Vera Rubin platform. It offers bandwidth of more than 2.8TB/s, 2.3 times the bandwidth of comparable HBM3E at the same capacity and stack height, and over 20% better energy efficiency. For investors, the significance is not that the specifications look impressive. The real question is whether Micron can secure a larger role in next-generation AI accelerator supply chains and capture more value in high-end memory.
Another driver is customer agreements. Micron disclosed that it had entered into 16 Strategic Customer Agreements, usually running from 2026 to 2030. Fourteen signed agreements represented about $100 billion of remaining agreement revenue at minimum contract prices, along with an expected $22 billion in customer deposits and related financial commitments. These agreements are not the same as HBM revenue, but they improve visibility into supply, pricing, and capital investment. If more HBM, DRAM, and NAND supply becomes tied to long-term agreements, Micron’s cyclical nature may not disappear, but its volatility pattern could change.
HBM also brings capital-expenditure pressure. Reuters, in its reporting on Micron’s increased 2026 capital-expenditure plan, noted that the company was raising manufacturing investment to meet AI-related memory demand, and that higher capex would remain a key market concern. You should not only look at HBM lifting gross margin. You also need to examine how expansion, packaging, EUV, cleanroom investment, and customer deposits affect free cash flow.
| Dimension | Positive Signal | Risk Signal |
|---|---|---|
| Revenue | HBM4 ramp-up, CMBU growth | Dependence on a single customer or platform |
| Gross margin | Higher ASP, stronger product mix | Pricing peak or competitor expansion |
| Capacity | Singapore packaging capacity ramp | TSV, yield, or packaging bottlenecks |
| Customers | Strategic customer agreements improve visibility | Take-or-pay execution risk or demand changes |
| Cash flow | High margins offset capex | Expansion pressure extends payback period |
Summary: The real importance of HBM for Micron is that it may partially shift the company from a traditional memory-cycle business toward a key AI infrastructure supplier. But that shift is not automatic. You need to watch whether HBM4 continues to ramp, whether CMBU keeps growing, whether gross margin remains high, whether advanced packaging capacity comes online as planned, and whether customer agreements convert into revenue and cash flow. If there is only a technology story without financial delivery, valuation can easily get ahead of fundamentals. If revenue, gross margin, customer agreements, and capacity progress improve together, HBM can become the core driver of MU’s long-term valuation reset.
How to View Micron’s HBM Competitive Position
When analyzing Micron’s HBM business, you should not look at Micron in isolation. You need to place it within the competitive structure dominated by SK hynix, Samsung, and Micron. HBM competition depends on customer qualification, capacity, yield, packaging, platform generation, and delivery reliability. TrendForce’s HBM Industry Analysis 2Q26 summary indicates that HBM demand remains strong in 2026, CSP / ASIC demand is supporting HBM3E pricing, SK hynix remains ahead, Samsung is recovering, and Micron is expanding TSV. This suggests that Micron is neither the only beneficiary nor a company without room to catch up.
The transition to HBM4 could reshape parts of the market. In the HBM3E phase, first-mover advantage and customer lock-in were critical. In the HBM4 phase, interface design, bandwidth, energy efficiency, base die, packaging, and customer co-design become even more important. If Micron continues to win customer qualification for HBM4 and HBM4E, it may increase its presence in AI accelerator platforms. Micron’s high-bandwidth memory product line emphasizes HBM for AI training and inference, which shows that the company has placed HBM at the center of its AI memory strategy.
However, you should not directly convert industry share into company revenue share. Industry share answers the question, “How much of the HBM market does Micron hold?” Company revenue share answers, “How much of Micron’s total revenue comes from HBM?” The first is affected by competition, while the second also depends on Micron’s DRAM, NAND, mobile, automotive, embedded, SSD, and other product mix. Counterpoint’s global DRAM and HBM market share data can help you understand the DRAM vendor landscape, but it still needs to be read alongside Micron’s own business-unit data.
Common mistakes include:
- Using NVIDIA supply-chain rumors to estimate Micron’s total HBM revenue;
- Treating all CMBU revenue as HBM revenue;
- Attributing all DRAM ASP increases to HBM;
- Ignoring NAND, SSD, and SOCAMM contributions in AI data centers;
- Looking only at market share while ignoring packaging capacity and customer agreements.
| Question | What You Should Watch | What You Should Not Use as a Substitute |
|---|---|---|
| Micron’s HBM market share | Customer qualification, product generation, industry reports | Micron’s total revenue share |
| HBM share of Micron revenue | CMBU, HBM shipments, management disclosures | Industry HBM share |
| HBM impact on margin | ASP, product mix, CMBU margin | A single product announcement |
| Whether valuation is reasonable | Revenue, cash flow, capex, risk | AI enthusiasm alone |
Summary: Micron’s HBM competitive position should be analyzed in two layers. Externally, look at industry share and customer platforms. Internally, look at revenue structure and profit contribution. SK hynix, Samsung, and Micron are all competing for key HBM4 and HBM4E customers. Micron’s opportunity comes from HBM4 volume production, TSV expansion, advanced packaging, and strategic customer agreements. Its risks come from competitor expansion, customer platform changes, and yield ramp-up. For ordinary investors, the safest method is not to rely on one supply-chain rumor, but to track whether Micron’s CMBU, HBM4, gross margin, and capex are all delivering at the same time.
How Ordinary Investors Can Apply HBM Analysis to MU Stock
When applying HBM analysis to MU stock, the key is not to decide whether “HBM is definitely bullish.” The real question is whether AI memory demand can keep translating into revenue, gross margin, cash flow, and stronger customer relationships. In its FQ4 2026 guidance, Micron guided for revenue of $50 billion plus or minus $1 billion, gross margin of about 86%, and non-GAAP EPS of $31 plus or minus $1. These metrics will become important benchmarks for testing HBM and AI memory leverage in the next stage.
You can build a quarterly tracking table instead of only reading headlines:
| Tracking Metric | Positive Signal | Risk Signal |
|---|---|---|
| CMBU revenue | Rising share and sequential growth | Slower growth or delayed customer demand |
| DRAM ASP | Staying high or rising moderately | Sharp decline or rising inventory pressure |
| Gross margin | High margin remains sustainable | Pricing weakens or mix deteriorates |
| HBM4 / HBM4E | Broader customer qualification and shipments | Delays in volume production, yield, or platform timing |
| Capex and FCF | Investment begins to support cash-flow growth | Expansion pressure becomes too heavy |
| Strategic customer agreements | RPO and deposits improve visibility | Execution or demand-change risks |
Trading costs also matter. If you follow U.S.-listed AI hardware-chain stocks such as MU, NVDA, AMD, and AVGO, you should study not only earnings, but also actual transaction costs. U.S. stock trading costs may include not only commissions, but also platform fees, external agency fees, transaction activity fees, settlement-related costs, and other charges. For example, Biya U.S. stock trading fees state that U.S. stock trading commission is $0, while platform fees, external agency fees, and other charges are subject to the fee schedule and the order page. Understanding fee structure before trading is more reliable than only looking at “zero commission.”
For beginners, MU analysis can be divided into three types of questions:
- Business question: Is HBM continuing to expand its revenue contribution?
- Financial question: Can high gross margin offset rising capex?
- Trading question: Are the fees for buying, selling, fractional shares, and different order sizes clear?
If related services are available in your region, you can use Biya to track U.S. and Hong Kong stock quotes, and use U.S. stock information search to build a watchlist covering MU, NVDA, AMD, AVGO, and other AI hardware-chain stocks. Service availability depends on your location, identity verification result, platform rules, and applicable laws and regulations.
Summary: When applying HBM analysis to MU stock, do not stop at “what percentage of revenue is HBM?” The better question is whether HBM share growth is flowing through the income statement and cash-flow statement. CMBU growth, rising DRAM ASP, sustained high gross margin, expanding HBM4 shipments, and strategic customer agreements are all positive signals. Higher capex, competitor expansion, customer concentration, inventory reversal, and slowing AI capital expenditure are risks to watch. The trading side also matters: beyond analyzing earnings, you should understand order fees, platform rules, and your own risk tolerance. Public market information can improve judgment quality, but it cannot replace your own investment decision.
If you continue to follow MU, AI storage, HBM4, the DRAM cycle, and data center capital expenditure, you can turn your research into a repeatable process. After each earnings release, update CMBU, CDBU, DRAM, NAND, gross margin, and capex first. Then track HBM4 / HBM4E customer qualification, advanced packaging capacity, and strategic customer agreements. Finally, compare the stock price, valuation, and trading cost before deciding whether to keep monitoring or adjust your position. The Biya App can be used to view multi-asset market information and trading details, but any U.S. stock, Hong Kong stock, or digital asset transaction should follow platform rules, order-page disclosures, local regulatory requirements, and your own risk tolerance. Public information analysis does not constitute investment advice. Popular AI semiconductor stocks may experience significant volatility when earnings delivery, valuation expectations, and market sentiment change.
FAQ
Why does Micron not disclose an exact HBM revenue share?
Micron does not disclose an exact HBM revenue share because it reports data by business unit, technology category, and end market. HBM is usually included within CMBU and DRAM-related reporting, but CMBU also contains other cloud memory products, so it does not provide a clean HBM percentage.
Can CMBU revenue represent Micron’s HBM revenue?
CMBU revenue cannot directly represent Micron’s HBM revenue. It is the closest reporting window for HBM, but it also includes other memory solutions for large cloud customers. You can use CMBU to track HBM-related trends and upper-bound exposure, but not as a one-to-one substitute for HBM.
What does Micron HBM4 volume production mean for MU stock?
Micron HBM4 volume production means the company is competing in the next generation of AI memory supply chains, but it does not guarantee stock-price upside. Investors still need to watch customer adoption, shipment scale, gross margin, advanced packaging capacity, capex, and market expectations.
How is Micron HBM different from standard DRAM?
Micron HBM is a high-bandwidth stacked DRAM product used mainly in AI accelerators and high-performance computing. It typically requires TSV, advanced packaging, and customer platform qualification. Standard DRAM has broader use cases, including servers, PCs, smartphones, vehicles, and industrial applications, and is more directly exposed to the traditional memory pricing cycle.
How can ordinary investors track Micron’s HBM progress?
Ordinary investors can track CMBU revenue, DRAM ASP, gross margin, HBM4 / HBM4E shipments, advanced packaging capacity, strategic customer agreements, and management guidance. Supply-chain rumors should not be the main basis for judgment. Company earnings releases and investor materials are more reliable reference points.
Is a rising Micron HBM share always positive?
A rising Micron HBM share is not always positive by itself. It can improve product mix and gross margin, but it may also come with higher capex, customer concentration, yield ramp-up risk, packaging bottlenecks, and a potential reversal in the memory cycle. Investment judgment should combine financial data, valuation, and risk tolerance.
*This article is provided for general information purposes and does not constitute legal, tax or other professional advice from BiyaPay or its subsidiaries and its affiliates, and it is not intended as a substitute for obtaining advice from a financial advisor or any other professional.
We make no representations, warranties or warranties, express or implied, as to the accuracy, completeness or timeliness of the contents of this publication.
Related Blogs of

What Are the Bottlenecks in HBM Packaging? CoWoS, TCB, and the Link to Equipment Suppliers


How Do Dell’s AI Server and Storage Businesses Affect Its Stock Price?


Is Pure Storage an AI Storage Stock? An Analysis of All-Flash Storage, Subscription Revenue, and Enterprise Customers


Can SMIC Produce Memory Chips? The Difference Between a Wafer Foundry and a Memory Design Company

Choose Country or Region to Read Local Blog
 Australia
 Austria
 Belgium
 Canada
 Cyprus
 Czech Republic
 Denmark
 Estonia
 Finland
 France
 Germany
 Greece
 Hong Kong
 India
India Indonesia
 Ireland
 Italy
Italy Japan
Japan Latvia
 Lithuania
 Luxembourg
 Malaysia
 Malta
Malta Morocco
 Nepal
Nepal Netherlands
 New Zealand
 Norway
 Pakistan
 Philippines
 Poland
 Portugal
 Romania
 Singapore
 Slovakia
 Slovenia
 South Africa
 South Korea
 Spain
Spain Sweden
 Thailand
 The United States
 Turkey
 United Arab Emirates
 United Kingdom
 Vietnam
Contact Us




BIYA GLOBAL LLC is registered with the Financial Crimes Enforcement Network (FinCEN), an agency under the U.S. Department of the Treasury, as a Money Services Business (MSB), with registration number 31000218637349, and regulated by the Financial Crimes Enforcement Network (FinCEN).
BIYA GLOBAL LIMITED is a registered Financial Service Provider (FSP) in New Zealand, with registration number FSP1007221, and is also a registered member of the Financial Services Complaints Limited (FSCL), an independent dispute resolution scheme in New Zealand.