What Signals Appear Before Storage Prices Peak? Inventory, Capex, Orders, and Gross Margin




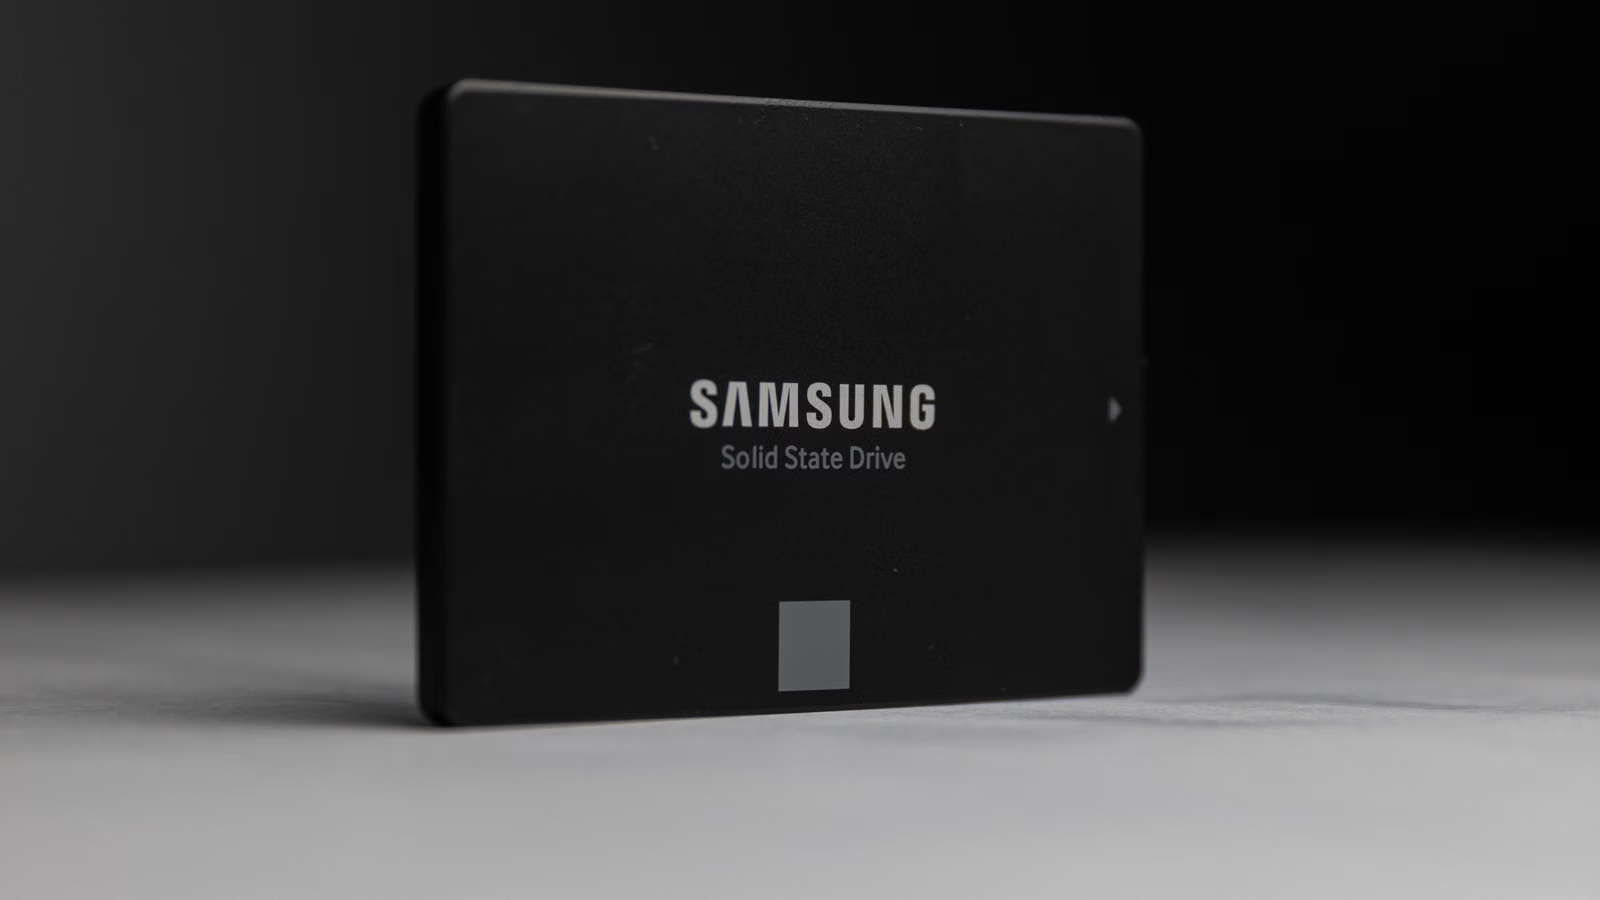
Before storage prices peak, the signal is usually not just that “prices stop rising.” Inventory, capex, orders, gross margin, and customer purchasing behavior often shift together. DRAM, NAND, HDDs, and enterprise SSDs each follow different cycle rhythms, but the core framework is similar: whether price increases are slowing, inventory is rising, suppliers are expanding capacity, customers are shifting from rush buying to waiting, and gross margins are no longer expanding. You should not wait until prices actually fall before judging that the cycle is weakening, because stock prices and order expectations often react earlier.
Key Takeaways
- Before storage prices peak, the earliest change is often slower price increases, not an immediate price decline.
- A shift from shortage to inventory replenishment is a key signal for DRAM, NAND, and HDD cycles.
- Supplier capex expansion, cleanroom additions, and future capacity releases can weaken pricing power.
- Falling order visibility, customer hesitation, and fewer long-term contracts often appear before revenue weakens.
- Record-high gross margin does not always mean the cycle will keep rising; FCF, inventory, and valuation also matter.
A Storage Price Peak Does Not Mean Prices Fall Immediately
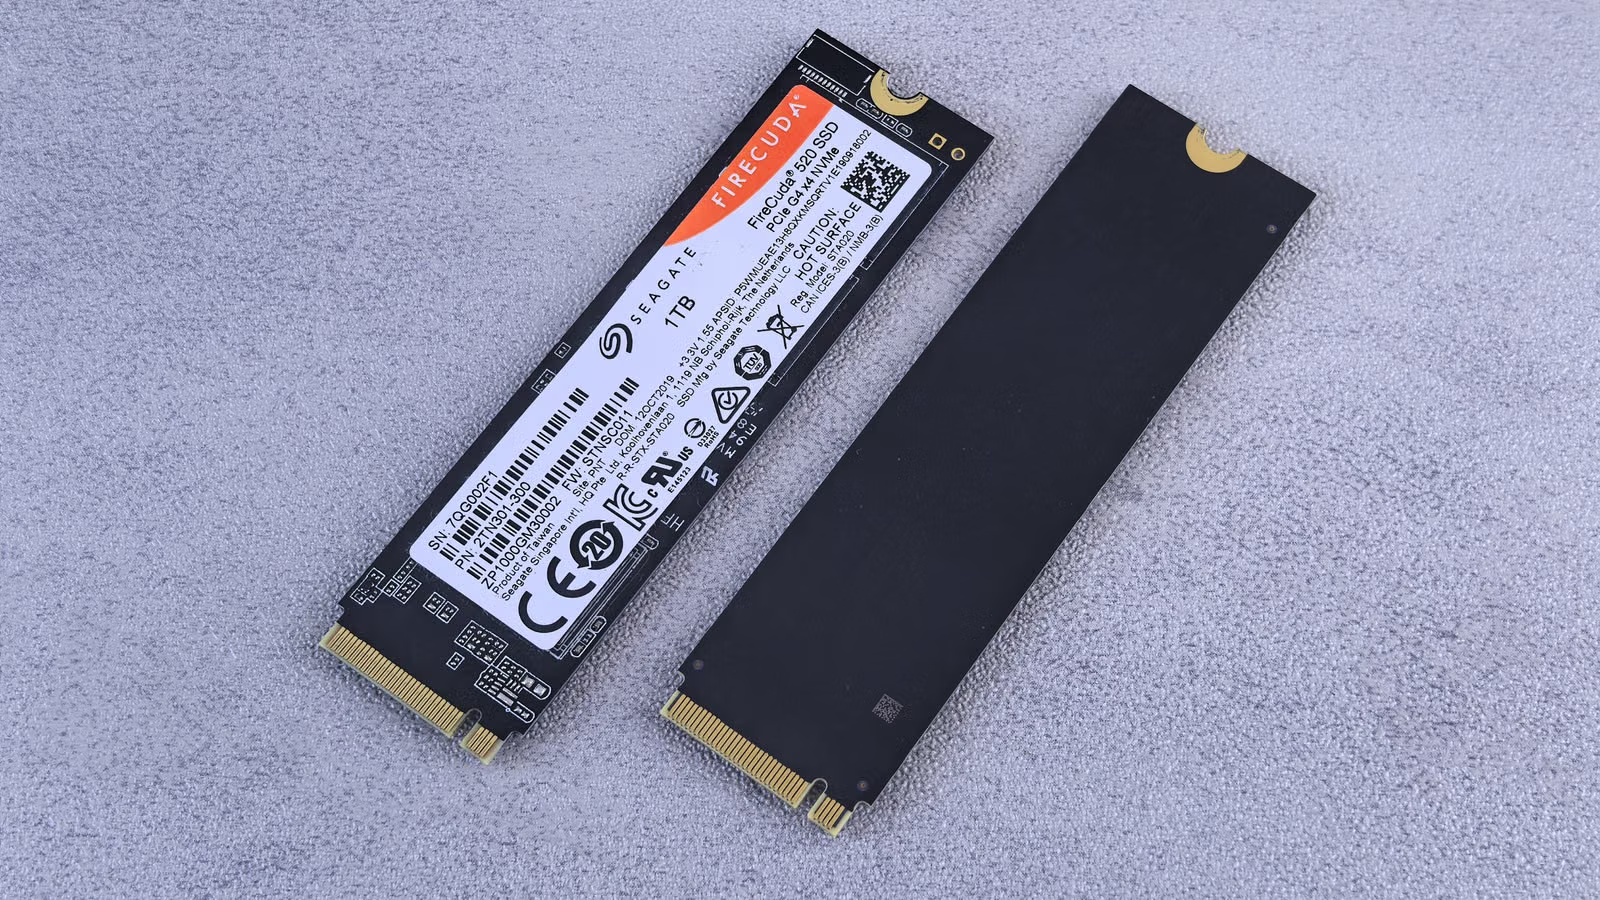
Before storage prices peak, prices often continue to rise, but the pace of increases begins to slow, customer acceptance weakens, inventory replenishment accelerates, and suppliers prepare to release more capacity. You should not wait until DRAM, NAND, or HDD quotes officially decline before judging that the cycle is weakening. Storage stocks usually trade on future earnings revision potential. When prices are still rising but the pace narrows, the market may already begin reassessing the cycle position.
The storage price cycle usually has three stages. The first stage is rapid price increases, active customer restocking, and stronger supplier pricing power. The second stage is when prices are still rising but the increase is lower than the previous quarter, and customers begin negotiating harder or maintaining only necessary inventory. The third stage is when reported revenue and gross margin still look strong, but orders, inventory, and guidance have already started to show marginal changes.
This was clear in the 2026 DRAM and NAND cycle. TrendForce’s statistics on 1Q26 DRAM industry revenue showed that conventional DRAM contract prices rose about 93%–98% sequentially, driving DRAM industry revenue up 81% sequentially to $97 billion. By the third quarter, however, TrendForce’s 3Q26 storage price forecast expected conventional DRAM contract prices to rise 13%–18% and NAND Flash contract prices to rise 10%–15%, a much slower pace.
| Cycle Stage | Price Behavior | Customer Behavior | What Investors Should Watch |
|---|---|---|---|
| Early upcycle | Prices rise quickly | Active inventory replenishment | ASP, bit shipments, order growth |
| Late upcycle | Prices still rise but slower | Price negotiation or hesitation begins | Inventory, orders, customer affordability |
| Around the peak | Quotes begin to diverge | Consumer-end demand reduces purchases | Gross margin, FCF, guidance changes |
| Early downcycle | Prices begin to fall | Destocking | Revenue growth, inventory days, capex |
Stock prices can weaken even while storage prices are still rising, because cyclical stocks are priced on “how much future earnings can still be revised upward.” Quotes reflect current supply and demand. Earnings reports reflect revenue and profit that have already happened. Stock prices reflect expectations for the next several quarters. When the market believes the strongest phase of price increases has passed, valuations may adjust before spot or contract prices actually fall.
Summary: A storage price peak is not a single moment. It is the gradual accumulation of several signals. You should not only check whether DRAM or NAND prices are still rising. You should also watch whether the pace of price increases, customer behavior, inventory, and gross margin are changing together. In the late stage of a price upcycle, the market cares more about whether future growth can continue to be revised upward than about current quotes themselves. For storage stocks, prices that are still rising but rising more slowly are usually the first warning signal. If that is followed by customer hesitation, rising inventory, and stalled margin expansion, the cycle may already be entering its second half.
Inventory: The Turning Signal From “Shortage” to “Over-Restocking”

Inventory is one of the most important leading signals before storage prices peak. When customer inventory is low and supplier inventory is tight, DRAM, NAND, HDD, and enterprise SSD prices are more likely to rise. But if customers pre-buy, channel inventory rises, and supplier days of inventory increases, the price cycle may be entering its later stage. You need to look at supplier inventory, customer inventory, and channel inventory together, rather than relying on one company’s inventory figure.
Supplier inventory is the most direct measure. Low inventory days usually mean tight supply, longer lead times, and price support. Normalizing inventory suggests supply and demand are starting to balance. Excessive inventory raises the risk of price declines. Micron’s FY2026 Q3 prepared remarks showed inventory of $8.6 billion and days of inventory of 120, while also stating that DRAM inventories were very tight and below 120 days. That kind of inventory condition supports pricing, but if inventory days keep rising in future quarters, it may indicate the price cycle is entering its second half.
Customer inventory is just as important. PC, smartphone, server, and cloud customers may all pre-buy during the early stage of a price upcycle. In the short term, pre-buying amplifies demand. In the medium term, if end demand falls short of expectations, customers may reduce new orders, creating the next wave of destocking pressure. Tom’s Hardware’s report based on TrendForce data noted that consumer affordability is starting to limit further rapid storage price increases, with notebooks, smartphones, and client SSD demand under pressure.
Channel inventory should be separated into consumer-end and enterprise-end inventory. Consumer-end products include USB drives, memory cards, client SSDs, and PC DRAM, which are more sensitive to price. Enterprise-end products include HBM, server DRAM, enterprise SSDs, and nearline HDDs, which are more influenced by AI and hyperscaler demand. Rising consumer-end inventory is often an early warning signal, while rising data center inventory has a larger impact on the overall cycle.
| Inventory Type | Healthy Condition | Pre-Peak Risk Signal | Impact on Price Cycle |
|---|---|---|---|
| Supplier inventory | Low inventory, long lead times | Days of inventory rises continuously | ASP increases slow |
| Customer inventory | Demand-based purchasing | Pre-buying followed by fewer new orders | Next-quarter order volatility |
| Channel inventory | Normal turnover | Client SSD or PC DRAM stockpiling | Consumer-end price pressure |
| Data center inventory | Tight supply | Cloud vendor procurement slows | Enterprise product price pressure |
When judging inventory, remember that “low inventory” and “real demand” are not the same thing. Low inventory may result from strong demand, but it may also result from suppliers intentionally limiting shipments. Rising inventory may indicate normal replenishment, but it may also mean downstream products are not selling. A more reliable approach is to look at inventory together with bit shipments, orders, lead times, and ASP. If inventory rises while orders remain strong and lead times remain long, the risk is limited. If inventory rises while orders shorten and ASP growth slows, caution is warranted.
Summary: Inventory changes often reveal cycle risk before prices actually fall. You should separate supplier inventory, customer inventory, and channel inventory. Low supplier inventory suggests tight supply. Low customer inventory suggests real demand. Healthy channel inventory suggests prices are passing through smoothly. By contrast, if customers pre-buy, channel inventory builds up, and supplier inventory days rise, peak risk increases even if quotes are still rising. For Micron, Samsung, SK Hynix, Western Digital, and Seagate, inventory trends often explain future risk better than one quarter of revenue.
Capex: When Does Supplier Expansion Start Pressuring Storage Prices?

Capex is a core indicator for future supply pressure in storage prices. Rising storage prices encourage suppliers to expand capacity, but there is usually a lag between cleanroom expansion, equipment installation, process migration, and actual bit supply release. Before prices peak, you should watch whether suppliers are materially raising capex, whether HBM is crowding out traditional DRAM capacity, whether NAND cleanroom space is being reallocated, and when new capacity will enter the market.
A capex increase is usually positive in the short term because it indicates strong demand, tight supply, and customers willing to secure future capacity. But in the medium term, capex becomes future supply. New wafer starts, equipment deployment, and cleanroom expansion eventually release more bit supply and weaken ASP leverage. In its FY2026 Q2 results, Micron reported quarterly capital expenditures of $5 billion and adjusted free cash flow of $6.9 billion. By Q3, capex had risen to $7.1 billion, showing that industry expansion was accelerating.
For DRAM, investors also need to watch the HBM trade ratio. HBM provides fewer bits per wafer than conventional DRAM and consumes more advanced capacity, so HBM expansion can crowd out conventional DRAM bit supply. In its FY2026 Q2 earnings materials, Micron said cleanroom constraints, long construction lead times, higher HBM trade ratio, and node migration bits-per-wafer declines would constrain DRAM bit supply. This is one reason conventional DRAM may remain tight when AI memory demand is strong.
For NAND, the key is cleanroom allocation. If suppliers shift cleanroom space toward DRAM and HBM, NAND supply can remain tight in the short term. But if NAND prices rise enough to attract renewed expansion, future NAND pricing leverage may decline. TrendForce’s 2Q26 NAND Flash price outlook expected NAND Flash contract prices to rise 70%–75% sequentially, with AI and data center demand as key drivers. However, such large price increases also encourage suppliers to reassess capacity allocation.
| Capex Signal | Short-Term Meaning | Medium-Term Risk | What to Watch |
|---|---|---|---|
| Capex increase | Strong demand, tight supply | Future supply growth | Capacity release timing |
| HBM expansion | Strong AI memory demand | Conventional DRAM supply squeezed | HBM trade ratio |
| NAND cleanroom reallocation | NAND supply tight in the short term | Future re-expansion | Enterprise SSD demand |
| Equipment orders increase | Industry confidence | Overcapacity in the next downcycle | Wafer starts |
| New fab ramp | Supply chain expansion | Rising ASP pressure | Capacity utilization |
The difficulty with capex is timing. Early in a price upcycle, capex increases confirm strong demand. Late in a price upcycle, capex increases may mean suppliers are preparing for future supply release. When judging whether prices are near a peak, you should not only look at absolute capex. You should also look at when new capacity will come online, whether it targets HBM or conventional DRAM, and whether it targets enterprise SSDs or consumer NAND.
Summary: Capex is a medium-term signal for judging whether storage prices are near a peak. Early in a price upcycle, higher supplier capex usually means strong demand and tight supply. Late in the upcycle, however, large-scale expansion may mean future supply pressure is forming. For DRAM, the key is whether HBM continues to crowd out conventional bit supply. For NAND, the key is whether cleanroom allocation and enterprise SSD demand can absorb new supply. Capex does not immediately change prices, but it changes market expectations for future ASP and gross margin. Once capex increases, inventory rises, and price growth slows at the same time, peak risk rises meaningfully.
Orders: The Shift From Rush Buying to Waiting Is a Key Pre-Peak Change
Order changes often reveal a storage price peak earlier than earnings revenue does. When customers are willing to sign long-term agreements, accept price floors, pay deposits, or lock in supply early, it indicates strong demand and tight supply. When customers begin shortening order cycles, reducing prepayments, delaying deliveries, or waiting for spot prices, it suggests that price increases are approaching the limit of customer tolerance. You should focus on order visibility, backlog, remaining performance obligations, and customer purchasing cadence.
Long-term agreements are a sign of strong demand. Reuters’ report on Micron’s customer agreements said Micron had signed multi-year agreements with 16 strategic customers involving take-or-pay commitments, cash deposits, and price floors, with related commitments reaching $22 billion. When customers are willing to lock in supply, it usually means supply and demand may remain tight over the next several quarters.
However, long-term agreements should also be monitored for later changes. If new agreements decline, prepayments fall, lead times normalize, and customers shift from long-term contracts to shorter orders, it means customers are no longer afraid of not getting supply; they are beginning to worry about overpaying. This behavior change often appears before reported revenue weakens, because revenue recognition lags order activity.
Order signals matter for HDDs and SSDs as well. HDD orders depend on hyperscaler nearline demand, while SSD orders depend on data center SSDs, AI context storage, and enterprise SSD supply. Seagate’s FY2026 Q3 results showed revenue of $3.11 billion, GAAP gross margin of 46.5%, and free cash flow of $953 million. Western Digital’s FY2026 Q3 results showed revenue of $3.34 billion, up 45% year over year, GAAP gross margin of 50.2%, and free cash flow of $978 million. These figures show that cloud high-capacity storage demand remains strong, but future order duration still needs to be monitored.
| Order Signal | Upcycle Phase | Pre-Peak Change | Investment Implication |
|---|---|---|---|
| Long-term agreements | Customers actively lock supply | New agreements decrease | Order visibility declines |
| Prepayments | Customers are willing to pay | Deposits decrease or disappear | Pricing power weakens |
| Lead times | Continue to lengthen | Return to normal | Supply-demand balance improves |
| Order structure | High long-term contract share | Short orders increase | Customer confidence declines |
| Guidance wording | Demand exceeds supply | Customers digest inventory | Cycle risk rises |
Orders should also be evaluated by customer type. Cloud vendors, server OEMs, and enterprise customers care more about future supply stability, while consumer electronics customers care more about cost and end demand. If consumer customers cut orders first but data center customers are still locking supply, the cycle may not reverse immediately. But if data center customers also begin waiting, storage price peak risk rises sharply.
Summary: Orders are one of the most important validation signals in the storage price cycle. Whether prices are strong ultimately depends on whether customers are willing to lock in supply early, accept pricing terms, pay deposits, and maintain long-term contracts. If customers start shortening order cycles, delaying delivery, or waiting for spot prices, it means price increases are approaching the limit of tolerance. For DRAM, NAND, HDDs, and enterprise SSDs, order changes often reveal future risk earlier than current-quarter revenue. You should pay close attention to long-term contracts, backlog, remaining performance obligations, lead times, and customer purchasing cadence.
Gross Margin: High Margins Are Not the Danger; Margin Peaking Is
High gross margin by itself is not a signal that storage prices have peaked. The warning sign is when gross margin shifts from rapid expansion to stagnation. When ASP continues to rise, product mix improves, inventory is low, and utilization is high, gross margin can remain elevated. But if gross margin is already near historical highs while price growth slows, inventory rises, and orders shorten, the market may be entering a cyclical high.
Gross margin expansion usually comes from five factors: ASP increases, a higher-end product mix, better capacity utilization, fewer inventory write-downs, and a higher share of data center, HBM, enterprise SSD, and nearline HDD products. In its FY2026 Q3 results, Micron reported total revenue of $41.46 billion, GAAP gross margin of 84.9%, and operating cash flow of $25.39 billion. This level of gross margin shows very strong pricing and product mix, but it also means the market will become more sensitive to whether expansion can continue.
Before gross margin peaks, several signals often appear together: gross margin remains high but the sequential improvement narrows; ASP still rises but bit shipments slow; management begins emphasizing customer affordability or cost pressure; free cash flow no longer improves along with profit; inventory days start rising again. Any one of these signals alone may be short-term noise. If they appear together, they are more likely to indicate that the cycle is entering its second half.
Free cash flow is a better test of cycle quality than EPS. EPS reflects accounting profit, while FCF shows whether price increases are actually turning into cash. Micron’s FY2026 Q3 adjusted free cash flow was $18.3 billion. Seagate and Western Digital also reported strong free cash flow during the same period, indicating that the current storage cycle still has fundamental support. But if future profits remain strong while cash flow weakens, investors should watch for pressure from accounts receivable, inventory, and capex.
| Gross Margin Signal | Healthy Condition | Peak Risk | How to Judge |
|---|---|---|---|
| Gross margin level | High and still expanding | High but no longer expanding | Sequential change |
| ASP | Rising with demand support | Rising but customer resistance increases | Orders and inventory |
| Product mix | Higher-end products increase | Low-end products drag margins | HBM/SSD/HDD mix |
| FCF | Improves with profit | Profit strong but cash flow weak | Operating cash flow |
| Inventory | Low inventory supports pricing | Inventory days rise | Days of inventory |
If you follow U.S.-listed storage companies such as Micron, Seagate, Western Digital, NetApp, or Pure Storage, you should also pay attention to actual trading costs in addition to earnings indicators. U.S. stock trading costs may include more than commissions; they may also include platform fees, external agency fees, trading activity fees, and other charges. If related services are available in your region, Biya can be used to follow U.S. and Hong Kong stocks. Its U.S. stock trading fees state that Biya charges $0 commission for U.S. stock trading, while platform fees, external agency fees, and other fees are subject to the fee center and order page. Service availability depends on your location, identity verification results, platform rules, and applicable laws and regulations.
Summary: Gross margin is an important indicator of storage price cycle quality, but it should not be viewed in isolation. High gross margin shows strong pricing, product mix, and utilization. Margin peaking means price increases are starting to meet resistance. You should look at gross margin together with ASP, bit shipments, inventory, orders, and FCF. If gross margin is still expanding at a high level, inventory is low, orders are strong, and cash flow improves, the cycle remains healthy. If gross margin stagnates at a high level, inventory rises, and orders shorten, peak risk rises meaningfully. For cyclical stocks, the danger is not high gross margin itself; it is when the market begins to believe high gross margin can no longer improve.
How to Build a Storage Price Peak Signal Dashboard
You can use a six-factor dashboard to judge whether storage prices are nearing a peak: price growth rate, inventory, capex, orders, gross margin, and cash flow. A single indicator can easily mislead because DRAM, NAND, HDDs, and SSDs follow different cycle rhythms. A more effective method is to separate leading indicators, intermediate indicators, and lagging indicators, then build a framework for judging whether “prices are still rising, but the cycle is weakening.”
Leading indicators include price momentum, inventory, and orders. Whether price increases are slowing, customer inventory is rising, long-term contracts are decreasing, lead times are normalizing, and consumer-end demand is under pressure are all indicators that usually change before revenue and gross margin. Intermediate indicators include capex, bit supply, and product mix. Whether supplier capex is rising, cleanroom capacity is expanding, HBM is crowding out DRAM supply, and NAND supply is being released again will influence supply and demand over the next two to six quarters. Lagging indicators include gross margin, FCF, and management guidance. Whether gross margin stops expanding, FCF fails to keep up with profit, and management begins emphasizing inventory digestion usually confirms that the cycle has entered its later stage.
| Indicator Category | Specific Indicator | Signal Timing | Pre-Peak Behavior |
|---|---|---|---|
| Price | DRAM/NAND/HDD ASP | Earliest | Price growth slows |
| Inventory | Supplier and customer inventory | Early | Inventory rises |
| Orders | Long-term contracts, backlog, lead times | Early | Orders shorten |
| Capex | Cleanrooms, wafer starts | Mid-cycle | Supply pressure forms |
| Gross margin | Gross margin | Mid-to-late cycle | Stagnates at a high level |
| Cash flow | FCF, operating cash flow | Mid-to-late cycle | Profit strong but cash weak |
In practice, you can track each product line separately. For DRAM, focus on conventional DRAM contract prices, HBM supply, server DRAM, and inventory days. For NAND, focus on NAND Flash contract prices, enterprise SSDs, client SSD inventory, and QLC NAND. For HDDs, focus on nearline demand, exabyte shipments, cloud vendor orders, and gross margin. For enterprise storage companies, focus on all-flash arrays, RPO, ARR, and subscription revenue.
If you need to follow Micron, Samsung, SK Hynix, Seagate, Western Digital, and other storage-related companies, U.S. stock market information can help you monitor market moves, earnings dates, and company information. You can also use Download App to follow broader market changes. Before trading, you should still check the fees shown on the order page, external agency fees, applicable rules, and your own risk tolerance. Industry logic should not be treated as a direct trading conclusion.
Summary: Ordinary investors do not need to predict DRAM, NAND, or HDD quotes every day. They need a fixed peak-signal dashboard. Leading indicators include price momentum, inventory, and orders. Intermediate indicators include capex, supply, and product mix. Lagging indicators include gross margin, FCF, and management guidance. When multiple indicators shift from strong to weak at the same time, even if prices are still rising, you should watch for the cycle entering its second half. Effective judgment does not come from betting on one indicator. It comes from watching whether multiple indicators move together. Slower price growth is only the first step. Inventory, orders, capex, and gross margin weakening together form a more complete peak signal.
If you follow storage-related companies such as Micron, Samsung, SK Hynix, Seagate, Western Digital, Pure Storage, and NetApp, as well as DRAM, NAND, HDD, and enterprise SSD price cycles, you can put market quotes, earnings dates, company announcements, fee structures, and risk control into one framework. Biya is a global multi-asset trading wallet that supports U.S. stocks, Hong Kong stocks, and crypto trading, and also supports converting USDT into major fiat currencies such as U.S. dollars or Hong Kong dollars. Service availability depends on your location, identity verification results, platform rules, and applicable laws and regulations. Public market information and industry analysis can help you understand the logic, but they do not constitute investment advice. Actual trading should be based on your own risk tolerance, order details, and platform information.
FAQ
What Is the Earliest Signal Before DRAM Prices Peak?
The earliest signal before DRAM prices peak is usually not a price decline, but slower price increases, rising customer inventory, fewer long-term agreements, and normalized lead times. You should also watch whether HBM continues to crowd out conventional DRAM supply and whether server DRAM demand can still support ASP.
How Should Investors Use Inventory to Judge a NAND Flash Price Peak?
To judge a NAND Flash price peak through inventory, focus on client SSDs, smartphone storage, enterprise SSDs, and supplier inventory. If consumer-end inventory builds up and customers reduce high-priced purchases while data center SSD growth cannot offset consumer pressure, the NAND price cycle may be entering its second half.
Does Higher Storage Company Capex Always Mean Prices Are Peaking?
Not always. Early in the cycle, higher capex often indicates strong demand and tight supply. But if new cleanrooms, wafer starts, and equipment deployment release supply over the next few quarters, pricing leverage may weaken. Investors should judge capex together with capacity release timing, customer orders, and inventory trends.
Does Record Gross Margin Mean Storage Stocks Are Near a Cycle Peak?
Record gross margin does not necessarily mean the cycle has peaked. But if margin expansion slows, ASP growth declines, inventory rises, and orders shorten at the same time, caution is warranted. High gross margin is a result of a strong cycle; margin stagnation is the more important risk signal.
Can AI Data Center Demand Extend the Storage Price Cycle?
AI data center demand can extend the storage price cycle, especially for HBM, server DRAM, enterprise SSDs, and nearline HDDs. But AI demand cannot fully offset consumer-end pressure, supplier capacity expansion, and customer inventory replenishment. Investors should distinguish between real orders and pre-buying.
How Can Ordinary Investors Track the Storage Price Cycle?
Ordinary investors can use a six-factor framework: price momentum, inventory, capex, orders, gross margin, and free cash flow. Each quarter, they can combine DRAM, NAND, and HDD company earnings with industry price data. Decisions should not be based only on a single quote or one quarter of stock price movement.
*This article is provided for general information purposes and does not constitute legal, tax or other professional advice from BiyaPay or its subsidiaries and its affiliates, and it is not intended as a substitute for obtaining advice from a financial advisor or any other professional.
We make no representations, warranties or warranties, express or implied, as to the accuracy, completeness or timeliness of the contents of this publication.
Related Blogs of

What Is HAMR? Seagate and Western Digital’s Roadmaps for High-Capacity HDDs


Why Are Cloud Providers Signing Long-Term HDD Contracts? Demand Visibility for Western Digital and Seagate


What Is the Difference Between EEPROM and NOR Flash? A Beginner’s Guide to Shanghai Fudan’s Hong Kong-Listed Business

Why Are AI Data Centers Competing for Enterprise SSDs? From Training Data to Vector Databases

Choose Country or Region to Read Local Blog
 Australia
 Austria
 Belgium
 Canada
 Cyprus
 Czech Republic
 Denmark
 Estonia
 Finland
 France
 Germany
 Greece
 Hong Kong
 India
India Indonesia
 Ireland
 Italy
Italy Japan
Japan Latvia
 Lithuania
 Luxembourg
 Malaysia
 Malta
Malta Morocco
 Nepal
Nepal Netherlands
 New Zealand
 Norway
 Pakistan
 Philippines
 Poland
 Portugal
 Romania
 Singapore
 Slovakia
 Slovenia
 South Africa
 South Korea
 Spain
Spain Sweden
 Thailand
 The United States
 Turkey
 United Arab Emirates
 United Kingdom
 Vietnam
Contact Us




BIYA GLOBAL LLC is registered with the Financial Crimes Enforcement Network (FinCEN), an agency under the U.S. Department of the Treasury, as a Money Services Business (MSB), with registration number 31000218637349, and regulated by the Financial Crimes Enforcement Network (FinCEN).
BIYA GLOBAL LIMITED is a registered Financial Service Provider (FSP) in New Zealand, with registration number FSP1007221, and is also a registered member of the Financial Services Complaints Limited (FSCL), an independent dispute resolution scheme in New Zealand.