How Do Microsoft, Amazon, Google, and Meta’s AI Capex Affect Storage Stocks?




Microsoft, Amazon, Google, and Meta’s AI capex affects storage stocks because AI infrastructure is not just about buying GPUs. It also requires memory, SSDs, HDDs, networking equipment, data centers, and enterprise storage systems to scale together. When you analyze storage stocks, the key question is not simply “which company has AI exposure?” Instead, you need to judge whether cloud spending can translate into real orders, pricing power, gross margin expansion, and free cash flow. For ordinary investors, CSP capex is the leading signal, while storage company earnings are the validation signal.
Key Takeaways
- AI capex flows through GPU clusters, data retention, cloud storage, and enterprise AI adoption.
- Microsoft, Amazon, Google, and Meta have different spending structures, so the beneficiaries also differ.
- HBM and DRAM are closer to compute, while enterprise SSDs and HDDs are closer to data growth.
- Storage stocks should be judged by ASP, gross margin, order visibility, and cash flow, not just AI narratives.
- The biggest risks are long payback cycles, slower cloud procurement, and valuations pricing in too much too early.
Why Has AI Capex Become a Core Variable for Storage Stocks?
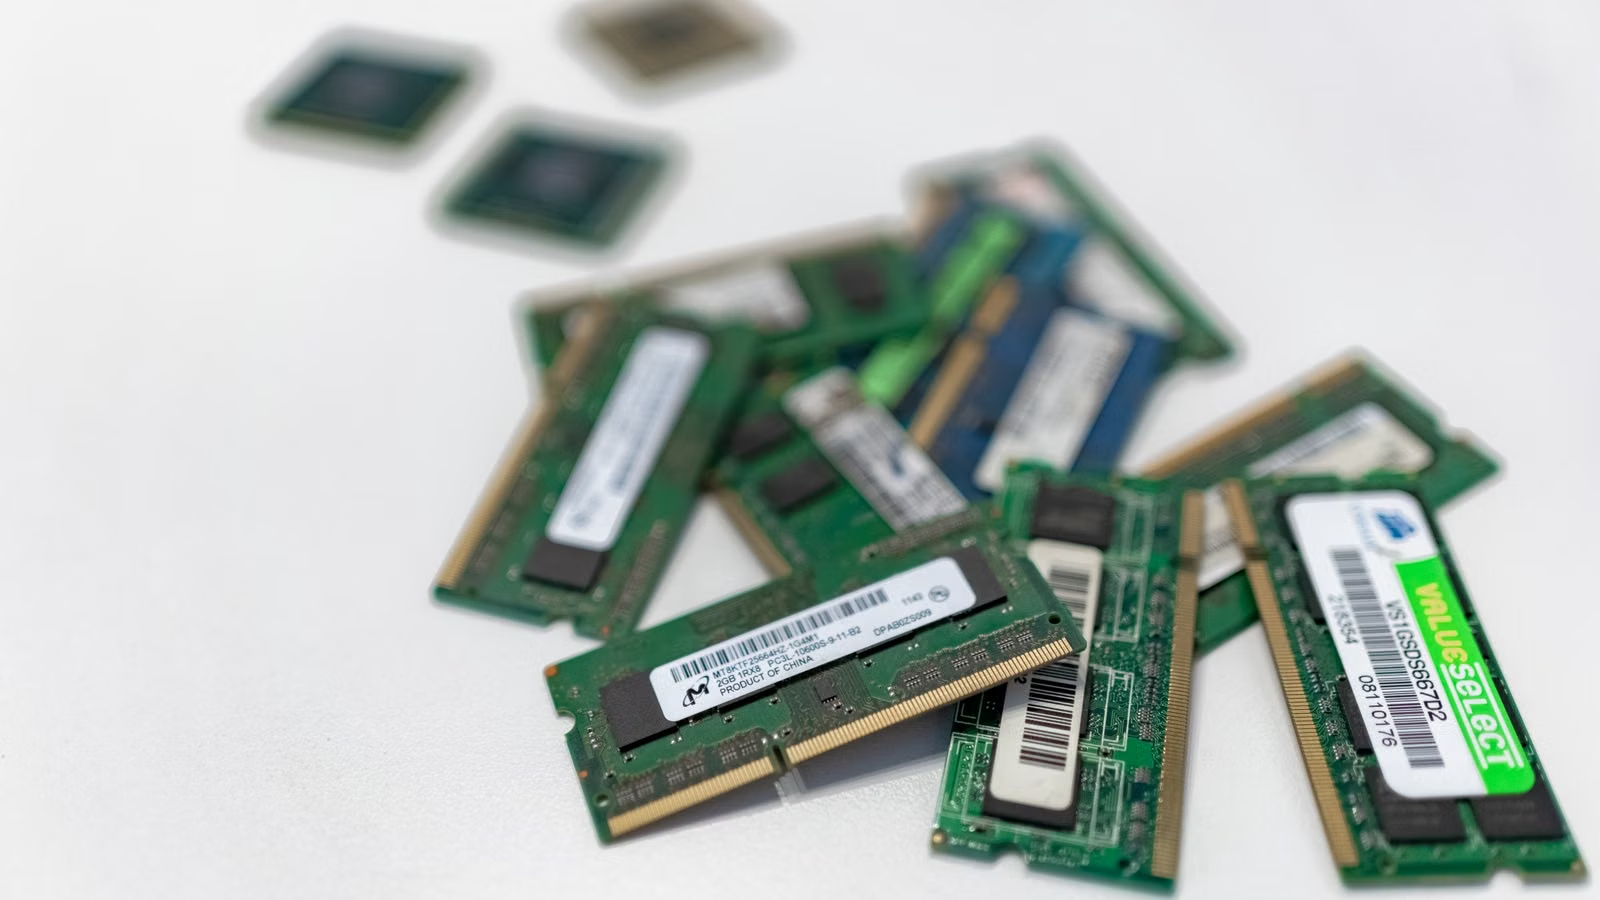
AI capex has become a core variable for storage stocks because large model training, inference, recommendation systems, and AI agents continuously create, read, cache, and archive data. You should not understand AI infrastructure as simply GPU procurement. Real data center expansion also includes HBM, DRAM, NAND, enterprise SSDs, nearline HDDs, networking equipment, power, cooling, and physical facilities. As long as cloud vendors continue to expand AI clusters, the data layer will continue to see demand.
Microsoft is a clear example. In the Microsoft FY2026 Q3 earnings call, the company said quarterly capital expenditure reached $31.9 billion, with roughly two-thirds going into short-lived assets such as GPUs and CPUs. Microsoft also expected calendar year 2026 capex to be around $190 billion and said GPU, CPU, and storage capacity would remain constrained. That is important for storage stocks: Microsoft is not only short of compute; it is also scaling storage capacity.
Alphabet’s spending structure further shows how AI capex is layered. In the Alphabet Q1 2026 earnings call, the company reported $35.7 billion in capex for the quarter, with the vast majority used for technical infrastructure supporting AI opportunities. About 60% went into servers, while about 40% went into data centers and networking equipment. This shows that AI capex is not a single-point hardware purchase; it is a system-wide expansion of data center infrastructure.
From a workload perspective, AI drives storage demand in five major ways:
| AI Use Case | Data Requirement | More Relevant Storage Type | Beneficiary Area |
|---|---|---|---|
| Large model training | High-speed training data reads, checkpoint storage | HBM, DRAM, enterprise SSDs | High-performance storage |
| AI inference | Cache, logs, context data | DRAM, SSDs, object storage | Low latency and high concurrency |
| Recommendation systems | User behavior, video, advertising data | SSDs, nearline HDDs | Hot/warm/cold data tiering |
| AI agents | Long context, operation records, task logs | SSDs, HDDs, data platforms | Persistent data retention |
| Enterprise AI | Data governance, backup, access control | All-flash arrays, STaaS, hybrid cloud storage | Enterprise storage systems |
You can think of AI capex as a chain running from compute to data. GPUs handle computation. HBM and DRAM make computation faster. SSDs accelerate data reads and writes. HDDs and object storage preserve massive datasets over long periods. Enterprise storage platforms make data secure, compliant, recoverable, and usable. The opportunity for storage stocks appears when these layers expand, gain pricing power, and shift toward higher-value product mixes.
Summary: The key to understanding how AI capex affects storage stocks is not simply how much cloud vendors spend, but whether that spending flows into infrastructure that creates, processes, and stores data. Microsoft and Alphabet’s disclosures show that AI infrastructure spending already covers GPUs, CPUs, storage capacity, servers, data centers, and networking equipment. When analyzing storage stocks, you should first treat CSP capex as a leading demand signal, then break it down into HBM, DRAM, enterprise SSDs, nearline HDDs, and enterprise storage systems. AI capex truly enters storage stock fundamentals only when cloud expansion is validated by revenue growth, gross margin improvement, and stronger order visibility at storage companies.
How Do the Four Major Cloud Vendors Differ in AI Capex?
Microsoft, Amazon, Google, and Meta are all increasing AI capex, but their spending logic is not the same. Microsoft is more focused on Azure, the OpenAI ecosystem, and Copilot. Amazon is more focused on AWS, Trainium, in-house chips, and customer workloads. Google is more focused on TPUs, Google Cloud, Search, and DeepMind. Meta is more focused on advertising recommendations, proprietary models, and internal AI infrastructure. When you judge which storage stocks may benefit, you should not simply group them all under “big tech capex.”
Microsoft’s focus is cloud and AI product monetization. In the same FY2026 Q3 materials, Microsoft said Microsoft Cloud revenue reached $54.5 billion, up 29% year over year, while AI annual revenue run rate exceeded $37 billion, up 123% year over year. This means Microsoft’s capex is backed by Azure, Copilot, enterprise AI, and OpenAI-related demand. For storage stocks, Microsoft is more likely to support demand for enterprise SSDs, server memory, cloud storage, and data center infrastructure.
Amazon’s focus is AWS expansion and long-term customer demand. Amazon’s Q4 2025 results showed AWS quarterly revenue of $35.6 billion, up 24% year over year. In the same release, Amazon noted that trailing twelve-month free cash flow declined mainly because of increased purchases of property and equipment, with that increase primarily reflecting AI investments. For storage stocks, AWS matters because its customer workloads are broad, data volumes are large, and demand for object storage and archival storage remains structurally important.
Google’s capex is more “full-stack AI” in nature. Google Cloud’s first-quarter revenue reached $20 billion, up 63% year over year, driven by enterprise AI solutions, AI infrastructure, and core GCP services. Google also owns TPUs, Gemini, Search, YouTube, Google Cloud, and DeepMind, so its storage demand comes not only from model training but also from search advertising, video content, cloud customer data, and enterprise analytics.
Meta’s logic is more distinctive. Meta’s Q1 2026 results raised full-year capital expenditure guidance to $125 billion to $145 billion, citing higher component prices and data center costs needed to support future capacity. Meta’s AI capex first serves advertising recommendations, content distribution, proprietary models, and its superintelligence efforts. A recent Reuters report on Meta’s possible externalization of compute resources also shows that the market is paying closer attention to AI compute utilization and monetization.
| Cloud Vendor | Capex Focus | Main Pull on Storage Demand | Key Risk to Watch |
|---|---|---|---|
| Microsoft | Azure, Copilot, OpenAI ecosystem | Enterprise SSDs, DRAM, cloud storage | AI margins and capacity absorption |
| Amazon | AWS, Trainium, AI services | SSDs, object storage, HDDs | Capex pressure on free cash flow |
| TPUs, Google Cloud, DeepMind | High-performance storage, data center networking | Whether cloud growth covers investment | |
| Meta | Recommendation systems, proprietary models, advertising AI | Memory, SSDs, HDDs, data lakes | Internal demand and excess capacity |
All four major cloud vendors are increasing AI infrastructure spending, but the quality of transmission to storage stocks differs. Microsoft and Amazon are more “cloud customer demand-driven.” Google is a mix of in-house chips, cloud business, and search advertising. Meta is more driven by internal AI efficiency and future monetization. The first two categories are generally more likely to form external customer demand and durable cloud workloads, while Meta requires closer tracking of advertising efficiency, product adoption, and potential external compute revenue.
Summary: The AI capex of the four major CSPs should not be judged only by headline spending. You need to examine the business model behind the spending. Microsoft and Amazon’s capex is closer to cloud customers and enterprise workloads. Google combines TPUs, cloud services, Search, and DeepMind. Meta relies more heavily on advertising recommendations and proprietary AI product monetization. For storage stocks, capex that is closer to real customer demand, long-term cloud contracts, and sustainable data growth has higher transmission quality. The four questions to connect are: who is spending, why they are spending, what assets they are spending on, and whether that spending can generate revenue.
Through Which Channels Does AI Capex Flow Into Storage Stocks?
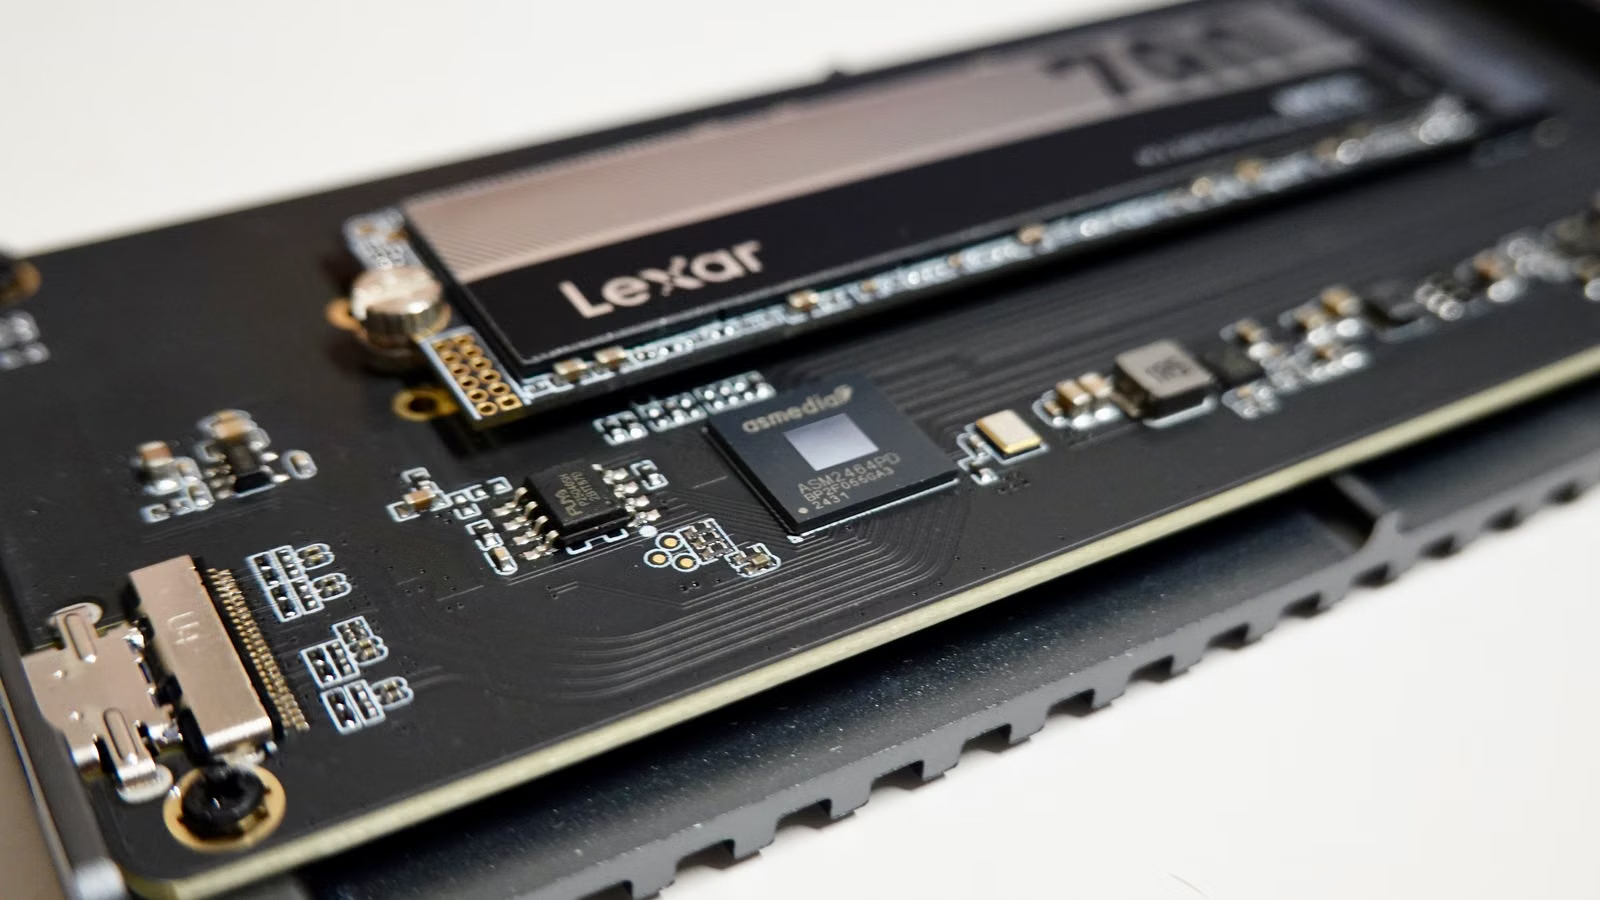
AI capex flows into storage stocks mainly through four channels: AI servers increase demand for HBM, DRAM, and enterprise SSDs; training and inference generate persistent data, driving HDD and object storage demand; cloud vendors lock in supply earlier, improving order visibility for storage companies; and tight supply raises ASP and gross margin. The real question is not whether a storage stock has an AI narrative, but which transmission channel it belongs to.
The first channel is the high-performance compute chain. GPU clusters require HBM for high bandwidth, DRAM for server memory, and enterprise SSDs for high-speed data reads. Micron’s disclosures illustrate this well. In Micron’s FY2026 Q3 materials, the company said data center revenue exceeded $25 billion, data center SSD revenue exceeded $5 billion, and industry demand for DRAM and NAND was significantly outpacing supply. For investors, this means AI is not only buying HBM; it is also spilling over into server DRAM and enterprise SSDs.
The second channel is massive data retention. AI training datasets, model checkpoints, logs, vector databases, user interaction records, and compliance archives all need to be stored over time. The larger GPU clusters become and the more inference calls are made, the more backend data accumulates. This is where nearline HDDs matter. They are not the fastest storage medium, but they remain difficult to replace in massive, low-cost, long-duration data storage.
The third channel is better order visibility. Traditional storage cycles are often highly volatile because of inventory and pricing swings. But when cloud vendors lock in future capacity, sign multi-year supply agreements, or accept longer lead times, storage company revenue becomes more predictable. When you read earnings reports, look for backlog, remaining performance obligations, strategic customer agreements, customer prepayments, and supply allocation rather than relying only on one-quarter revenue growth.
The fourth channel is pricing and profit leverage. When AI demand is strong and supply expansion is slow, storage vendors may benefit not only from higher shipments but also from stronger ASP and gross margins. IDC’s view on 2026 memory supply noted that DRAM and NAND supply growth in 2026 is expected to be 16% and 17%, respectively, below historical norms. Tight supply can improve pricing power, but it can also raise the risk that the pricing cycle is approaching a peak.
| Transmission Variable | Meaning for Storage Companies | What Investors Should Watch |
|---|---|---|
| Rising ASP | Higher price per unit of capacity | HDD, SSD, and DRAM contract prices |
| Gross margin improvement | Better product mix | GAAP and non-GAAP gross margin |
| Order visibility | Lower cycle uncertainty | Long-term contracts, backlog, customer commitments |
| Tight capacity | Stronger bargaining power | Lead times, inventory, supply-demand gaps |
| Cash flow improvement | Validation of earnings quality | Operating cash flow and free cash flow |
AI capex transmission is not linear. HBM and DRAM sit closer to compute clusters. Enterprise SSDs sit closer to high-performance data access. HDDs sit closer to massive persistent data. Enterprise storage systems sit closer to enterprise AI adoption and data governance. Different storage stocks have different sources of upside and should be valued differently. You should not use the same logic to analyze Micron, Seagate, Western Digital, Pure Storage, and NetApp.
Summary: AI capex affects storage stocks through four channels: compute configuration upgrades, data volume growth, supply lock-in, and pricing leverage. The most direct beneficiaries are HBM, DRAM, and enterprise SSDs because they sit close to AI servers. The longer-term beneficiaries are nearline HDDs, object storage, and enterprise storage platforms because AI continuously generates data that must be stored, governed, and recovered. When evaluating storage stocks, the key is not whether the company mentions AI, but whether orders, ASP, margins, capacity, and cash flow are improving together.
Which Types of Storage Stocks Are More Likely to Benefit?
Storage stocks that are more likely to benefit can be grouped into four categories: HBM and DRAM companies, NAND and enterprise SSD companies, nearline HDD companies, and enterprise storage system providers. Each category benefits at a different pace. Memory stocks are closer to GPU servers and tend to have stronger upside but higher cyclicality. HDDs are closer to massive data retention. Enterprise storage depends more on enterprise AI, hybrid cloud, and data governance budgets. You should classify first, then analyze individual stocks.
The first category is HBM and DRAM. Representative companies include Micron, SK Hynix, and Samsung. HBM is one of the key bottlenecks for AI training and high-end inference, while DRAM benefits from server configuration upgrades. The advantage of these stocks is high revenue sensitivity and strong pricing leverage. The risks are rapid technology transitions, high customer concentration, and possible price declines after supply expansion.
The second category is NAND and enterprise SSDs. Representative companies include Micron, SanDisk, Samsung, and the broader Kioxia-related supply chain. AI inference, vector search, database acceleration, and training data reads all require high-performance SSDs. Consumer NAND may still be affected by PC and smartphone cycles, but enterprise SSDs are more closely tied to AI data center demand. That is why you need to distinguish between “ordinary NAND price increases” and “data center SSD volume growth.”
The third category is nearline HDDs. Representative companies include Seagate and Western Digital. The HDD logic is not about replacing GPUs; it is about absorbing the long-term data generated by AI. Seagate’s FY2026 Q3 results showed revenue of $3.11 billion, GAAP gross margin of 46.5%, and free cash flow of $953 million. Western Digital’s FY2026 Q3 results showed revenue of $3.34 billion, up 45% year over year, GAAP gross margin of 50.2%, and free cash flow of $978 million. These results show that high-capacity cloud storage demand is already appearing in profitability.
The fourth category is enterprise storage systems and data management platforms. Representative companies include Pure Storage, NetApp, Dell Technologies, and HPE. Enterprise AI is not just about deploying models. It also requires data permissions, backup and recovery, hybrid cloud migration, all-flash arrays, and storage-as-a-service. NetApp’s FY2026 Q4 results reported all-flash array net revenue of $1.2 billion, up 18% year over year, and Public Cloud net revenue of $182 million, up 11%. For this category, ARR, RPO, subscription revenue, all-flash revenue, and cloud storage growth are more useful indicators.
| Storage Type | Representative Companies | AI Capex Transmission Strength | Better Metrics to Watch |
|---|---|---|---|
| HBM/DRAM | Micron, SK Hynix, Samsung | Very strong | HBM shipments, DRAM ASP, data center revenue |
| NAND/SSD | Micron, SanDisk, Samsung | Strong | Enterprise SSD revenue, NAND pricing |
| Nearline HDD | Seagate, Western Digital | Strong | Exabyte shipments, nearline mix, gross margin |
| Enterprise storage systems | Pure Storage, NetApp, Dell | Medium to strong | ARR, RPO, all-flash revenue, subscription revenue |
| Data management software | NetApp, cloud storage ecosystem | Medium | Cloud revenue, renewal rates, data services growth |
If you track these companies through U.S. stock market information, do not classify all of them simply as “AI storage concept stocks.” A better approach is to break them down by storage layer: Micron should be viewed through HBM, DRAM, and enterprise SSDs; Seagate and Western Digital through nearline HDDs and gross margin; NetApp and Pure Storage through enterprise storage orders, cloud storage revenue, and subscription transition. The clearer the classification, the less likely you are to mistake a short-term price cycle for long-term growth.
Summary: AI capex benefits are not distributed evenly across storage stocks. HBM and DRAM are closest to compute and usually have the strongest upside, but they are also more sensitive to pricing and supply cycles. Enterprise SSDs benefit from high-performance data access. Nearline HDDs benefit from long-term massive data growth. Enterprise storage systems depend on enterprise AI, hybrid cloud, and data governance adoption. When analyzing storage stocks, first identify which layer the company belongs to, then choose the right metrics instead of applying one valuation framework to all of them.
What Financial and Industry Signals Should Investors Watch?
To judge whether AI capex is truly benefiting storage stocks, you need to watch five signals: whether cloud vendors continue raising capex guidance, whether storage company revenue is accelerating, whether gross margin is improving, whether order visibility is strengthening, and whether free cash flow is improving at the same time. Looking only at cloud spending can overstate the opportunity. Looking only at storage stock gains can lead to chasing momentum. A more reliable approach is to put capex, orders, pricing, margins, and cash flow into one framework.
The first signal is CSP capex guidance. Microsoft, Amazon, Alphabet, and Meta’s spending pace is a leading signal for storage demand. Higher capex usually means cloud vendors see stronger demand, but you also need to judge where the money is going. If more spending goes into GPUs and data center shells, the near-term pull on storage orders may be weaker. If companies explicitly mention storage capacity, servers, data center networking, and long-term customer demand, transmission quality is stronger.
The second signal is simultaneous improvement in storage company revenue and gross margin. Revenue growth shows orders are landing. Gross margin improvement shows stronger pricing or a better product mix. If revenue grows but gross margin falls, the company may be gaining volume at lower prices. If gross margin rises but revenue does not sustain growth, the improvement may be only a short-term pricing cycle. Seagate and Western Digital’s recent margin improvement is therefore a key signal in the HDD cycle.
The third signal is order visibility. Traditional storage stocks are vulnerable to inventory cycle reversals. But if customers sign multi-year agreements, make prepayments, or accept longer lead times, some of that volatility can be reduced. Micron’s FY2026 Q3 10-Q also disclosed that, as of May 28, 2026, the transaction price allocated to remaining performance obligations was approximately $5 billion, with part of it coming from strategic customer agreements. This kind of information is more useful than broad claims that “AI demand is strong.”
The fourth signal is supply-demand pricing. DRAM, NAND, HDDs, and SSDs remain cyclical. AI demand can lift prices and extend the cycle, but capacity expansion may eventually bring prices down. You should keep tracking contract prices, lead times, inventory days, customer inventory, and capacity utilization. Price increases are usually helpful in the early stage of an upcycle, but in later stages they can push customers to delay purchases or pressure consumer electronics demand.
The fifth signal is free cash flow. AI capex also creates cash flow pressure for both cloud vendors and suppliers. J.P. Morgan Asset Management’s analysis of technology and AI noted that hyperscaler AI capex as a share of operating cash flow rose from 33% in 2023 to an estimated 93% in 2026. When spending takes up such a large share of cash flow, the market becomes much more focused on return on investment.
| Metric to Watch | Why It Matters | Healthy Signal | Risk Signal |
|---|---|---|---|
| Cloud vendor capex | Determines demand outlook | Continues rising with revenue support | Rises without revenue conversion |
| Storage revenue | Validates order conversion | Sustained acceleration | One-quarter surge followed by slowdown |
| Gross margin | Validates pricing power | ASP and product mix improve | Revenue rises but margin falls |
| Free cash flow | Validates earnings quality | Cash flow improves with profit | Profit grows but cash flow stays weak |
| Inventory and lead times | Shows cycle position | Healthy inventory, longer lead times | Customer inventory builds up |
There is also a connection investors often overlook: trading cost. When you study AI capex and storage stocks, you should consider not only company fundamentals but also your actual transaction costs. U.S. stock trading costs usually include more than commissions; they may also include platform fees, external agency fees, and trading activity fees. If related services are available in your region, Biya can be used to track U.S. and Hong Kong stocks. Its U.S. stock trading fees state that Biya charges $0 commission for U.S. stock trading, while platform fees, external agency fees, and other fees are subject to the fee center and order page. Service availability depends on your location, identity verification results, platform rules, and applicable laws and regulations.
Summary: Whether AI capex is a real positive for storage stocks must be verified through financial signals. You can review the four major CSPs’ capex guidance, storage company revenue growth, gross margin changes, order visibility, supply-demand pricing, and free cash flow in sequence. If these indicators improve together, it shows AI demand is entering the income statement and cash flow statement. If there are only capex headlines and stock price gains without support from revenue, margin, and cash flow, risk rises meaningfully. Before trading, you should also check fee structures, order rules, and your own risk tolerance.
What Risks and Misunderstandings Should Investors Watch in AI Capex and Storage Stocks?
The biggest risk for storage stocks is not that AI demand completely disappears. The bigger risk is a mismatch between demand realization, cloud vendor returns, and the storage pricing cycle. Cloud vendors may overbuild at certain stages. Storage companies may face ASP declines after supply expands. Investors may mistake a short-term price upcycle for long-term structural growth. You need to watch demand, supply, valuation, and cash flow together, not just the fact that large tech companies are still spending.
The first misunderstanding is treating all AI capex as storage orders. Cloud vendor capex includes large amounts of spending on GPUs, CPUs, land, facilities, power, cooling, networking, and leases. Storage is an important part of AI data centers, but it is not the whole picture. Investors who mechanically translate cloud capex growth into storage company revenue may overestimate the upside.
The second misunderstanding is treating storage price increases as permanent. DRAM, NAND, SSDs, and HDDs all remain cyclical. AI demand can change the strength and duration of the cycle, but it does not eliminate supply expansion, inventory corrections, or price declines. This is especially important when gross margins are already high and share prices have already rallied sharply. Any cloud vendor procurement delay, customer order pushout, or new capacity release could trigger a valuation correction.
The third misunderstanding is ignoring cloud vendor ROI pressure. Microsoft, Amazon, Alphabet, and Meta ultimately need AI capex to translate into cloud revenue, subscription revenue, advertising efficiency, or external compute revenue. If spending grows faster than revenue, the market may shift from “AI demand is strong” to “are AI returns good enough?” Meta’s recent reports about potentially selling excess AI compute capacity are a case study in how investors reassess compute utilization.
The fourth misunderstanding is buying only the storage stocks that have risen the most. Strong cyclical industries often rally quickly in upcycles, but the largest gainers do not necessarily offer the best margin of safety. You still need to check whether valuation has already priced in the next two or three years of earnings improvement, whether the customer base is too concentrated, whether cash flow is truly improving, and whether the company is expanding capacity aggressively near a cyclical high.
| Risk Type | Possible Signal | Impact on Storage Stocks | How to Respond |
|---|---|---|---|
| Capex slowdown | Cloud vendors lower budgets | Order expectations fall | Track quarterly guidance |
| Supply expansion | New capacity comes online | ASP declines | Watch inventory and lead times |
| High valuation | Share price prices in good news early | Post-earnings correction | Compare FCF and earnings |
| Customer concentration | Few CSPs dominate demand | Order volatility increases | Check customer structure |
| Technology substitution | Storage architecture changes | Product demand shifts | Follow product roadmaps |
Ordinary investors are better served by a “verification” mindset rather than a “single bet” mindset. First, check whether cloud vendors are still investing. Then see whether storage companies are receiving orders. Finally, confirm whether earnings and cash flow are materializing. A single signal, such as “Meta raised capex” or “one storage stock hit a new high,” is not enough to form a complete judgment. Public market information can help you understand the logic, but it does not constitute investment advice.
Summary: AI capex is a major tailwind for storage stocks, but it is not a risk-free investment reason. The main risks come from four mismatches: cloud capex versus revenue returns, storage demand versus supply expansion, short-term price increases versus long-term earnings, and share price expectations versus cash flow quality. You need to separate AI demand from financial realization. The investment logic is more complete only when demand growth, order visibility, gross margin, and free cash flow improve together.
How Can Ordinary Investors Build an AI Capex and Storage Stock Tracking Framework?
Ordinary investors can use a three-layer framework to track how AI capex affects storage stocks. First, check whether the four major CSPs continue to increase capital spending. Second, identify which layer is tighter: HBM, DRAM, SSDs, HDDs, or enterprise storage. Third, verify whether specific companies are improving revenue, gross margin, orders, and free cash flow. You do not need to predict every data center purchase, but you should keep validating whether “capex—demand—profit” is connected.
Step one is to track the earnings reports and guidance of the four major CSPs. For Microsoft, focus on Azure growth, AI annual revenue run rate, quarterly capex, and capacity constraints. For Amazon, focus on AWS growth, free cash flow, AI customer demand, and in-house chips. For Alphabet, focus on Google Cloud, TPUs, technical infrastructure spending mix, and AI-related cloud demand. For Meta, focus on capex guidance, advertising AI efficiency, compute utilization, and potential external compute revenue.
Step two is to classify storage stocks by layer. Micron, SK Hynix, and Samsung are better placed in the HBM/DRAM layer. Micron, SanDisk, and Samsung also belong to the NAND/SSD layer. Seagate and Western Digital are better viewed through the nearline HDD layer. Pure Storage, NetApp, Dell, and HPE are better grouped under enterprise storage. Once the layers are clear, you can use the right metrics instead of relying on the broad “AI storage” label.
Step three is to build a fixed indicator dashboard. You can track CSP capex quarterly, memory and NAND pricing monthly, and storage company revenue, gross margin, free cash flow, and order visibility every earnings season. At the trading level, you also need to include fee structure, execution price, order type, and position risk in your decision-making.
| Tracking Layer | Core Question | Key Metrics | Update Frequency |
|---|---|---|---|
| CSP capex | Are cloud vendors still accelerating? | Capex guidance, cloud revenue, AI revenue | Quarterly |
| Storage demand | Are orders real? | Revenue growth, customer commitments, backlog | Quarterly |
| Supply-demand pricing | Is pricing still elastic? | DRAM/NAND/HDD ASP, lead times | Monthly/quarterly |
| Earnings quality | Is the benefit entering earnings? | Gross margin, EPS, FCF | Quarterly |
| Risk control | Is valuation overheated? | P/E, EV/EBITDA, FCF yield | Weekly/monthly |
Step four is to avoid single-point bets. One cloud vendor raising capex does not mean all storage stocks benefit. One quarter of margin improvement does not prove the long-term cycle has changed. You can break your investment judgment into three questions: is demand real, are profits being realized, and is valuation reasonable? Only when all three are true does AI capex provide more solid fundamental support for relevant storage stocks.
If you need to follow Microsoft, Amazon, Alphabet, Meta, Micron, Seagate, Western Digital, NetApp, and other U.S. stocks at the same time, you can use Download App to monitor market moves, earnings dates, and volatility. Before trading, you should still check the fees shown on the order page, external agency fees, applicable rules, and your own risk tolerance. Do not treat industry logic as a direct buy signal.
Summary: AI capex is the starting point for researching storage stocks, not the final answer. A practical tracking framework should begin with CSP budgets, then move through HBM, DRAM, SSDs, HDDs, and enterprise storage, and finally validate the logic through revenue, gross margin, order visibility, and free cash flow. You do not need to predict every data center procurement detail. You only need to keep watching whether cloud vendors continue to expand, whether storage supply and demand remain tight, whether company financials are improving, and whether valuations already reflect excessive expectations.
If you follow Microsoft, Amazon, Google, and Meta’s AI capex, as well as storage stocks such as Seagate, Western Digital, Micron, Pure Storage, and NetApp, you need to combine industry logic, earnings data, trading costs, and risk control. Biya is a global multi-asset trading wallet that supports U.S. stocks, Hong Kong stocks, and crypto trading, and also supports converting USDT into major fiat currencies such as U.S. dollars or Hong Kong dollars. Service availability depends on your location, identity verification results, platform rules, and applicable laws and regulations. Before trading, check company announcements, earnings dates, fee structures, and order details. Public information and market analysis can help you understand the logic, but they do not constitute investment advice. Actual trading decisions should be based on your own risk tolerance and the information displayed by the platform.
FAQ
Does Higher Microsoft AI Capex Always Benefit Storage Stocks?
Not always. Higher Microsoft AI capex usually indicates stronger Azure and AI infrastructure demand, but part of that spending goes into GPUs, CPUs, data centers, power, and networking rather than storage. You still need to watch storage capacity, enterprise SSDs, DRAM, HDD orders, and whether related companies show improving margins and cash flow.
Does Amazon AWS Capex Have a Bigger Impact on HDD Stocks?
It may have a larger impact, but only if AWS expansion creates sustained demand for massive data storage. HDD stocks benefit more from object storage, archived data, nearline HDDs, and low-cost high-capacity storage. If AWS capex slows, cloud procurement is delayed, or the HDD pricing cycle reverses, related stocks may still come under pressure.
Which Storage Segments Benefit Most From Google’s AI Investment?
Google’s AI investment may benefit HBM, DRAM, enterprise SSDs, data center networking, and large-scale storage. This is because Google has TPUs and DeepMind, as well as Google Cloud, Search, YouTube, and the Gemini ecosystem. Its storage demand includes both model training and inference, as well as long-term data management.
Why Is Meta’s Rising AI Capex Controversial?
Meta’s rising AI capex is controversial because the market sees potential in advertising recommendations and proprietary models, but also worries about rapid spending, long payback periods, and insufficient compute utilization. If Meta externalizes AI compute capacity in the future, investors need to judge whether that improves asset utilization or signals weaker internal demand than expected.
How Would Slower AI Capex Affect Storage Stocks?
Slower AI capex would usually reduce order expectations for storage stocks, especially HBM, enterprise SSDs, nearline HDDs, and enterprise storage systems. If the slowdown happens during a period of high inventory, high margins, or elevated valuations, stock volatility may increase. If it is only a project timing adjustment, the impact may be more short term.
How Can Ordinary Investors Tell Whether Storage Stocks Are Overheated?
Ordinary investors can watch four signals: whether share prices have risen far faster than earnings, whether gross margins are already near cyclical highs, whether customer orders are overly concentrated, and whether free cash flow is lagging profit growth. Any trading decision should consider personal risk tolerance, order details, fee structure, and local regulatory requirements.
*This article is provided for general information purposes and does not constitute legal, tax or other professional advice from BiyaPay or its subsidiaries and its affiliates, and it is not intended as a substitute for obtaining advice from a financial advisor or any other professional.
We make no representations, warranties or warranties, express or implied, as to the accuracy, completeness or timeliness of the contents of this publication.
Related Blogs of

Does AI Inference Need More Storage Than Training? Breaking Down Server Memory and Data Retention Demand


What Is the Difference Between EEPROM and NOR Flash? A Beginner’s Guide to Shanghai Fudan’s Hong Kong-Listed Business


Why Are AI Data Centers Competing for Enterprise SSDs? From Training Data to Vector Databases


ASML Earnings Preview: Can EUV Order Signals Continue to Validate the AI Chip Cycle?

Choose Country or Region to Read Local Blog
 Australia
 Austria
 Belgium
 Canada
 Cyprus
 Czech Republic
 Denmark
 Estonia
 Finland
 France
 Germany
 Greece
 Hong Kong
 India
India Indonesia
 Ireland
 Italy
Italy Japan
Japan Latvia
 Lithuania
 Luxembourg
 Malaysia
 Malta
Malta Morocco
 Nepal
Nepal Netherlands
 New Zealand
 Norway
 Pakistan
 Philippines
 Poland
 Portugal
 Romania
 Singapore
 Slovakia
 Slovenia
 South Africa
 South Korea
 Spain
Spain Sweden
 Thailand
 The United States
 Turkey
 United Arab Emirates
 United Kingdom
 Vietnam
Contact Us




BIYA GLOBAL LLC is registered with the Financial Crimes Enforcement Network (FinCEN), an agency under the U.S. Department of the Treasury, as a Money Services Business (MSB), with registration number 31000218637349, and regulated by the Financial Crimes Enforcement Network (FinCEN).
BIYA GLOBAL LIMITED is a registered Financial Service Provider (FSP) in New Zealand, with registration number FSP1007221, and is also a registered member of the Financial Services Complaints Limited (FSCL), an independent dispute resolution scheme in New Zealand.