- More
- Download
What Is a Memory ETF? How to Invest in the HBM, DRAM, and NAND Cycle Through ETFs





A memory ETF is a thematic fund that invests mainly in memory chips, data-center storage, and related supply-chain companies. If you are bullish on AI servers, HBM, DRAM recovery, or a rebound in NAND Flash demand, but do not want to bet on a single company, an ETF can offer more diversified exposure. However, a memory ETF is not the same as a broad semiconductor ETF. Before choosing one, you need to compare holding purity, expense ratio, bid-ask spread, product history, liquidity, and where the memory cycle currently stands.
Key Takeaways
- Memory ETFs offer targeted exposure to HBM, DRAM, NAND, and enterprise storage cycles.
- HBM is a high-performance form of DRAM, mainly driven by AI GPUs and accelerators.
- NAND is more tied to data-capacity demand, enterprise SSDs, and data-center storage.
- Memory ETFs are usually more volatile than broad semiconductor ETFs.
- Expense ratios, spreads, and holding concentration can meaningfully affect returns.
What Is a Memory ETF, and How Is It Different From a Semiconductor ETF?
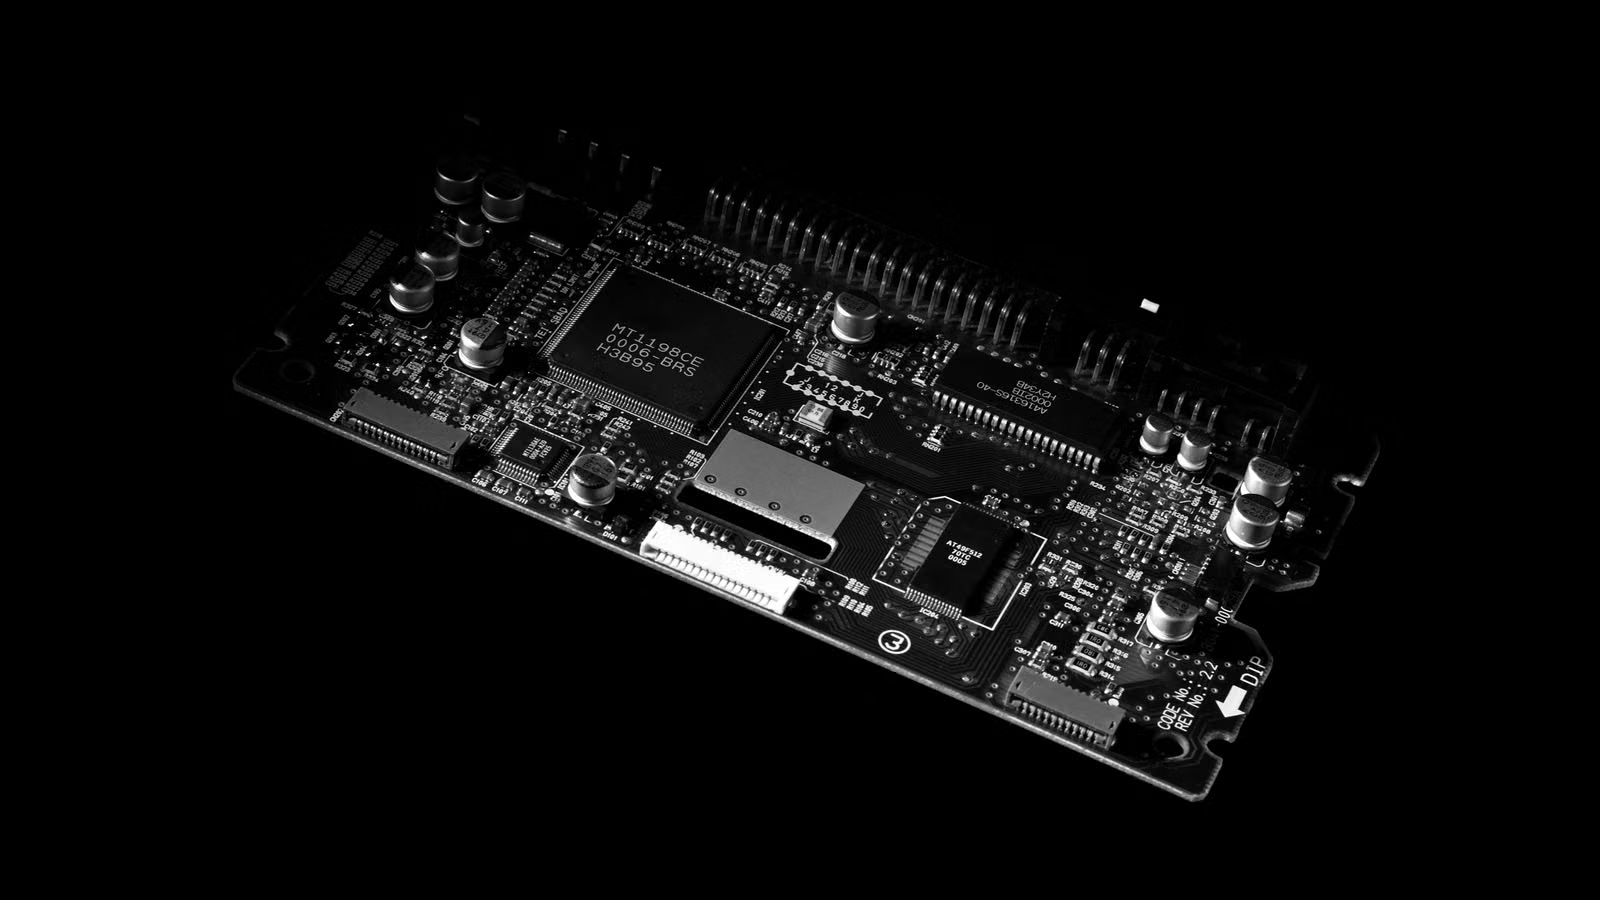
A memory ETF is a thematic fund built around memory, flash storage, enterprise storage, and related supply-chain companies. Its core exposure is not “all chips,” but rather how data is read, processed, and stored at high speed. A broad semiconductor ETF usually holds GPU, CPU, foundry, equipment, EDA, analog-chip, and memory companies. A memory ETF is more directly affected by HBM supply and demand, DRAM contract pricing, NAND inventory, and data-center storage capex.
You can think of the memory industry in three layers. The first layer is HBM and DRAM, which determine how fast computing systems can access working data. The second layer is NAND Flash and enterprise SSDs, which determine how much data can be stored and retained. The third layer includes storage equipment, packaging, testing, materials, and controllers, which influence the supply capacity of the whole industry. The High Bandwidth Memory standard adopted by JEDEC shows that HBM is essentially a stacked DRAM architecture designed for high-bandwidth workloads, rather than a memory category completely separate from DRAM.
| Investment Tool | Main Exposure | Diversification | Cycle Sensitivity | Best Use Case |
|---|---|---|---|---|
| Memory ETF | HBM, DRAM, NAND, SSDs | Medium | High | Exposure to AI memory and memory-price cycles |
| Semiconductor ETF | GPUs, foundries, equipment, memory | Higher | Medium | Exposure to the broader chip industry |
| Single memory stock | One company’s products and execution | Low | Very high | Strong conviction in a specific company |
| Broad technology ETF | Large technology companies | High | Lower | Long-term diversified allocation |
To decide whether a fund is truly a memory ETF, do not rely only on the fund name. Check six points: the weight of memory-related companies, top-three holding concentration, HBM leader exposure, NAND company exposure, whether the fund holds many semiconductor equipment names, and whether it uses ADRs, swaps, or other tools to access Asian memory leaders. For example, SK hynix and Samsung are not always central holdings in ordinary U.S.-listed semiconductor ETFs. One value of memory ETFs is that they may package regional memory leaders into a more accessible listed product.
Summary: The main value of a memory ETF is that it packages HBM, DRAM, NAND, enterprise SSDs, and related supply-chain exposure into one thematic portfolio. But it is not a low-volatility broad-market product, and it should not automatically replace semiconductor ETFs such as SOXX or SMH. The real questions are: What does the fund actually hold? How pure is the memory exposure? Is the fund overly concentrated in a few leaders? Is your investment thesis based on AI memory growth, DRAM price recovery, or NAND recovery? Once these questions are clear, a memory ETF can become a defined thematic tool rather than just a way to chase a popular market narrative.
How HBM, DRAM, and NAND Cycles Affect Memory ETFs
The performance of a memory ETF is usually driven by two forces: structural demand from AI infrastructure and the traditional price cycle of the memory industry. HBM, server DRAM, and enterprise SSDs may benefit from AI training, inference, and data-caching demand. But stock prices do not only follow demand growth. They also discount contract prices, inventory levels, capex plans, and profit-margin expectations. If price increases are already fully reflected in valuations, the ETF can still be highly volatile.
HBM is the most closely watched memory segment because AI GPUs, AI ASICs, and high-performance computing systems require higher bandwidth. HBM consumes advanced DRAM wafers, stacked packaging, and testing capacity. When supply is tight, HBM pricing can be strong, and the effective supply of traditional DRAM may also be squeezed. DRAM is more visibly cyclical: customer restocking, producer output cuts, rising contract prices, and margin recovery often combine to lift earnings expectations. NAND follows a different logic. It is more dependent on enterprise SSDs, consumer electronics, cloud storage, and large-scale data-retention demand.
According to TrendForce’s 3Q26 memory contract price forecast, conventional DRAM contract prices are expected to keep rising at a double-digit quarter-on-quarter pace, and NAND Flash contract prices are also expected to continue increasing, although consumer affordability and a higher base may slow the pace of gains. This matters for ETF investors: rising prices do not automatically mean rising share prices. The market cares more about whether the next phase can still deliver faster price increases, tighter supply, and upward earnings revisions.
| Cycle Stage | Price and Inventory Signals | Earnings Impact | ETF Focus |
|---|---|---|---|
| Cycle bottom | Falling prices, high inventory | Margin pressure | Output cuts, inventory turning point |
| Early recovery | Prices stabilize, inventory falls | Earnings expectations improve | Contract prices, orders, utilization |
| Expansion | Prices and shipments rise together | Margins recover quickly | Whether valuation is overheating |
| Late cycle | Prices still rise but growth slows | Earnings remain high | Capex and customer affordability |
| Reversal | Inventory builds again | Earnings forecasts fall | Position control and exit signals |
A simple transmission chain can help you understand memory ETFs: AI server demand rises, customers buy more HBM, DRAM, and SSDs; inventories fall, then contract and spot prices increase; average selling prices rise, improving memory-company margins; the market reprices companies based on the scale of earnings upgrades; ETF net asset value then reflects that repricing. Micron’s 2026 investor materials also noted strong data-center NAND revenue growth and stated that NAND demand exceeded available supply, showing that AI data centers are influencing not only HBM, but also SSD and flash supply-demand dynamics.
Summary: HBM, DRAM, and NAND do not affect memory ETFs in the same way. HBM is closer to an AI compute bottleneck asset, driven by GPU and accelerator shipments. DRAM is more tied to memory-price cycles, with inventory and contract prices as key indicators. NAND is more connected to data capacity, SSDs, and cloud-storage demand. When evaluating a memory ETF, do not only ask whether AI demand is strong. Also ask whether prices have already risen too far, whether producers are expanding capacity, whether customers can still absorb higher prices, and whether the market has already priced in the best-case scenario. The strongest opportunities often appear early in an earnings-upgrade cycle, while risk tends to increase when prices are still rising but expectations are already stretched.
What Memory ETFs Are Available in International Markets?
Pure-play memory ETFs are still a relatively new category in international markets. Most current products are built around HBM, DRAM, NAND, and the memory supply chain. You should not make decisions based only on words such as “memory” or “DRAM” in the fund name. Instead, compare strategy, expense ratio, number of holdings, whether the fund is actively managed, whether it is concentrated in a few companies, and whether it includes equipment, materials, packaging, and testing companies.
As of July 2026, several U.S.-listed memory-themed ETFs are worth watching:
| ETF | Main Positioning | Expense Ratio | Strategy Focus |
|---|---|---|---|
| Roundhill Memory ETF(DRAM) | Global memory-company ETF | 0.65% | Concentrated exposure to HBM, DRAM, and NAND leaders |
| Kurv Memory Select ETF(KMEM) | Selected major memory manufacturers | 0.65% | Focus on core memory-chip producers |
| Tema Memory ETF(DISK) | Actively managed memory ETF | 0.75% | AI storage and overlooked semiconductor memory bottlenecks |
| Tuttle Capital Concentrated Memory Stack ETF(HBMX) | Memory-stack supply chain | 0.95% | DRAM, NAND, HBM, packaging, materials, and testing |
The Roundhill Memory ETF(DRAM) began trading in April 2026. Its fund materials show a 0.65% total expense ratio and an actively managed structure. Kurv Memory Select ETF(KMEM) materials show that the product launched on June 30, 2026, with a 0.65% expense ratio and a focus on companies that dominate memory-chip production. Tema Memory ETF(DISK) lists a 0.75% expense ratio and focuses on memory bottlenecks in AI infrastructure that may be underrepresented in broad semiconductor funds. HBMX is more of a supply-chain product. Its materials mention active management, roughly 20–35 holdings, and exposure to HBM, DRAM, NAND, advanced packaging, materials, testing, and metrology.
Broad semiconductor ETFs can also be used as alternatives, but they are not pure memory vehicles. The iShares Semiconductor ETF(SOXX) covers the semiconductor value chain and has a 0.34% expense ratio, with more diversified holdings. The VanEck Semiconductor ETF(SMH) has a 0.35% expense ratio and tends to emphasize large semiconductor companies and equipment-chain exposure. These products may suit you better if your thesis is the broader AI chip cycle rather than a direct bet on memory pricing.
If you are monitoring memory ETFs and related equities in the U.S. market, you can use U.S. stock market information to compare ETFs, Micron, SanDisk, Seagate, Western Digital, and other related names before checking fund holdings in detail. This helps you avoid assuming you are diversified simply because you own multiple ETFs, when in reality they may overlap heavily in the same memory leaders.
Summary: Memory ETFs in international markets can be broadly divided into three groups. The first is HBM and DRAM leader-focused products, suitable for investors who are bullish on AI memory and memory-price cycles. The second is NAND and data-capacity recovery exposure, more tied to enterprise SSDs and flash pricing. The third is supply-chain exposure, which includes not only memory manufacturers but also packaging, materials, equipment, and testing. Broad semiconductor ETFs reduce volatility, but memory exposure is diluted by GPUs, foundries, and equipment companies. Before choosing, open the holdings table rather than relying on fund names, recent performance, or social-media popularity.
How to Choose a Memory ETF and Build a Position
The first step in choosing a memory ETF is not finding the fund that has risen the most recently. It is identifying the thesis you actually want to own: HBM shortage, DRAM contract-price recovery, NAND Flash rebound, or the broader AI semiconductor cycle. If your view is only “AI needs more memory,” it may be safer to start with a broad semiconductor ETF or a small thematic allocation. A larger memory ETF position makes more sense only if you can monitor pricing, inventory, and fund-holding structure.
You can screen memory ETFs with the following steps:
- Define the investment theme: HBM, DRAM, NAND, or the full memory supply chain.
- Review top-ten holdings and check whether the fund is too concentrated.
- Compare expense ratios, management style, and rebalancing rules.
- Check trading volume, bid-ask spread, and premium or discount to NAV.
- Evaluate whether the fund’s age and assets under management are stable enough.
- Calculate holding overlap if you plan to own multiple ETFs.
- Set a position limit based on your own risk tolerance.
| Investor Type | Possible Allocation Approach | Main Risk |
|---|---|---|
| Conservative | Broad ETF core, small memory ETF satellite | Limited thematic upside |
| Balanced | Semiconductor ETF plus memory ETF | Still exposed to the technology cycle |
| Aggressive | Memory ETF plus selected stocks | Higher drawdown and concentration risk |
| Short-term trader | Liquid ETFs or options tools | Requires strict risk control |
Memory ETFs also require trading-cost analysis. The expense ratio is only one part of the long-term cost. Actual cost may also include brokerage commission, platform fees, external regulatory or activity fees, bid-ask spread, currency conversion, tax treatment, and execution price. The U.S. SEC’s materials on ETF trading costs note that ETFs trade on exchanges with bid and ask prices, and the spread can affect an investor’s real execution cost.
Before trading ETFs, you should understand your platform’s cost structure. According to Biya U.S. stock trading fees, U.S. stock trading commission is $0, while platform fees, external institutional fees, and other charges are subject to the fee center and order-page display. For thematic products such as memory ETFs, which may involve staged buying, rebalancing, or position adjustment, expense ratio, bid-ask spread, and platform fees should be calculated together. Do not judge cost only by whether the commission is zero.
Summary: When building a memory ETF position, treat it as a thematic asset rather than a default core holding. The screening process should start with “which cycle do I want to own?” and then move to holdings, fees, liquidity, and risk controls. Funds with high HBM exposure may offer stronger upside elasticity but also higher concentration. Funds with more NAND exposure may depend more on flash and SSD recovery. Supply-chain funds may reduce single-company risk, but they may also dilute memory purity. For most investors, a more balanced approach is to use broad or semiconductor ETFs as the core, memory ETFs as satellite exposure, and staged buying plus periodic rebalancing to reduce timing pressure.
What Risks Should You Watch Before Investing in Memory ETFs?
Memory ETFs can reduce single-company business risk, but they cannot eliminate the cyclical risk of the memory industry. Buying a basket of companies is not the same as securing a certain return. If HBM supply-demand conditions, DRAM contract prices, NAND inventory, capex expectations, or market valuations reverse, the ETF can still face large drawdowns. Newly launched thematic ETFs can be especially volatile because of short track records, concentrated holdings, small asset bases, and fast-moving market sentiment.
Key risks include:
- Cycle reversal risk: Inventory rises again, contract-price gains slow, and earnings expectations fall.
- Valuation risk: The market prices in AI demand and rising memory prices too early.
- Concentration risk: A few HBM leaders may drive most of the ETF’s movement.
- New-fund risk: Short history makes it difficult to evaluate full-cycle performance.
- Cross-market risk: Korea, Japan, Taiwan, and other markets have different trading hours and currency exposure.
- Product-structure risk: Active management, swaps, ADRs, or derivatives can add complexity.
Leveraged memory ETFs require even greater caution. For example, Roundhill RAM seeks 2x the daily performance of DRAM, and its materials show higher fees than ordinary memory ETFs. Its objective is a daily leveraged result, not a long-term substitute for a normal ETF. FINRA’s guidance on daily reset leveraged ETFs warns that such products are generally not designed as medium- or long-term investment tools. The SEC’s investor materials on leveraged and inverse ETFs also note that performance over longer holding periods may differ significantly from the multiple of the underlying index.
| Risk Signal | Possible Meaning | Potential Response |
|---|---|---|
| Inventory days rise repeatedly | Demand or shipments may be slowing | Avoid chasing at high levels |
| Contract-price gains slow | Cycle may be entering a late stage | Watch earnings revisions |
| Producers raise capex sharply | Future supply may increase | Reassess cycle-reversal risk |
| ETF premium widens | Trading sentiment may be overheated | Avoid market-order chasing |
| Holdings become too concentrated | One company drives too much volatility | Set portfolio-level limits |
| Leveraged ETF volume surges | Short-term speculation is heating up | Separate trading from allocation |
Summary: The biggest risk in memory ETFs is not that memory demand disappears. It is that a strong thesis becomes over-discounted through high valuations, crowded positioning, and excessive expectations. AI servers are clearly raising demand for HBM, DRAM, and enterprise SSDs, but the memory industry is still shaped by supply expansion, inventory cycles, and price swings. You should keep monitoring inventory, pricing, capex, customer orders, ETF premium or discount, and bid-ask spreads. Ordinary memory ETFs may suit investors with a clear thematic view. Leveraged memory ETFs are closer to short-term trading tools and should not be held long term without understanding daily resets and volatility decay.
Once you understand the differences between HBM, DRAM, and NAND cycles, the next step is to connect your view with tradable products, available markets, and real trading costs. Through Biya, you can follow U.S. and Hong Kong ETFs, semiconductor companies, memory-chip companies, and data-center-related names, while checking order-page cost details before trading. If your investment process involves multiple currencies, real-time exchange rates can help you estimate currency-conversion impact. Public market data, fee information, and fund documents are research inputs only and do not constitute investment advice. Service availability depends on your location, identity-verification result, platform rules, and applicable laws and regulations. For volatile thematic ETFs, understand the product documents, order types, fee structure, and risk boundaries before trading.
FAQ
How should investors evaluate newly launched memory ETFs?
Investors should not evaluate newly launched memory ETFs only by short-term performance. Check the prospectus, expense ratio, assets under management, trading volume, bid-ask spread, top-ten holdings, and whether the ETF is actively managed. A short trading history means full-cycle drawdown behavior and liquidity are still untested.
Are memory ETFs suitable for ordinary investors?
Memory ETFs can be used as thematic satellite holdings, but they may not be suitable as large core positions for investors who do not understand semiconductor cycles. A more balanced approach is to use broad-market or semiconductor ETFs as the core and add a smaller memory ETF position based on HBM, DRAM, or NAND cycle views.
Can HBM-focused ETFs and NAND-focused ETFs be held together?
HBM-focused and NAND-focused ETFs can be held together, but they are not fully independent exposures. Both are affected by semiconductor cycles, AI capex, and market valuation. Before combining them, compare underlying holdings to avoid excessive overlap in the same memory companies.
How do memory ETF expense ratios affect returns?
A memory ETF’s expense ratio is deducted continuously from fund assets, while bid-ask spreads create immediate trading costs. For newly listed or lower-volume ETFs, spreads and premium or discount to NAV may matter more than the headline management fee. Actual costs should be checked against the platform order and account statement.
Are leveraged memory ETFs suitable for long-term holding?
Leveraged memory ETFs are generally not suitable as long-term replacements for ordinary ETFs. Daily resets and compounding effects can cause long-term returns to differ significantly from two times or inverse multiples of the underlying exposure, especially in volatile markets. Read product documents carefully and control position size and holding period.
Does holding multiple memory ETFs provide enough diversification?
Holding multiple memory ETFs does not necessarily provide sufficient diversification. Several funds may hold the same companies, such as SK hynix, Samsung, Micron, SanDisk, or Western Digital. You need to calculate underlying holding overlap rather than judging diversification by the number of ETFs owned.
*This article is provided for general information purposes and does not constitute legal, tax or other professional advice from BiyaPay or its subsidiaries and its affiliates, and it is not intended as a substitute for obtaining advice from a financial advisor or any other professional.
We make no representations, warranties or warranties, express or implied, as to the accuracy, completeness or timeliness of the contents of this publication.
Related Blogs of

Which AI Hardware Stocks Benefit More Under IBM’s Warning? Comparing the Sensitivity of NVDA, DELL, MU, and HPE


Which Software Stocks Could IBM’s Selloff Drag Down? Comparing ServiceNow, Salesforce, Adobe, and Oracle


AMAT, LRCX, or KLAC: Which Company Benefits Most from the Semiconductor Equipment Cycle? How ASML’s Guidance Transmits Across the Supply Chain


Will PayPal Accept Stripe’s Offer? Three Major Obstacles: Board Approval, Financing, and Regulation
Choose Country or Region to Read Local Blog
 Australia
 Austria
 Belgium
 Canada
 Cyprus
 Czech Republic
 Denmark
 Estonia
 Finland
 France
 Germany
 Greece
 Hong Kong
 India
India Indonesia
 Ireland
 Italy
Italy Japan
Japan Latvia
 Lithuania
 Luxembourg
 Malaysia
 Malta
Malta Morocco
 Nepal
Nepal Netherlands
 New Zealand
 Norway
 Pakistan
 Philippines
 Poland
 Portugal
 Romania
 Singapore
 Slovakia
 Slovenia
 South Africa
 South Korea
 Spain
Spain Sweden
 Thailand
 United States
 Turkey
 United Arab Emirates
 United Kingdom
 Vietnam
Contact Us



