How to Read Seagate STX Earnings: Nearline HDD, Free Cash Flow, and Shareholder Returns




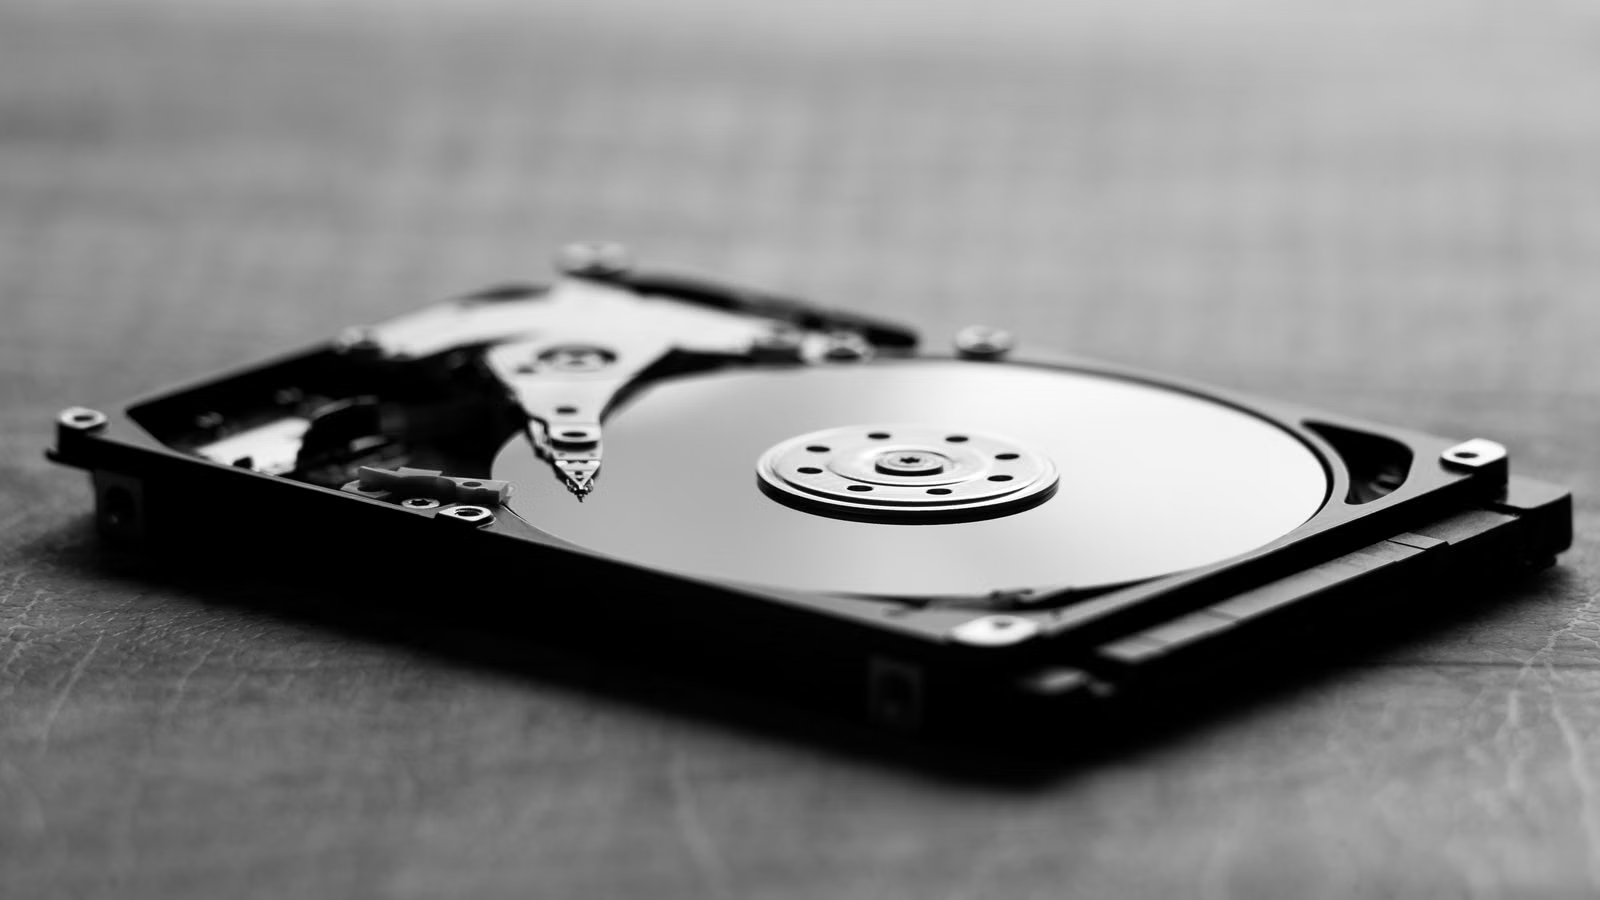
When reading Seagate STX earnings, you should not focus only on whether EPS beats expectations. The more important question is whether nearline HDD demand continues to be driven by AI data centers and cloud customers. You also need to judge whether revenue growth is translating into stronger gross margin, free cash flow, and shareholder returns. This framework is useful if you follow STX stock, the HDD cycle, AI storage, Seagate versus WDC comparisons, or cash-flow and dividend-oriented investment logic.
Key Takeaways
- STX earnings should start with Data Center and nearline HDD.
- Gross margin improvement comes from pricing, product mix, and high-capacity demand.
- Free cash flow is the core indicator for judging earnings quality.
- Shareholder returns should be assessed together with deleveraging and cash flow.
- The HAMR / Mozaic roadmap determines long-term capacity competitiveness.
What to Look at First in STX Earnings: Don’t Just Watch EPS, Focus on the Nearline HDD Story
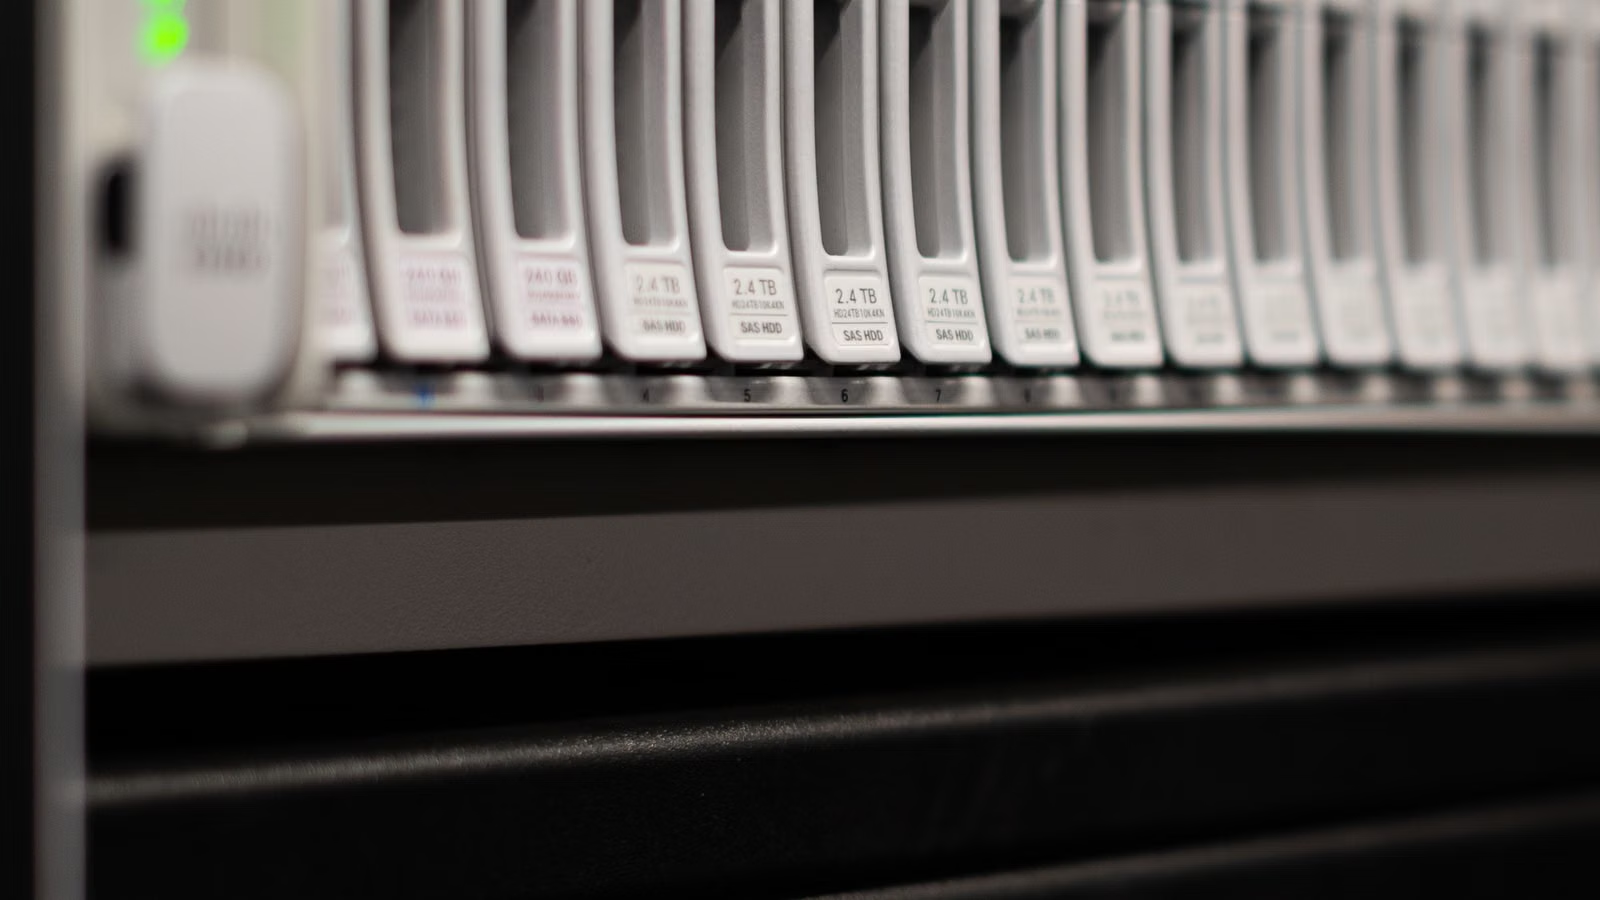
When reading STX earnings, your first priority should be nearline HDD and Data Center revenue, not single-quarter EPS. An EPS beat only shows that the income statement performed well. Nearline HDD shipments, Data Center revenue mix, gross margin, and free cash flow determine whether Seagate is truly in an HDD upcycle driven by AI data centers. If these indicators improve together, earnings quality is usually stronger.
In its FY2026 third-quarter earnings, Seagate reported revenue of $3.112 billion, GAAP gross margin of 46.5%, non-GAAP gross margin of 47.0%, GAAP EPS of $3.27, non-GAAP EPS of $4.10, operating cash flow of $1.1 billion, and free cash flow of $953 million. The key message is not simply that profits were strong. Revenue, margin, and cash flow all strengthened at the same time.
The business mix matters even more. In its Form 10-Q, Seagate explained that beginning in FY2026, it changed its primary end-market categories to Data Center and Edge IoT to reflect demand changes driven by AI applications. Data Center includes high-capacity nearline products sold to cloud and enterprise customers, and it is now the company’s main business area. Edge IoT includes consumer, client, NAS, mission-critical, and SSD markets.
| Metric | What to Watch | Why It Matters | Common Misread |
|---|---|---|---|
| Data Center revenue mix | 80% in Q3 FY2026 | Shows whether growth comes from cloud and enterprise data centers | Looking only at total revenue growth |
| Nearline exabytes | 175.4EB in Q3 FY2026 | Reflects real high-capacity HDD shipments | Looking only at total drive units |
| Non-GAAP gross margin | 47.0% in Q3 FY2026 | Shows pricing and product mix quality | Looking only at EPS beats |
| Free cash flow | $953 million in Q3 FY2026 | Tests whether profit converts into cash | Ignoring working capital swings |
| Q4 guidance | Revenue of $3.45 billion, plus or minus $100 million | Verifies demand continuity for the next quarter | Treating one strong quarter as a permanent conclusion |
You can simplify the reading process into five steps. First, check whether Data Center remains the main revenue driver. Second, look at whether nearline exabytes are growing. Third, judge whether gross margin is supported by pricing and product mix. Fourth, confirm whether free cash flow is keeping pace. Finally, use the next-quarter guidance to test whether management still sees demand continuing.
Summary: For ordinary investors, Seagate earnings should be read through nearline HDD, Data Center revenue, gross margin, and free cash flow before EPS. EPS is the result; nearline HDD and Data Center demand are the cause. If revenue growth comes from high-capacity data center drives, gross margin continues to improve, and free cash flow meets or exceeds expectations, earnings quality is stronger. If EPS is strong but shipments, margins, or cash flow do not improve together, you should be cautious about one-off factors, pricing swings, or cost timing amplifying quarterly profit.
Why Nearline HDD Drives STX Revenue: AI, Cloud Customers, and Capacity Demand

Nearline HDD is the core of STX revenue because AI and cloud computing need more than GPUs, HBM, and high-speed networking. They also need a low-cost, high-capacity storage layer that can retain data over long periods. Training data, logs, backups, object storage, video data, model versions, and cold data archives all increase capacity demand. Seagate’s strength lies in mass-capacity storage, not short-term high-performance caching.
Seagate’s nearline HDD shipments reached 175.4EB in Q3 FY2026, up from 165.0EB in the previous quarter and significantly higher than 119.6EB in the same period last year. Total HDD shipments were 199.4EB. This shows that revenue growth is not driven by pricing alone; capacity shipments are also expanding. When reading STX, “exabytes shipped” is more meaningful than “drive units,” because high-capacity HDDs can store more data using fewer physical drives.
AI data centers create HDD demand across the full data lifecycle, not just the compute stage. GPUs handle compute, HBM handles high-speed memory, SSDs handle higher-performance data access, and HDDs handle the large-scale capacity layer. In its release for 30TB Exos M and IronWolf Pro, Seagate said these products are designed for AI deployments, enterprise infrastructure expansion, data sovereignty, and hybrid data center investment. In other words, the more AI generates and retains data, the more strategically important capacity HDDs become.
| Revenue Driver | Related Demand | Key Metric | Positive Signal | Risk Signal |
|---|---|---|---|---|
| AI data growth | Training, inference, logs, archives | Nearline exabytes | Shipments keep growing | AI capex slows |
| Cloud provider expansion | Hyperscaler data centers | Data Center revenue mix | High mix remains stable | Customer procurement delays |
| High-capacity HDD upgrade | 30TB, 32TB, 36TB+ | Average capacity and ASP | Unit capacity pricing stays stable | Price competition intensifies |
| Data sovereignty | Private cloud, sovereign cloud, local AI | Enterprise and edge deployments | Demand becomes more diversified | Projects take longer to land |
| Long-term capacity planning | Large customer procurement cycles | Guidance and order visibility | Management raises expectations | Inventory adjustments |
However, a high Data Center revenue mix also increases sensitivity. Cloud procurement cycles, AI server buildout schedules, power and networking availability in data centers, and customer inventory levels can all affect nearline HDD orders. Seagate’s 10-Q risk disclosure also notes that nearline storage solutions are affected by CSP purchasing and deployment timing, especially IT spending cycles in the data center market.
Summary: Nearline HDD is the revenue core of STX earnings because it directly connects AI data growth, cloud expansion, and enterprise capacity storage. You should watch whether exabytes continue to grow, whether Data Center revenue mix remains high, and whether pricing and product mix support revenue quality. If nearline exabytes, Data Center revenue, and gross margin all improve together, STX is not simply benefiting from a consumer HDD rebound. It is benefiting from the expansion of the AI data center capacity layer. If shipments slow or cloud customers delay procurement, revenue leverage can shrink quickly.
How to Read Gross Margin: Pricing Actions, Product Mix, and the HAMR Roadmap

STX gross margin improvement mainly comes from pricing actions, high-capacity product mix, and stronger nearline HDD demand. In Q3 FY2026, GAAP gross margin was 46.5%, and non-GAAP gross margin was 47.0%, both significantly higher than the prior-year period. To judge whether this margin level is sustainable, do not look only at one quarter’s percentage. Watch whether pricing holds, whether nearline mix continues to rise, and whether HAMR / Mozaic technology moves smoothly into production.
Seagate explained in its 10-Q that gross margin for the March 2026 quarter increased by 5 percentage points sequentially, mainly driven by pricing actions. Year-over-year and nine-month gross margin improvement was also supported by pricing actions, favorable volume, and product mix. This means STX margin improvement is not a single-factor story. Pricing, shipments, and product mix are working together.
| Gross Margin Driver | Earnings Signal | Impact on Margin | What to Watch |
|---|---|---|---|
| Pricing actions | Management cited pricing as a margin driver | Raises unit revenue and profit | Large customers renegotiate pricing |
| Product mix | Nearline mix rises | High-capacity business lifts margin | Edge IoT mix rises with weaker margin |
| Shipment scale | Exabytes grow | Fixed costs are spread over more capacity | Shipments slow |
| HAMR / Mozaic | High-capacity roadmap progresses | Improves areal density and TCO advantage | Production or qualification delays |
| Supply discipline | HDD industry supply remains controlled | Supports the pricing environment | Supply expands too quickly |
Over the long term, HAMR and Mozaic are important variables for Seagate’s gross margin. Seagate’s Mozaic platform uses HAMR technology to improve areal density, with the goal of increasing capacity within the same data center footprint while reducing power per TB and total cost of ownership. In its Exos M high-capacity roadmap, the company also said the Mozaic 3+ platform supports samples of up to 36TB and emphasized higher areal density, TCO, and energy-efficiency advantages.
But a high gross margin does not mean the cycle has disappeared. HDD remains a cyclical industry. Customer concentration, price negotiations, cloud procurement timing, and peer technology roadmaps can all affect profitability. If STX gross margin continues to rise mainly because of short-term price increases rather than high-capacity products and stable demand, its sustainability should be discounted.
Summary: Whether STX gross margin improvement is sustainable depends on three layers. In the short term, watch whether pricing actions continue. In the medium term, watch whether nearline HDD and high-capacity product mix keep rising. In the long term, watch whether HAMR / Mozaic truly brings areal density and cost advantages. A 47% non-GAAP gross margin is a strong signal, but it is not a permanent conclusion. You should continue to monitor Q4 guidance, customer orders, ASP, product qualification, and peer margin performance. Margin improvement becomes more convincing only when it is accompanied by free cash flow expansion.
How to Read Free Cash Flow: The Core Test of STX Earnings Quality
STX free cash flow is the core test of earnings quality because it answers one question: has profit turned into cash? In Q3 FY2026, Seagate generated $1.1 billion of operating cash flow and $953 million of free cash flow. Management also highlighted that quarterly free cash flow was close to $1 billion. For investors, this is more useful than EPS in verifying whether the HDD upcycle is truly flowing into the company’s balance sheet.
EPS can be affected by adjustments, debt transactions, taxes, currency movements, and non-recurring items. Free cash flow is closer to the resources available for debt repayment, dividends, buybacks, and reinvestment. During the first nine months of FY2026, Seagate generated about $2.369 billion of operating cash flow, spent $382 million on capital expenditures, used $1.1 billion for debt repayment and repurchases, paid $468 million in dividends, and repurchased $59 million of shares. This shows that STX is not only pursuing growth; it is balancing cash flow, debt structure, and shareholder returns.
| Cash Flow Item | Latest Signal | What It Shows | What Investors Should Track |
|---|---|---|---|
| Operating cash flow | $1.1 billion in Q3 FY2026 | Strong core cash generation | Whether it remains stable across quarters |
| Free cash flow | $953 million in Q3 FY2026 | Can support debt and shareholder returns | Whether it covers dividends and capex |
| Capital expenditure | $382 million in first nine months | Maintains technology and capacity investment | Whether it affects future supply |
| Debt reduction | $1.1 billion in first nine months | Reduces financial risk | Whether interest expense falls |
| Dividend payments | $468 million in first nine months | Strong shareholder return intent | Whether dividend coverage remains healthy |
Strong cash flow also has valuation implications. A hardware company with rising EPS alone is often viewed as being near a cyclical peak. A company that converts gross margin improvement into free cash flow is more likely to be discussed as a higher-quality cyclical stock. The key question for STX is not whether it has profit, but whether it can keep generating free cash flow during the high-capacity HDD cycle while still funding HAMR, Mozaic, and the technology investments needed for data center customer qualification.
However, strong free cash flow does not mean the stock price must rise. If the market has already priced in AI storage demand, HDD price increases, and cash flow improvement, even strong earnings may be treated as already reflected. You need to evaluate free cash flow together with valuation, guidance, and peer data, rather than looking only at the absolute number for one quarter.
Summary: Free cash flow is the core test of STX earnings quality. Revenue and EPS tell you how much the company earned; free cash flow tells you whether those earnings became distributable resources. Q3 FY2026 free cash flow of nearly $1 billion is a strong signal, supporting debt reduction, dividends, buybacks, and technology investment. Going forward, the key is whether this cash flow can be repeated and whether it can cover capex and shareholder returns. Only if cash flow remains strong does STX’s dividend and valuation logic become more durable.
How to Read Shareholder Returns: Dividends, Buybacks, and Deleveraging Should Be Judged Together
STX shareholder returns should not be judged only by dividend yield. You need to assess dividends, buybacks, debt reduction, and free cash flow together. In Q3 FY2026, Seagate returned $191 million to shareholders through dividends and share repurchases. The board also declared a quarterly cash dividend of $0.74 per share. Shareholder returns are an important part of the STX investment case, but they depend on strong enough cash flow and a balance sheet that is not under excessive pressure.
In its FY2026 Q2 earnings, Seagate maintained a quarterly cash dividend of $0.74 per share. In its FY2026 Q1 earnings, the company also noted that it had increased the quarterly cash dividend by about 3%. From FY2025 full-year earnings through FY2026 Q3, Seagate’s dividend continuity and cash flow improvement have formed a clearer capital return pattern.
But dividends do not mean a company is “safe.” Dividend yield can rise passively because the stock price falls, or appear lower because the stock price rises. What matters is whether free cash flow covers the dividend, whether debt is declining, whether interest expense is under control, whether buybacks are being conducted at reasonable valuations, and whether technology investment is being squeezed by shareholder payouts.
| Shareholder Return Item | Positive Signal | Risk Signal | Related Earnings Metric |
|---|---|---|---|
| Dividend | Stable payment covered by cash flow | Dividend maintained through borrowing | Free cash flow, dividend payments |
| Buyback | Moderate buybacks during strong cash flow periods | Excessive buybacks at high valuations | Buyback amount, share price range |
| Deleveraging | Debt principal declines | Interest expense remains high | Long-term debt, interest expense |
| Technology investment | HAMR / Mozaic continues to progress | R&D cut to support shareholder returns | R&D expense, product roadmap |
| Liquidity | Cash and credit lines remain sufficient | Cash buffer declines | Cash, revolving credit availability |
As of April 3, 2026, Seagate had about $1.146 billion in cash and cash equivalents and $1.3 billion available under its revolving credit facility. This liquidity provides a buffer for dividends, debt service, and operations, but it still needs to be assessed alongside debt maturities, interest expense, and the industry cycle. If the HDD industry enters a downturn, shareholder return capacity could also be affected.
Summary: STX dividends and buybacks should be viewed as outcomes of cash flow allocation, not standalone reasons to buy the stock. A stable dividend shows the company’s willingness to return capital to shareholders. Strong free cash flow shows that this return has a foundation. Debt reduction shows that the balance sheet is improving. Healthy shareholder returns occur when the company does not sacrifice its technology roadmap, increase financial pressure, or ignore cycle risk. When analyzing STX, put dividends, buybacks, deleveraging, and HAMR investment into the same framework rather than looking only at dividend yield.
How to Read Future Earnings: Q4 Guidance, WDC Comparison, and Cycle Risk
For the next STX earnings report, you should verify three things: whether nearline HDD shipments continue to grow, whether gross margin remains high, and whether free cash flow continues to support shareholder returns. The company’s FY2026 Q4 guidance is revenue of $3.45 billion, plus or minus $100 million, and non-GAAP EPS of $5.00, plus or minus $0.20. This guidance is already strong, so the market will focus more on execution quality and the forward slope.
You can use the following checklist for the next STX earnings report:
| Tracking Item | Positive Signal | Negative Signal | Investment Implication |
|---|---|---|---|
| Nearline exabytes | Continue to grow sequentially | Shipments slow | Verifies data center demand |
| Data Center mix | Stays around or above 80% | Edge IoT mix rises passively | Judges growth quality |
| Gross margin | Remains high or rises further | Pricing actions weaken | Tests pricing power |
| Free cash flow | Remains strong | Working capital becomes a drag | Tests shareholder return capacity |
| Q4 / Q1 guidance | Demand remains strong | Guidance is cautious or cut | Shows cycle position |
| HAMR progress | Customer qualification and shipments progress | Production timeline slips | Tests long-term competitiveness |
A horizontal comparison between STX and WDC is also important. Western Digital’s Q3 FY2026 earnings also showed strong revenue, gross margin, and free cash flow, suggesting that HDD industry improvement is not limited to one company. STX and WDC both benefit from AI data center storage demand, but you should not compare them only by stock price moves. Compare nearline shipments, Data Center / Cloud revenue mix, gross margin, free cash flow, technology roadmap, debt structure, and shareholder returns.
Risks should be placed into the same framework. Reuters’ reporting on AI-driven hard-drive demand shows that the market has already significantly revalued Seagate and Western Digital. The higher expectations become, the greater the pressure on earnings delivery. If AI capex slows, customers adjust inventory, HDD prices fall, HAMR production falls short of expectations, or the stock price has already reflected too much good news, STX can still experience significant volatility.
If you are watching trading opportunities after STX earnings, you should also consider actual trading costs in addition to nearline HDD, free cash flow, and shareholder returns. U.S. stock trading costs usually include more than commissions; they may also include platform fees, external agency fees, trading activity fees, and execution price differences. If the service is available in your region, you can review Biya U.S. stock trading fees. Biya charges $0 commission for U.S. stock trading, while platform fees, external agency fees, and other costs are subject to the fee schedule and order page.
Summary: The key task in the next STX earnings report is not to repeat that “AI needs storage,” but to verify whether demand continues to turn into shipments, gross margin, and cash flow. You should focus on nearline exabytes, Data Center mix, gross margin, free cash flow, guidance beyond Q4, and HAMR progress. If STX and WDC both remain strong, the industry cycle argument becomes more reliable. If only one company improves, or if the stock price has already reflected most of the good news, post-earnings volatility risk will rise.
If you continue to track U.S.-listed storage chain companies such as STX, WDC, SNDK, and MU, you need to understand nearline HDD, AI data center demand, free cash flow, shareholder returns, and trading costs at the same time. Biya is a global multi-asset trading wallet that supports U.S. stocks, Hong Kong stocks, digital assets, and other asset classes. You can use U.S. stock information search to organize related names such as Seagate, Western Digital, SanDisk, and Micron, then combine earnings dates, order types, fee structures, and your own risk tolerance for research. Service availability depends on your location, identity verification result, platform rules, and applicable laws and regulations. To manage watchlists on mobile, you can download the App and review supported services. Public market information, trading fees, and stock data are for investment research reference only and do not constitute investment advice.
FAQ
Why Is Nearline HDD Important in Seagate STX Earnings?
Nearline HDD is important because it represents demand from cloud providers, AI data centers, and enterprise capacity storage. STX’s current revenue, gross margin, and free cash flow improvement mainly depend on high-capacity nearline drive shipments and sustained Data Center demand.
How Should Investors Read Seagate STX Free Cash Flow?
STX free cash flow should be assessed together with operating cash flow, capital expenditure, working capital, debt reduction, dividends, and buybacks. The more stable free cash flow is, the more support it provides for capital returns, but investors still need to watch the HDD cycle and customer procurement volatility.
Does Seagate STX’s Dividend Mean the Company Is Safe?
STX’s dividend shows that the company has the willingness to return cash to shareholders, but it does not mean investment risk is low. You still need to assess free cash flow coverage, debt level, interest expense, HDD cycle position, and whether the stock’s valuation is reasonable.
How Should Seagate STX and Western Digital WDC Earnings Be Compared?
STX and WDC earnings should be compared across nearline HDD shipments, Data Center / Cloud revenue mix, gross margin, free cash flow, technology roadmap, debt structure, and shareholder returns. If both companies improve at the same time, it provides stronger evidence that HDD industry conditions are improving.
How Does Seagate STX’s HAMR Technology Affect Earnings?
HAMR technology supports higher-capacity HDDs by improving areal density, which can help lower data center cost and power consumption per TB. It is important for long-term competitiveness, but in the short term, customer qualification, production timing, and yield performance still need to be tracked.
What Risks Should Ordinary Investors Watch in STX Earnings?
Ordinary investors should watch risks such as slowing AI capex, falling HDD prices, customer inventory adjustments, weaker-than-expected HAMR production, and the stock price already reflecting good news. Strong earnings data does not guarantee that the stock price will rise.
*This article is provided for general information purposes and does not constitute legal, tax or other professional advice from BiyaPay or its subsidiaries and its affiliates, and it is not intended as a substitute for obtaining advice from a financial advisor or any other professional.
We make no representations, warranties or warranties, express or implied, as to the accuracy, completeness or timeliness of the contents of this publication.
Related Blogs of

What Are the Bottlenecks in HBM Packaging? CoWoS, TCB, and the Link to Equipment Suppliers


HPE, Dell, and Enterprise Storage: Which Company Looks More Like an AI Infrastructure Player?


How Do Dell’s AI Server and Storage Businesses Affect Its Stock Price?

Is NetApp an AI Infrastructure Stock? Cloud Data Management and Enterprise Storage Positioning
Choose Country or Region to Read Local Blog
 Australia
 Austria
 Belgium
 Canada
 Cyprus
 Czech Republic
 Denmark
 Estonia
 Finland
 France
 Germany
 Greece
 Hong Kong
 India
India Indonesia
 Ireland
 Italy
Italy Japan
Japan Latvia
 Lithuania
 Luxembourg
 Malaysia
 Malta
Malta Morocco
 Nepal
Nepal Netherlands
 New Zealand
 Norway
 Pakistan
 Philippines
 Poland
 Portugal
 Romania
 Singapore
 Slovakia
 Slovenia
 South Africa
 South Korea
 Spain
Spain Sweden
 Thailand
 The United States
 Turkey
 United Arab Emirates
 United Kingdom
 Vietnam
Contact Us




BIYA GLOBAL LLC is registered with the Financial Crimes Enforcement Network (FinCEN), an agency under the U.S. Department of the Treasury, as a Money Services Business (MSB), with registration number 31000218637349, and regulated by the Financial Crimes Enforcement Network (FinCEN).
BIYA GLOBAL LIMITED is a registered Financial Service Provider (FSP) in New Zealand, with registration number FSP1007221, and is also a registered member of the Financial Services Complaints Limited (FSCL), an independent dispute resolution scheme in New Zealand.