Which Price Increase Matters More to Micron: DRAM or NAND?




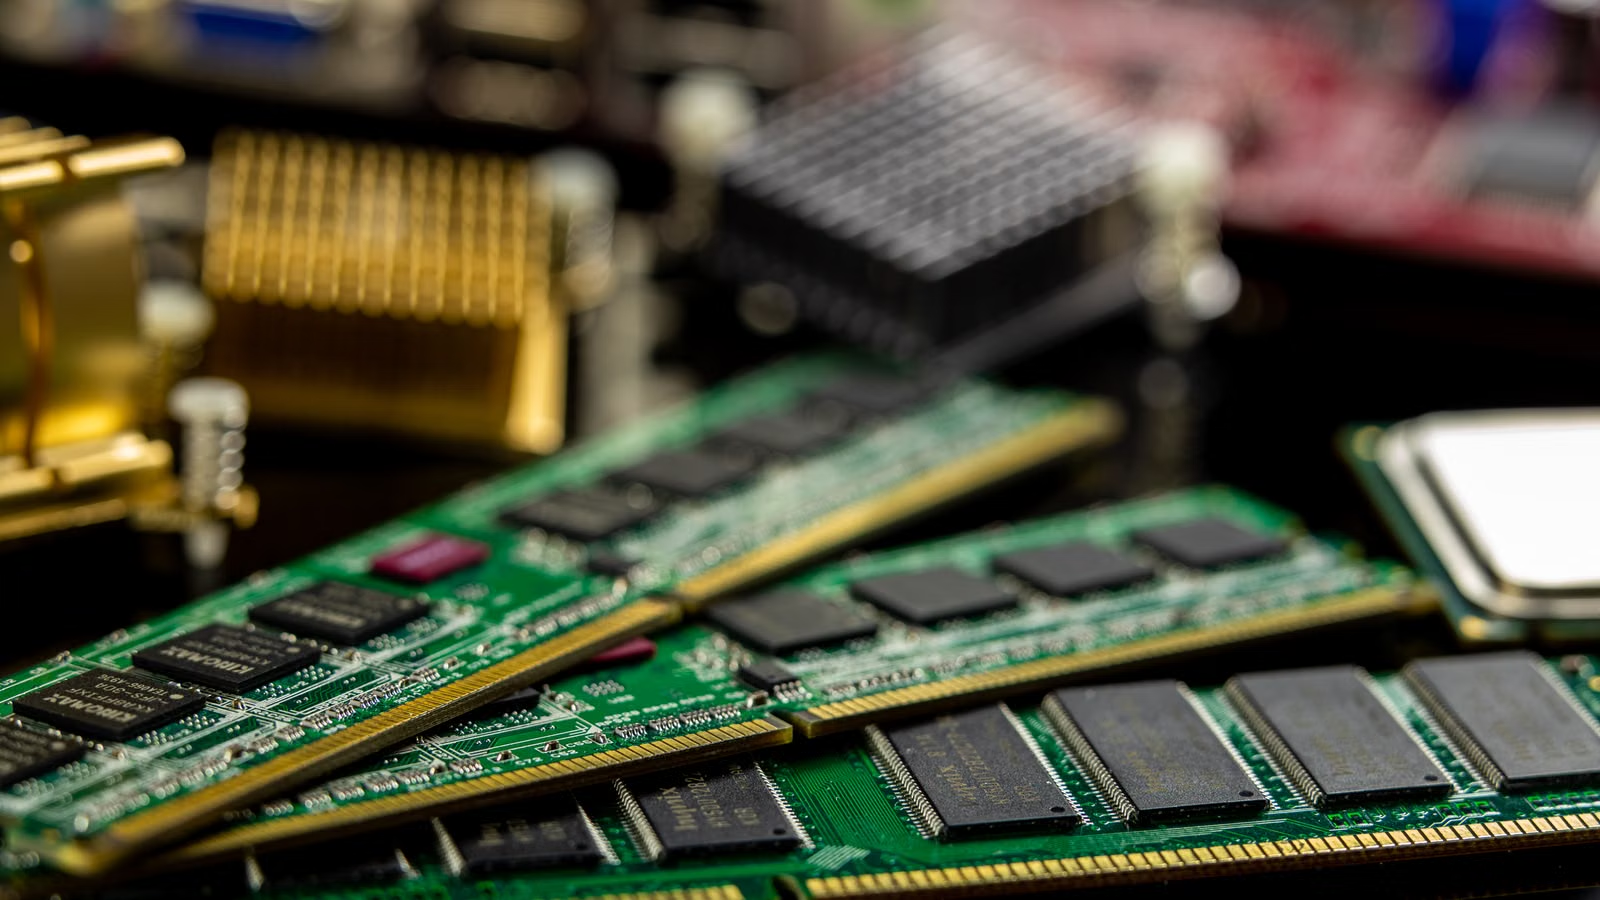
Both DRAM and NAND price increases affect Micron, but their impact is different. DRAM is the core driver of Micron’s revenue base and AI server narrative because it is tied to HBM, server memory, and data center customers. NAND accounts for a smaller share of revenue, but when enterprise SSDs are in short supply, AI data access demand rises, and NAND prices rebound quickly, it can create stronger short-term earnings leverage. When you analyze Micron, the key is not which price rises more, but whether those increases translate into revenue, gross margin, order visibility, and free cash flow.
Key Takeaways
- DRAM has a larger impact on Micron because it contributes a bigger revenue share and is directly tied to HBM and AI servers.
- NAND is more sensitive to short-term earnings leverage, especially during enterprise SSD shortages and fast price recoveries.
- Micron’s margin improvement comes from rising DRAM and NAND prices, plus a better AI data center product mix.
- The memory cycle is shifting from consumer electronics toward HBM, server memory, and data center SSDs.
- Micron should not be judged only by price increases; inventory, bit shipments, customer agreements, and cash flow also matter.
What Is the Fundamental Difference Between DRAM and NAND for Micron?
DRAM is more like Micron’s revenue and profit foundation, while NAND is more like a cyclical earnings amplifier. For Micron, DRAM is usually more important because it has a higher revenue share and is directly linked to HBM, server memory, AI training, and inference demand. NAND has a smaller revenue base, but when enterprise SSDs are tight and NAND ASP rises quickly, its short-term earnings leverage can become more visible.
DRAM is volatile memory used for high-speed read and write operations during computing. Servers, AI accelerators, PCs, smartphones, automotive electronics, and industrial devices all need DRAM. Micron’s DRAM business matters not only because it is large, but also because it is increasingly tied to AI servers. Micron’s FY2026 Q3 results showed total revenue of $41.46 billion, up from $23.86 billion in the prior quarter and far above $9.3 billion in the same period a year earlier.
Looking more closely at the business mix, Micron’s FY2026 Q3 earnings call prepared remarks showed DRAM revenue of $31.3 billion, accounting for 76% of total revenue, while NAND revenue was $9.9 billion, accounting for 24%. This means that every incremental increase in DRAM pricing usually has a larger impact on Micron’s total revenue and income statement.
NAND is non-volatile storage, meaning it can retain data after power is turned off. It is used in SSDs, smartphone storage, PC SSDs, automotive storage, and data center SSDs. For Micron, NAND matters because of its elasticity: when prices recover from a low base, enterprise SSD demand rises, and AI data centers accelerate purchases, NAND revenue can grow very quickly. The same Micron prepared remarks showed FY2026 Q3 NAND revenue up 99% sequentially, with pricing up in the mid-80s percentage range. DRAM revenue grew 67% sequentially, with pricing up in the low-60s percentage range.
| Comparison | DRAM Price Increase | NAND Price Increase |
|---|---|---|
| Impact on Micron revenue | Larger, due to higher revenue share | Smaller, but with stronger short-term leverage |
| AI relevance | HBM, server DRAM, AI memory | Enterprise SSDs, AI data reads |
| Profit stability | Stronger, closer to Micron’s core business | More cyclical |
| Price driver | HBM, DDR5, server demand | SSDs, QLC, data center storage |
| Investor focus | HBM shipments, DRAM ASP, server DRAM | Data center SSDs, NAND ASP, inventory |
Summary: DRAM has a larger impact on Micron because it has a higher revenue share, stronger AI server relevance, and a product mix closer to high-value memory. NAND is also important for short-term earnings leverage, especially when enterprise SSDs are tight and NAND prices recover quickly. The question should not be reduced to “DRAM or NAND.” A better framework is that DRAM drives Micron’s main growth line and valuation narrative, while NAND drives incremental acceleration in certain quarters. If DRAM and NAND prices rise together, inventory remains healthy, and cash flow improves, Micron’s cycle quality becomes stronger.
Why Does DRAM Usually Define Micron’s Main Investment Logic?
DRAM price increases usually define Micron’s main investment logic because DRAM has a larger revenue share and is directly tied to AI servers, HBM, DDR5, high-capacity RDIMMs, and data center customers. When you analyze Micron, DRAM price increases are no longer just a sign of a traditional PC or smartphone memory cycle recovery. They increasingly reflect the repricing of high-bandwidth, high-capacity, low-latency memory demanded by AI infrastructure.
The traditional DRAM cycle was mainly driven by PCs, smartphones, and general-purpose servers. When demand was strong, customers replenished inventory and prices rose; when demand weakened, inventory built up and prices fell. This cycle is different. AI training, inference, and agentic AI require higher memory bandwidth, greater capacity, lower power consumption, and more advanced packaging. HBM has become a key component in high-end AI accelerators, while server DRAM also benefits from more CPU racks, memory capacity, and inference workloads.
Micron said in its FY2026 Q3 prepared remarks that AI is changing memory product mix and technology roadmaps. The company also said its HBM4 12-high ramp is faster than its HBM3E 12-high ramp and that it has shipped more than $1 billion of HBM4 revenue. HBM belongs to the DRAM logic, but it is not ordinary DRAM. It is a high-bandwidth, high-value product designed for AI accelerators. It influences how the market values Micron’s DRAM quality, margin profile, and long-term valuation leverage.
DRAM price increases also flow into gross margin more directly. Micron’s FY2026 Q3 consolidated gross margin reached 84.9%, up 10 percentage points sequentially, mainly driven by higher pricing and a more favorable product mix. Since DRAM accounted for 76% of revenue, rising DRAM ASP naturally had a larger impact on total gross margin. In other words, DRAM is the main support for Micron’s margin level, while NAND further amplifies earnings leverage on top of that base.
| DRAM Metric | Why It Matters | Meaning for Micron |
|---|---|---|
| DRAM revenue share | Determines the earnings base | The higher the share, the bigger the pricing impact |
| HBM shipments | Connects to AI servers | Affects valuation narrative and product mix |
| Server DRAM demand | Core to data center expansion | Supports medium-term revenue stability |
| DRAM ASP | Price cycle signal | Directly affects gross margin |
| Long-term customer agreements | Improves order visibility | Reduces cycle uncertainty |
Long-term customer agreements are another reason DRAM has become the stronger main line. Reuters’ report on Micron’s customer agreements said Micron had signed multi-year agreements with 16 strategic customers, involving take-or-pay commitments, cash deposits, and price floors, with related commitments reaching $22 billion. Customers’ willingness to secure future supply suggests high-end memory tightness is not merely a one-quarter phenomenon. It also shows that DRAM and HBM are taking on more strategic importance.
Summary: DRAM is currently the more important main variable for Micron because it determines revenue scale, AI server relevance, product mix improvement, and gross margin leverage. With HBM, server DRAM, DDR5/DDR6, and high-capacity RDIMMs, DRAM price increases are no longer just a PC or smartphone inventory-cycle recovery. They are part of the repricing of AI data center resources. When judging Micron’s longer-term logic, you should first track DRAM ASP, HBM shipments, server memory demand, and long-term customer agreements. If these indicators continue to improve, DRAM’s impact on Micron will be much greater than an ordinary NAND cycle recovery.
Why Can NAND Price Increases Still Create Stronger Marginal Leverage?
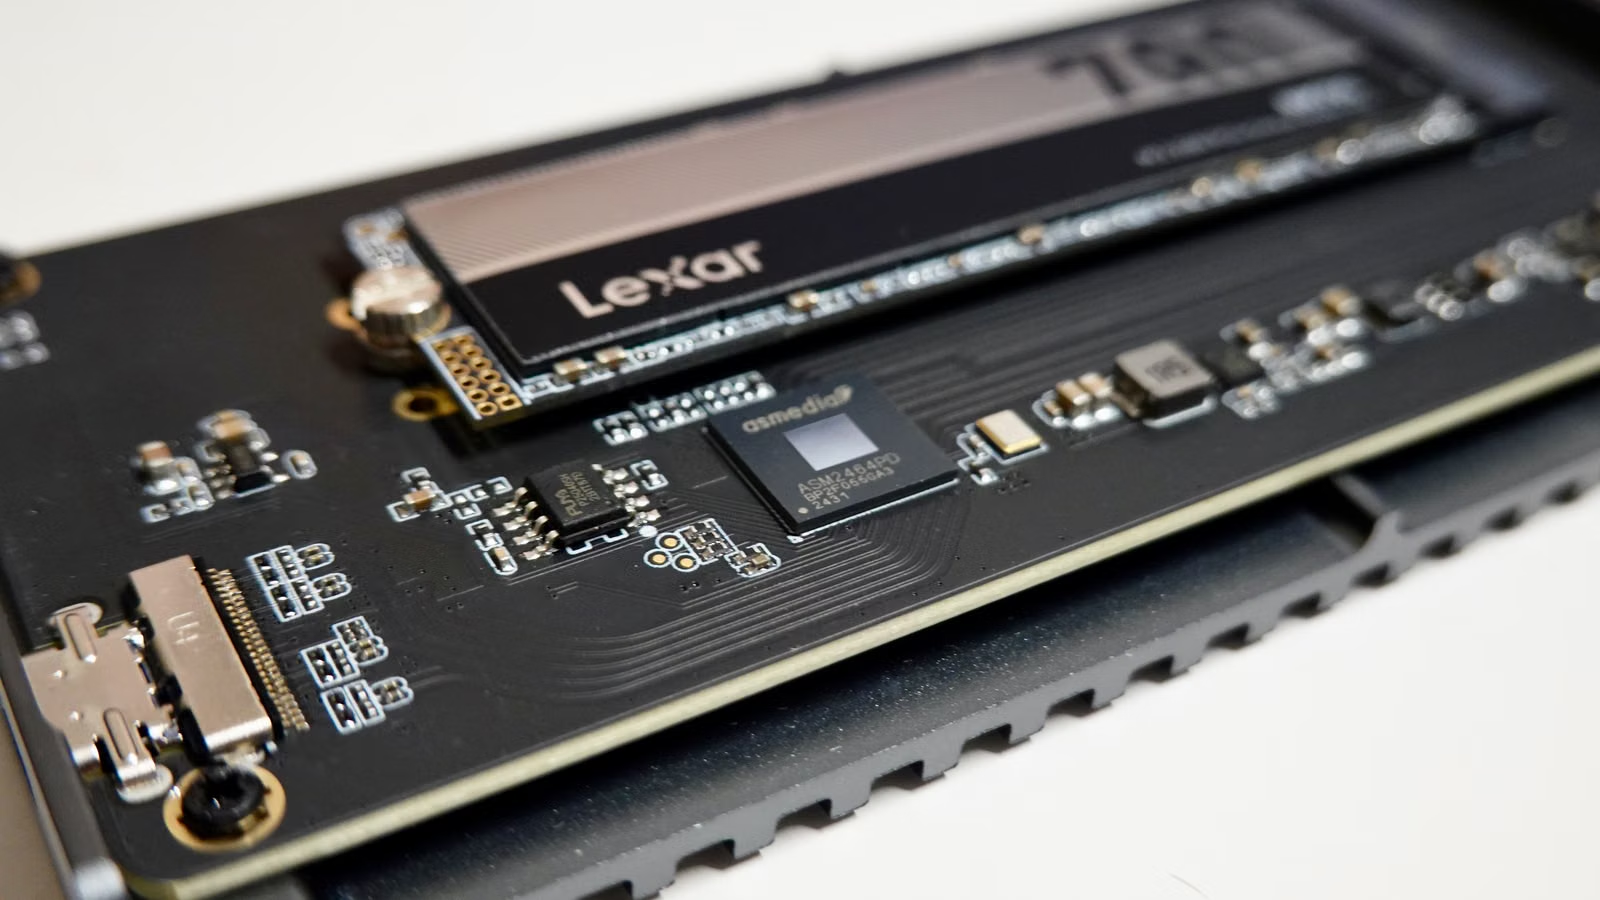
NAND price increases matter less than DRAM in terms of revenue base, but their marginal leverage should not be underestimated. In FY2026 Q3, Micron’s NAND revenue rose 99% sequentially, its pricing increase was larger than DRAM’s, and data center SSD revenue exceeded $5 billion and more than doubled sequentially. Put simply, DRAM defines Micron’s core base, while NAND can determine the scale of earnings upside when enterprise SSDs are tight, AI context storage expands, and data centers demand low-latency storage.
Many investors still think of NAND mainly as smartphone storage or consumer SSDs. For Micron, the more important area is enterprise SSDs. AI data centers need fast training data reads, vector database support, inference caching, log storage, and context data management. These workloads increase demand for enterprise SSDs. In its FY2026 Q3 prepared remarks, Micron said data center SSD revenue exceeded $5 billion and more than doubled sequentially, showing that NAND-related AI demand is moving from concept into revenue.
NAND’s short-term leverage also comes from price increases. Micron disclosed that FY2026 Q3 NAND bit shipments rose only in the mid-single-digit percentage range, while NAND revenue grew 99% sequentially. This means the revenue improvement mainly came from ASP and product mix, not simply shipment growth. When price increases far exceed bit shipment growth, earnings leverage can become very strong.
Industry data also supports the NAND price recovery. TrendForce’s view on 2Q26 NAND Flash contract prices suggested that overall NAND Flash contract prices were expected to rise 70%–75% sequentially, with AI and data center demand as major drivers. However, NAND’s risks are also more visible. It is still affected by PCs, smartphones, client SSDs, and consumer electronics inventory. If prices rise too quickly, downstream customers may delay purchases, reduce configurations, or pass costs on to end users.
| NAND Driver | Positive Impact on Micron | Risk to Watch |
|---|---|---|
| Enterprise SSD shortage | Improves ASP and gross margin | Customers may delay purchases |
| AI context storage | Expands data center SSD demand | Architecture changes may affect demand |
| QLC NAND upgrade | Improves capacity economics | Price competition may intensify |
| Consumer price increases | Improves revenue in the short term | PC and smartphone demand may weaken |
| HDD displacement opportunity | Expands SSD market opportunity | Cost remains higher than HDD |
The significance of NAND price increases for Micron depends on where the increase comes from. If it is driven mainly by AI data center SSDs, enterprise customer orders, and supply tightness, it provides healthier support for margins. If it is mainly driven by passive consumer restocking, future demand pull-forward becomes a bigger risk. When tracking NAND, you should not look only at price indices. You should also track data center SSD revenue, enterprise SSD mix, client SSD inventory, and downstream customer affordability.
Summary: NAND is more like an earnings leverage accelerator for Micron. Its revenue share is lower than DRAM’s, but when enterprise SSDs are tight, NAND ASP rises quickly, and AI data centers require higher-performance storage, NAND can significantly amplify earnings. The challenge is that NAND remains more exposed to consumer electronics cycles and downstream price sensitivity. Therefore, you should not judge NAND only by the size of its price increase. You also need to look at enterprise SSD mix, data center SSD revenue, inventory levels, and customer affordability. The more NAND price increases are driven by data center demand, the higher their quality. The more they depend on passive consumer price increases, the higher the risk.
Does Micron’s Margin Improvement Come From DRAM or NAND?
Micron’s margin improvement does not come from DRAM or NAND alone. It is the combined result of rising DRAM and NAND prices, product mix improvement, and AI data center demand. Because DRAM has a higher revenue share, it has a larger impact on overall gross margin. Because NAND prices rose faster and enterprise SSDs ramped, NAND provided stronger marginal improvement. To judge margin quality, you need to watch ASP, bit shipments, business unit gross margins, inventory days, and free cash flow together.
In FY2026 Q3, Micron’s consolidated gross margin reached 84.9%, up 10 percentage points sequentially. This improvement was not just because “prices went up.” It was also driven by product mix. Higher-value products such as HBM, server memory, and data center SSDs can produce more revenue and profit from the same bit shipment base. If prices rise but the product mix remains low-end, margin improvement may not last. If the product mix is strong but ASP enters a downturn, earnings leverage can also fade.
By business unit, Micron’s earnings structure is increasingly data-center-oriented. The prepared remarks showed Cloud Memory Business Unit revenue of $13.8 billion, accounting for 33% of total revenue, with an 83% gross margin. Core Data Center Business Unit revenue was $11.5 billion, accounting for 28%, with an 87% gross margin. Mobile and Client Business Unit revenue was $11.5 billion, also 28%, with an 87% gross margin. Automotive and Embedded Business Unit revenue was $4.6 billion, accounting for 11%, with a 79% gross margin. This shows that AI and data center-related businesses have become important contributors to margin improvement.
Cash flow is an even better test of price increase quality. Micron’s FY2026 Q3 results showed operating cash flow of $25.39 billion for the quarter, up from $11.9 billion in the prior quarter. The prepared remarks also said capex was $7.1 billion and free cash flow was $18.3 billion, a quarterly record. For a cyclical stock, price increases that do not turn into cash flow deserve a discount. If prices, margins, and free cash flow all improve together, the cycle quality is stronger.
| Financial Metric | DRAM Price Impact | NAND Price Impact | Key Judgment |
|---|---|---|---|
| Total revenue | Larger impact | Smaller base but stronger leverage | Revenue share and sequential growth |
| Gross margin | Determines margin level | Improves marginal profit | ASP and product mix |
| Free cash flow | Improves through profit scale | Strengthened by SSD ramp | Whether cash flow rises with earnings |
| Inventory | Tight supply supports pricing | Consumer inventory risk remains | Days of inventory |
| Valuation | Drives long-term AI narrative | Drives short-term upside surprise | Sustainability |
Inventory also matters. Micron disclosed FY2026 Q3 inventory of $8.6 billion and days of inventory of 120. It also said DRAM inventories were very tight and below 120 days. Tight inventory suggests that customer demand and supply constraints are still supporting prices. But if inventory days rise again in future quarters and price increases slow, margin expectations may be repriced.
If you track U.S.-listed companies like Micron, you should consider trading costs in addition to fundamentals. U.S. stock trading costs may include more than commissions; they can also include platform fees, external agency fees, trading activity fees, and other charges. If related services are available in your region, Biya can be used to follow U.S. and Hong Kong stocks. Its U.S. stock trading fees state that Biya charges $0 commission for U.S. stock trading, while platform fees, external agency fees, and other fees are subject to the fee center and order page. Service availability depends on your location, identity verification results, platform rules, and applicable laws and regulations.
Summary: Micron’s margin improvement comes from both DRAM and NAND price increases, but their roles differ. DRAM, because of its higher revenue share, is more like the determinant of the margin level. NAND, because of faster price increases and enterprise SSD growth, is more like the source of marginal profit leverage. When judging Micron’s earnings quality, you should look at whether margin expansion is supported by pricing, product mix, AI data center demand, and cash flow together, rather than focusing on a single product price increase. If revenue, margins, inventory, and free cash flow are all healthy, price increases are turning into higher-quality earnings. If only quotes rise while cash flow and inventory deteriorate, cycle risk rises meaningfully.
What Risk Signals Should Investors Watch in the DRAM and NAND Price Cycle?
DRAM and NAND price increases are positive for Micron, but the biggest risks are demand suppression after prices rise too quickly, customer pre-buying, supplier capacity expansion, pressure on consumer electronics, and valuations pricing in too much early. Not every price increase should be treated as a long-term positive. For cyclical stocks, the first half of a price upcycle usually drives earnings upgrades, while the second half may bring customer resistance, inventory buildup, and cycle reversal.
The first risk is consumer demand pressure. PCs, smartphones, gaming devices, and consumer SSDs are more sensitive to cost. If memory and storage prices rise too quickly, they can squeeze device makers’ margins. TrendForce noted in its 2Q26 price outlook that some consumer applications reduced demand because of cost pressure. This shows that high prices have already started to affect downstream behavior. Although Micron is increasingly benefiting from AI data centers, mobile, client, and consumer demand still affects NAND and some DRAM products.
The second risk is slower price momentum. Prices can keep rising even if the rate of increase slows. Tom’s Hardware, citing TrendForce’s 3Q26 price outlook, said conventional DRAM contract prices were expected to rise 13%–18%, while NAND Flash was expected to rise 10%–15%, a much slower pace than earlier increases. For stocks, markets care not only about price direction but also whether the pace exceeds expectations.
The third risk is the two-sided nature of long-term agreements. Strategic customer agreements can improve supply visibility and cash flow stability, but if spot prices continue to rise sharply, long-term agreements may smooth out some pricing upside. If prices fall in the future, agreement execution, customer commitments, and price terms may also attract scrutiny. Micron’s FY2026 Q3 10-Q filed with the SEC noted that the disclosure of remaining performance obligations is based on minimum committed quantities and minimum prices, and does not necessarily represent future actual revenue. Investors need to read these details carefully.
| Risk Signal | Possible Sign | Impact on Micron |
|---|---|---|
| Consumer pressure | PCs and smartphones reduce configurations or delay purchases | NAND and client DRAM demand weakens |
| Slower price momentum | ASP still rises, but sequential increase slows | Market expectations may be revised down |
| Customer inventory rises | Pre-buying leads to weaker future purchases | Next-cycle revenue volatility |
| Supply expansion | New capacity comes online | Gross margin may fall |
| High valuation | Share price prices in the upcycle early | Post-earnings volatility increases |
The fourth risk is valuation pricing in the price cycle early. If the share price already reflects several future quarters of high margins, high ASP, and strong growth, even a good earnings report can trigger volatility if guidance is not strong enough. This is the difficulty with memory stocks: the best financial numbers may appear when market expectations are already most optimistic.
Summary: DRAM and NAND price increases are positive for Micron, but cyclical risks often appear when sentiment is most optimistic. You should watch consumer affordability, whether price momentum is slowing, whether customers are pre-buying, whether suppliers are expanding capacity, and whether Micron’s valuation already reflects future earnings improvement. If price increases lead to revenue growth, margin expansion, and free cash flow improvement together, cycle quality is stronger. If only the price increase narrative remains while demand, inventory, and cash flow begin to diverge, risk increases. For Micron, a healthier price cycle should be driven by data center demand, not merely by passive downstream restocking.
How Should Ordinary Investors Decide Whether to Track DRAM or NAND More Closely?
Ordinary investors can use a simple framework. For the long-term main line, track DRAM, HBM, and server memory first. For short-term earnings leverage, focus on NAND, enterprise SSDs, and data center SSD revenue. For risk control, watch consumer demand, inventory, and price momentum. For Micron, DRAM determines the main story, NAND determines earnings leverage, cash flow determines quality, and valuation determines margin of safety.
The first step is to separate main variables from leverage variables. Main variables include DRAM revenue share, HBM shipments, server DRAM demand, and long-term AI data center customer agreements. Leverage variables include NAND ASP, data center SSD revenue, enterprise SSD shortages, QLC NAND, and HDD displacement opportunities. You do not need to track every daily price quote, but each quarter you should check whether these variables are moving in the same direction.
The second step is to build a fixed tracking table. This helps prevent single headlines from distorting your judgment.
| Tracking Item | More DRAM or NAND? | Why It Matters | Update Frequency |
|---|---|---|---|
| DRAM revenue share | DRAM | Determines Micron’s revenue base | Quarterly |
| HBM revenue / shipment | DRAM | Drives AI valuation narrative | Quarterly |
| NAND revenue growth | NAND | Shows marginal earnings leverage | Quarterly |
| Data center SSD revenue | NAND | Shows enterprise SSD demand | Quarterly |
| Gross margin | Both | Verifies price increase quality | Quarterly |
| Inventory days | Both | Shows cycle position | Quarterly |
| Free cash flow | Both | Tests earnings cash conversion | Quarterly |
The third step is to combine industry data with company earnings. Industry reports can tell you DRAM and NAND price trends, but company earnings tell you whether Micron is actually benefiting. For example, TrendForce’s statistics on 1Q26 DRAM industry revenue said conventional DRAM contract prices rose about 93%–98% sequentially, driving DRAM industry revenue up 81% sequentially. This industry-level price increase needs to be combined with Micron’s DRAM revenue, HBM shipments, and gross margin before you can judge whether it is entering company earnings.
The fourth step is to form a conclusion-oriented view. If DRAM prices are strong, HBM ramps, and server demand is solid, Micron’s main investment logic is stronger. If NAND prices are strong and data center SSDs ramp, earnings leverage is stronger. If DRAM and NAND prices rise together, inventory is healthy, and free cash flow improves, fundamental quality is higher. If price momentum slows, consumer demand is pressured, and valuation is stretched, optimistic extrapolation should be reduced.
If you need to track Micron, other semiconductor stocks, and memory cycle data, U.S. stock market information can help you monitor market moves, earnings dates, and company information. Before trading, you should still check fees shown on the order page, external agency fees, applicable rules, and your own risk tolerance. Industry logic should not be treated as a direct buy signal.
Summary: Ordinary investors do not need to predict DRAM and NAND quotes every day. They need a fixed tracking framework. For the long term, watch DRAM, HBM, and server memory because they define Micron’s AI main line. For the short term, watch NAND, enterprise SSDs, and data center SSDs because they define earnings leverage. Finally, use gross margin, inventory, and free cash flow to verify whether price increases are truly turning into profits. Before trading, also check fee structure, order rules, and personal risk tolerance. If the DRAM main line and NAND leverage improve at the same time, Micron’s fundamentals become stronger. If only one product category rises in price while demand or cash flow weakens, caution is warranted.
If you follow Micron, DRAM, NAND, HBM, enterprise SSDs, and the memory price cycle, you can put market quotes, earnings dates, company announcements, fee structures, and risk control into one framework. Biya is a global multi-asset trading wallet that supports U.S. stocks, Hong Kong stocks, and crypto trading, and also supports converting USDT into major fiat currencies such as U.S. dollars or Hong Kong dollars. Service availability depends on your location, identity verification results, platform rules, and applicable laws and regulations. You can also use Download App to follow changes in the U.S. stock market. Public market information and industry analysis can help you understand the logic, but they do not constitute investment advice. Actual trading should be based on your own risk tolerance, order details, and platform information.
FAQ
Why Do DRAM Price Increases Affect Micron’s Earnings More?
DRAM price increases usually affect Micron’s earnings more because DRAM contributes a higher share of revenue and is directly tied to HBM, server memory, and AI data center demand. You still need to look at bit shipments, product mix, and gross margin to judge the quality of the price increase, rather than relying only on higher quotes.
How Do NAND Price Increases Affect Micron’s Margins?
NAND price increases affect Micron’s margins through enterprise SSDs, data center SSDs, and consumer storage products. If the price increase is driven by AI data centers and enterprise SSD shortages, margin leverage is stronger. If it mainly comes from passive consumer price increases, downstream demand pressure becomes a bigger risk.
Is Micron’s HBM Part of DRAM or NAND Logic?
HBM belongs to the DRAM logic, but it is not ordinary DRAM. It is high-bandwidth memory designed for AI accelerators. For Micron, HBM is closer to AI servers and high-value product mix, so it affects how the market evaluates the quality and valuation leverage of Micron’s DRAM business.
Why Are Enterprise SSDs Important to Micron’s NAND Business?
Enterprise SSDs are very important to Micron’s NAND business because they expand NAND demand from consumer electronics into AI data centers, low-latency storage, and high-performance data reads. Compared with ordinary client SSDs, enterprise SSDs better reflect the incremental NAND demand created by AI infrastructure.
How Should Investors Judge the DRAM and NAND Cycle When Both Prices Rise?
When DRAM and NAND prices rise at the same time, investors should check whether price increases are accompanied by healthy inventory, stable bit shipments, margin improvement, and free cash flow growth. If prices rise mainly because of short-term pre-buying or forced consumer restocking, cycle risk is higher than in a demand-driven upcycle.
What Metrics Should Ordinary Investors Track for Micron?
Ordinary investors tracking Micron can focus on DRAM revenue share, NAND revenue growth, HBM shipments, data center SSD revenue, gross margin, inventory days, and free cash flow. Before trading, they should also check fee structures, order rules, and their own risk tolerance.
*This article is provided for general information purposes and does not constitute legal, tax or other professional advice from BiyaPay or its subsidiaries and its affiliates, and it is not intended as a substitute for obtaining advice from a financial advisor or any other professional.
We make no representations, warranties or warranties, express or implied, as to the accuracy, completeness or timeliness of the contents of this publication.
Related Blogs of

ASML Earnings Preview: Can EUV Order Signals Continue to Validate the AI Chip Cycle?


Does AI Inference Need More Storage Than Training? Breaking Down Server Memory and Data Retention Demand


What Is the Difference Between EEPROM and NOR Flash? A Beginner’s Guide to Shanghai Fudan’s Hong Kong-Listed Business


What Is HAMR? Seagate and Western Digital’s Roadmaps for High-Capacity HDDs
Choose Country or Region to Read Local Blog
 Australia
 Austria
 Belgium
 Canada
 Cyprus
 Czech Republic
 Denmark
 Estonia
 Finland
 France
 Germany
 Greece
 Hong Kong
 India
India Indonesia
 Ireland
 Italy
Italy Japan
Japan Latvia
 Lithuania
 Luxembourg
 Malaysia
 Malta
Malta Morocco
 Nepal
Nepal Netherlands
 New Zealand
 Norway
 Pakistan
 Philippines
 Poland
 Portugal
 Romania
 Singapore
 Slovakia
 Slovenia
 South Africa
 South Korea
 Spain
Spain Sweden
 Thailand
 The United States
 Turkey
 United Arab Emirates
 United Kingdom
 Vietnam
Contact Us




BIYA GLOBAL LLC is registered with the Financial Crimes Enforcement Network (FinCEN), an agency under the U.S. Department of the Treasury, as a Money Services Business (MSB), with registration number 31000218637349, and regulated by the Financial Crimes Enforcement Network (FinCEN).
BIYA GLOBAL LIMITED is a registered Financial Service Provider (FSP) in New Zealand, with registration number FSP1007221, and is also a registered member of the Financial Services Complaints Limited (FSCL), an independent dispute resolution scheme in New Zealand.