- More
- Download
Samsung’s Strong Earnings Drag Chip Stocks Lower: Are AI Expectations Already Too High?





Samsung’s strong earnings dragged chip stocks lower, but the key issue is not that AI demand suddenly disappeared. Instead, the market had already priced in very high expectations for AI memory, HBM, DRAM price increases, and hyperscaler capital expenditure. What you are seeing is a classic earnings expectation gap: strong profit growth can confirm industry momentum, but stock prices still depend on revenue quality, forward guidance, valuation levels, and investor positioning. For investors watching Samsung, SK Hynix, Micron, Nvidia, and semiconductor ETFs, this volatility is more like a stress test of crowded AI trades.
Key Takeaways
- Samsung’s profit surge confirms strong AI memory demand, but stocks trade on future growth.
- A stock can fall after strong earnings when good news has already been priced in.
- DRAM and NAND prices are still rising, but investors care whether the pace is slowing.
- AI capital expenditure has not ended, but returns and funding pressure are under review.
- A synchronized chip stock decline does not equal a cycle reversal; it may reflect valuation reset.
- Watch full earnings, cloud CAPEX, memory pricing, and earnings revisions next.
How Strong Were Samsung’s Earnings, and Why Was the Market Still Disappointed?

Samsung’s results were not weak. The real issue is that the market had already priced in much of the “AI memory supercycle” story. You need to separate two questions: whether the company’s reported profit beat analyst expectations, and whether the result was strong enough to exceed the optimism already embedded in the share price. When the second bar is higher than the first, even strong earnings can trigger selling.
Samsung Electronics’ second-quarter earnings guidance showed consolidated revenue of about KRW 171 trillion and operating profit of about KRW 89.4 trillion for the second quarter of 2026. Based on the headline figures, this was an extremely strong profit performance and clearly reflected higher memory chip prices, expanding AI server demand, and tight supply of high-bandwidth memory.
However, the stock market does not look only at year-on-year growth. Reuters reported that Samsung’s operating profit rose about 19 times from a year earlier and beat the LSEG SmartEstimate market forecast. Yet Samsung’s share price still fell, showing that investors had already shifted their focus from “whether growth exists” to “whether growth can keep beating expectations.”
| Observation | Surface Result | What the Market Cares About More |
|---|---|---|
| Operating profit | Sharp increase | Whether the beat was large enough |
| Revenue | High absolute level | Whether it reflects real shipment growth |
| Memory prices | DRAM and NAND rose | Whether the price increase is slowing |
| AI demand | Strong data center pull | Whether hyperscalers will keep spending |
| Stock reaction | Fell after earnings | Whether the good news was already priced in |
One important reason for the disappointment is that revenue, profit, and growth quality are not the same thing. Profit can be quickly lifted by price increases, but if revenue growth is not equally strong, investors may worry that earnings are being driven more by short-term supply tightness than long-term shipment expansion. Samsung has not yet released its full earnings report, so the market still needs to wait for the July 30 business-segment data to assess the specific contributions from memory, foundry, mobile, and system LSI businesses.
Summary: Samsung’s strong earnings show that AI data centers and rising memory chip prices are genuinely driving profit growth. But the share price decline shows that investors now demand more than “good profit.” When evaluating this kind of earnings event, you cannot focus only on the year-on-year growth multiple. You also need to examine revenue quality, sources of profit, full guidance, and the stock’s prior rally. Good earnings followed by a stock decline often mean expectations were too high, not that fundamentals immediately deteriorated.
Why Can a Stock Fall After Strong Earnings?

When a stock falls after strong earnings, the core mechanism is that “good” was not good enough. Once a hot sector has already rallied, investors are effectively buying several future quarters of accelerating growth, not just one strong quarter. Samsung’s impact on chip stocks reflects an expectation gap, profit-taking, and crowded positioning happening at the same time.
The first factor is that the good news had already been priced in. AI memory, HBM, server DRAM, and enterprise SSDs have become central themes in the semiconductor market. Companies such as Samsung, SK Hynix, and Micron had already been heavily traded before earnings. When earnings were released without a stronger new catalyst, investors had a reason to “sell the fact.”
The second factor is that implied expectations were higher than published expectations. Published expectations usually come from analyst earnings models. Implied expectations also include stock price gains, options pricing, ETF flows, retail sentiment, and institutional positioning. That is why a company can beat consensus estimates and still fall: the market may have expected even stronger guidance, faster revenue growth, or a longer price-upcycle.
Reuters reported that the Nasdaq moved lower as Micron and other chip stocks fell, because investors began questioning the sustainability of the AI-driven rally. In other words, Samsung was not an isolated event. It was a sentiment trigger for global AI hardware trades.
When analyzing “strong earnings followed by a sell-off,” investors can focus on:
- Whether the stock had already rallied significantly before earnings;
- Whether actual profit beat public estimates but missed implied market expectations;
- Whether revenue growth was weaker than profit growth;
- Whether management provided stronger guidance for the second half;
- Whether ETFs and quantitative funds were cutting exposure at the same time;
- Whether earnings forecasts for peers continued to move higher.
Market linkage can further amplify the volatility. Korean semiconductor stocks, U.S. memory stocks, and the Philadelphia Semiconductor Index often transmit sentiment to one another. After SK Hynix’s ADR listing in the U.S., its shares were volatile, and SK Hynix stock once fell sharply, adding pressure on Samsung, Micron, SanDisk, and Western Digital. Such declines reflect both fundamental concerns and trading-structure effects.
Summary: A stock falling after strong earnings is usually not caused by one factor alone. It is often the result of good news being priced in, implied expectations becoming too high, crowded positioning, and sector-wide linkage. You should not only ask whether Samsung’s results were strong. You should also ask whether those results were strong enough to support the current valuation. If earnings forecasts continue to rise, the sell-off may be an expectation reset. If orders, prices, and guidance weaken at the same time, then the risk is closer to a fundamental shift.
Are AI Expectations Already Too High, and How Should You Judge That?
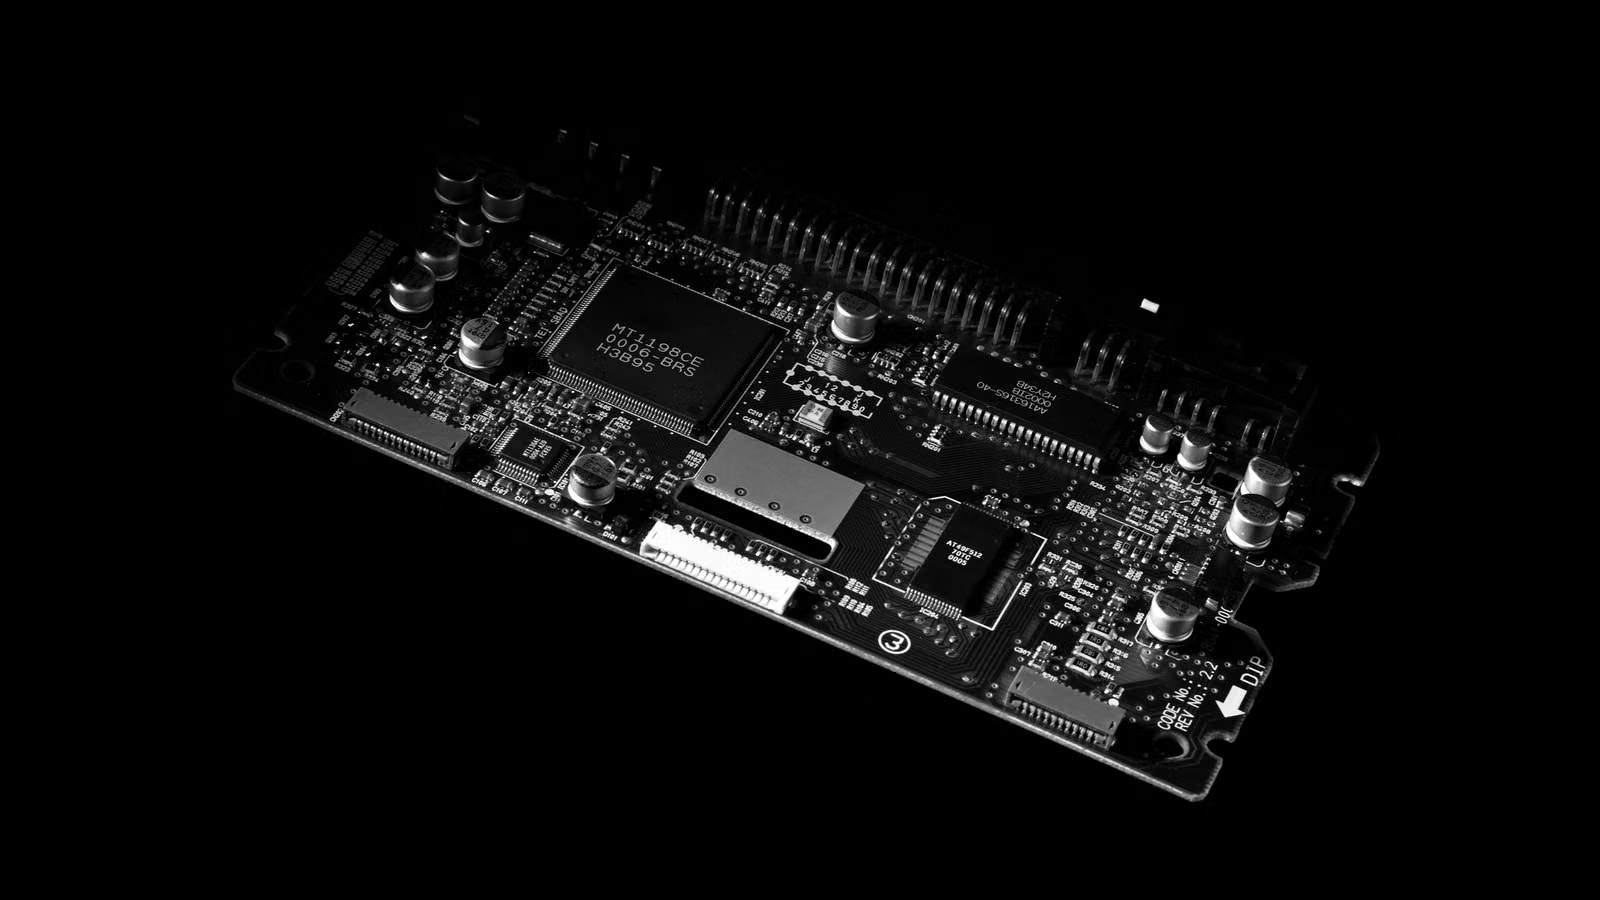
AI expectations are indeed high, but high expectations do not mean AI demand is fake. The real question is whether AI infrastructure spending can keep turning into revenue, cash flow, and compute utilization. The decline in chip stocks shows that the market has started asking “who ultimately pays for AI capital expenditure,” rather than denying the need for AI compute.
Over the past two years, the market mainly focused on whether GPUs were in shortage, whether HBM was undersupplied, and whether hyperscalers would continue building data centers. The question has now become more complex: if cloud companies keep increasing spending on servers, networking equipment, power, and memory, can AI product revenue cover depreciation, financing costs, and operating expenses? That is the core issue in judging whether AI expectations have become too high.
Reuters reported that major technology companies are using debt and equity financing to support AI and cloud infrastructure expansion, with annual spending by tech giants expected to reach very high levels. The larger the capital expenditure, the more the market will demand visible improvement in AI revenue, cloud margins, and free cash flow.
| Evaluation Dimension | Healthy Signal | Warning Signal of Excessive Expectations |
|---|---|---|
| Cloud CAPEX | Continued spending and order fulfillment | Data center delays or budget cuts |
| AI revenue | Growth keeps pace with infrastructure spending | Revenue lags depreciation pressure |
| Compute utilization | GPUs and memory stay highly utilized | Idle compute and price competition rise |
| Chip orders | Long-term contracts, production slots, stable delivery | Duplicate orders or cancellations increase |
| Free cash flow | Resilience after investment | Higher reliance on debt financing |
| Valuation | Earnings upgrades support the share price | Share price gains outpace earnings revisions |
You need to separate “AI industry growth” from “overvaluation of AI assets.” AI data center demand can be real, while some stocks may still be overvalued because of crowded short-term trading. Memory companies such as Samsung, SK Hynix, and Micron may see revenue earlier because memory is a direct hardware cost in AI servers. But memory is also cyclical by nature. Once new capacity comes online too quickly, earnings leverage can reverse.
This is also why cost structure matters when you track investments. If you are watching AI hardware exposure through U.S. stocks or semiconductor ETFs, you should consider not only stock price moves but also actual trading costs. Through Biya, you can follow U.S. and Hong Kong stock trading while checking order fees, trading rules, and market changes. Biya charges $0 commission for U.S. stock trading, while platform fees, external institution fees, and other costs are subject to the fee schedule and order page. Availability depends on the user’s location, identity verification result, platform rules, and applicable laws and regulations.
Summary: Whether AI expectations are too high cannot be judged by a single day of chip stock performance. More effective standards include whether hyperscaler capital expenditure can continue, whether AI revenue can cover depreciation and financing costs, whether compute utilization stays high, and whether chip orders are truly fulfilled. The current environment looks more like a coexistence of real AI demand and pockets of excessive valuation, rather than a single earnings event disproving the AI cycle.
Is the Memory Chip Cycle Approaching a Turning Point?
The memory cycle has not clearly reversed yet, but the market is starting to price in a possible slowdown in the pace of price increases. The apparent contradiction is this: DRAM and NAND prices are still rising, and Samsung’s profit is still being released, but the stock market has already begun worrying about high bases, new capacity, and weaker consumer electronics affordability in the coming quarters.
Memory chips should not be treated as one single category. HBM, server DRAM, traditional DRAM, and NAND are in the same broader cycle, but their demand drivers are different. HBM is more directly tied to AI accelerators. Server DRAM benefits from cloud computing and AI inference. NAND is more exposed to enterprise SSDs, data storage, and consumer electronics.
| Product Type | Main Demand Source | AI Linkage | Key Variables |
|---|---|---|---|
| HBM | GPUs and AI accelerators | Very high | Customer qualification, advanced packaging, yield |
| Server DRAM | Data center servers | High | Cloud procurement and long-term agreements |
| Traditional DRAM | PCs, smartphones, general devices | Medium | Consumer demand and price tolerance |
| NAND Flash | Enterprise SSDs and endpoint storage | Medium | Inventory, contract prices, enterprise SSD demand |
TrendForce said that in the third quarter of 2026, conventional DRAM contract prices were expected to rise 13% to 18% quarter-on-quarter, while NAND Flash contract prices were expected to rise 10% to 15%. This shows that memory pricing remains strong, but the pace of increases is already being affected by weak consumer markets and a high base.
Another important signal is long-term supply agreements. TrendForce’s memory price tracking noted that long-term agreements with U.S. cloud customers may limit some upside in pricing. Its memory pricing survey suggests server DRAM remains supported by AI servers, but price increases cannot accelerate indefinitely. For large manufacturers like Samsung, this is a double-edged sword: long-term contracts improve revenue visibility, but may also limit short-term pricing flexibility.
You also need to watch new capacity. Samsung and SK Hynix are both increasing AI-memory-related investment. Reuters reported that Samsung Group plans large-scale long-term investment in South Korea, and the KRW 1,000 trillion investment scale reflects South Korea’s ambition to capture the AI chip cycle. But the memory industry has a familiar historical risk: when all major suppliers expand at the same time and demand growth later slows, the pricing cycle can reverse quickly.
Summary: The memory chip cycle currently looks more like “prices are still rising, but the pace is slowing,” rather than a full downturn. You need to watch contract prices, shipments, inventories, long-term agreements, and new capacity at the same time. As long as AI server demand remains strong and supplier inventories stay low, memory makers still have earnings support. But if hyperscaler capital expenditure slows just as new capacity comes online, DRAM and NAND prices could move toward a clearer turning point.
What Should Investors Watch After Samsung Dragged Global Chip Stocks Lower?
After Samsung dragged global chip stocks lower, you should not rush to conclude that the AI rally is over. A more reasonable approach is to separate the sell-off into three categories: short-term profit-taking, valuation reset, and genuine fundamental weakening. Only when prices, orders, capital expenditure, and earnings forecasts all deteriorate together does the risk move from trading pressure to industry pressure.
Samsung can influence global chip stocks because it covers memory chips, smartphones, foundry services, and system chips, making it an important window into the semiconductor cycle. Its profit trends affect how investors value Micron, SK Hynix, SanDisk, Western Digital, semiconductor equipment companies, and AI server supply chains.
In the short term, you can focus on three groups of signals:
| Time Frame | Indicator | Key Question |
|---|---|---|
| Earnings verification | Samsung’s full earnings, segment profit, management guidance | Is profit mainly driven by memory price increases? |
| Industry verification | Micron, SK Hynix, TrendForce pricing data | Are orders and contract prices still improving? |
| AI return verification | Cloud CAPEX, free cash flow, AI revenue | Can AI spending generate commercial returns? |
Subsequent market reactions are also worth tracking. On July 15, SK Hynix rebounded nearly 13%, and Samsung also rose strongly, suggesting that the earlier decline included position unwinding and sentiment repair. At the same time, in June, the U.S. market had reopened discussion around memory demand after Micron’s strong results and guidance, and Micron’s rally showed that the market was not rejecting the AI memory thesis entirely.
If you follow U.S. chip stocks or semiconductor ETFs, you can use U.S. stock information search to check tickers, market data, and classifications, then combine that with earnings calendars, ETF weights, and trading volume to judge whether the move is only sector sentiment. Different ETFs have different weights in Nvidia, Broadcom, TSMC, Micron, Applied Materials, and semiconductor equipment companies, so their drawdown sources can also differ.
Trading costs also matter. U.S. stock trading costs usually include more than commission. They may also include platform fees, external institution fees, and trading activity fees. You can check Biya U.S. stock trading fees to understand the fee structure. Biya charges $0 commission for U.S. stock trading, while platform fees, external institution fees, and other costs are subject to the fee schedule and order page. The information above only introduces public market information, trading rules, and fee structures, and does not constitute investment advice.
Summary: The global chip stock sell-off triggered by Samsung is more like a stress test of AI trade crowding and valuation resilience. You need to wait for more evidence from full earnings, memory prices, cloud capital expenditure, and earnings forecast revisions. If earnings estimates continue rising while valuations fall, the correction may be a healthy reset. If orders, prices, and CAPEX weaken together, then the semiconductor cycle requires more caution.
If you are tracking Samsung’s supply chain, Micron, Nvidia, AMD, semiconductor ETFs, or Hong Kong-listed AI hardware companies, the key is not only which stock rises or falls on a given day. You also need to assess earnings expectations, valuation, trading costs, and market rules together. Biya is a global multi-asset trading wallet that supports U.S. stocks, Hong Kong stocks, and crypto trading, as well as USDT conversion into major fiat currencies such as U.S. dollars and Hong Kong dollars. If the relevant services are available in your region, you can use account registration to further check service availability, identity verification requirements, and order fees. Before trading, you should fully understand the volatility of the asset, fee structure, order types, and local regulatory requirements.
FAQ
Why Did Chip Stocks Fall After Samsung’s Strong Earnings?
Chip stocks fell after Samsung’s strong earnings mainly because the market had already priced in very high expectations for AI memory. Stock prices respond to whether results exceed implied expectations, not only whether profits grow year over year. If revenue quality, forward guidance, or the pace of price increases falls short of the most optimistic assumptions, stocks can still decline.
Does Samsung’s Share Price Drop Mean AI Chip Demand Has Peaked?
Samsung’s share price drop alone does not prove that AI chip demand has peaked. A one-day decline may come from profit-taking, valuation correction, ETF selling, and weaker market sentiment. A more reliable judgment requires cloud CAPEX, HBM orders, DRAM contract prices, NAND inventories, and management guidance.
How Can Retail Investors Judge Whether AI Expectations Are Too High?
Retail investors can focus on four dimensions: whether AI capital expenditure keeps growing, whether AI revenue can cover depreciation pressure, whether chip orders are truly fulfilled, and whether earnings forecasts for related stocks keep rising. If share prices rise much faster than earnings upgrades while free cash flow comes under pressure, expectation risk increases.
What Do DRAM and NAND Price Increases Mean for Samsung’s Profit?
DRAM and NAND price increases usually improve Samsung’s memory business margins, but they do not guarantee a higher share price. The market also looks at whether price increases are sustainable, whether shipment volume is growing, whether customers can tolerate higher prices, and whether new capacity may later create oversupply.
Are Semiconductor ETFs Suitable for Tracking AI Chip Themes?
Semiconductor ETFs can help investors track the AI chip supply chain with more diversification, but they cannot eliminate industry-cycle risk or valuation drawdown risk. Different ETFs have very different holdings. Some lean toward GPUs and AI accelerators, while others focus on equipment, foundry, or memory. Before trading, investors should review holdings, expense ratios, liquidity, and local trading rules.
What Costs Should Investors Watch When Trading U.S. Chip Stocks?
When trading U.S. chip stocks, investors should pay attention to commission, platform fees, external institution fees, trading activity fees, foreign exchange costs, and slippage. Fee structures differ across platforms, and actual costs should be based on platform rules, order pages, and account statements. In volatile markets, investors should also be cautious when using market orders and leveraged products.
*This article is provided for general information purposes and does not constitute legal, tax or other professional advice from BiyaPay or its subsidiaries and its affiliates, and it is not intended as a substitute for obtaining advice from a financial advisor or any other professional.
We make no representations, warranties or warranties, express or implied, as to the accuracy, completeness or timeliness of the contents of this publication.
Related Blogs of

ASML Q2 2026 Earnings Analysis: What Signals Did Orders, EUV Demand, and Full-Year Guidance Release?


Is ASML’s Valuation Overextended After Earnings? Backlog and 2026 Guidance Risks


Where Will IBM Stock Go After Q2 Earnings? Three Scenarios Based on Revenue, Red Hat, and Free Cash Flow


JPM, BAC, GS, MS, and Citi: Which Bank Stock Is More Worth Buying? A Comparison of Valuation, Dividends, and Business Structure

Choose Country or Region to Read Local Blog
 Australia
 Austria
 Belgium
 Canada
 Cyprus
 Czech Republic
 Denmark
 Estonia
 Finland
 France
 Germany
 Greece
 Hong Kong
 India
India Indonesia
 Ireland
 Italy
Italy Japan
Japan Latvia
 Lithuania
 Luxembourg
 Malaysia
 Malta
Malta Morocco
 Nepal
Nepal Netherlands
 New Zealand
 Norway
 Pakistan
 Philippines
 Poland
 Portugal
 Romania
 Singapore
 Slovakia
 Slovenia
 South Africa
 South Korea
 Spain
Spain Sweden
 Thailand
 United States
 Turkey
 United Arab Emirates
 United Kingdom
 Vietnam
Contact Us



