How Much Longer Can HBM Keep Rising? A Cycle View from Supply, Pricing, and AI GPU Demand





HBM demand still has strong support in 2026, but “HBM market growth,” “HBM price increases,” and “HBM-related stock gains” are not the same thing. AI GPUs, cloud providers’ in-house ASICs, long-context inference, and the HBM4 transition will continue to support demand. The real risk window is more likely to emerge after 2027, when new capacity, contract pricing, inventory, and AI capex may begin to diverge. To judge the HBM cycle, you need to track supply, pricing, customer qualification, and market expectations—not just headline AI demand.
Key Takeaways
- HBM demand remains strong, but the industry has moved from broad shortage to structural divergence.
- Supply bottlenecks are not limited to wafers; yield, stacking, packaging, and qualification also matter.
- AI GPUs remain the base demand driver, while cloud ASICs are becoming a key incremental source.
- HBM4 can expand the market, but it may also normalize pricing for mature products.
- 2027 is the key window for watching capacity release, inventory, and AI capex mismatch.
Where Is HBM in the Current Cycle?
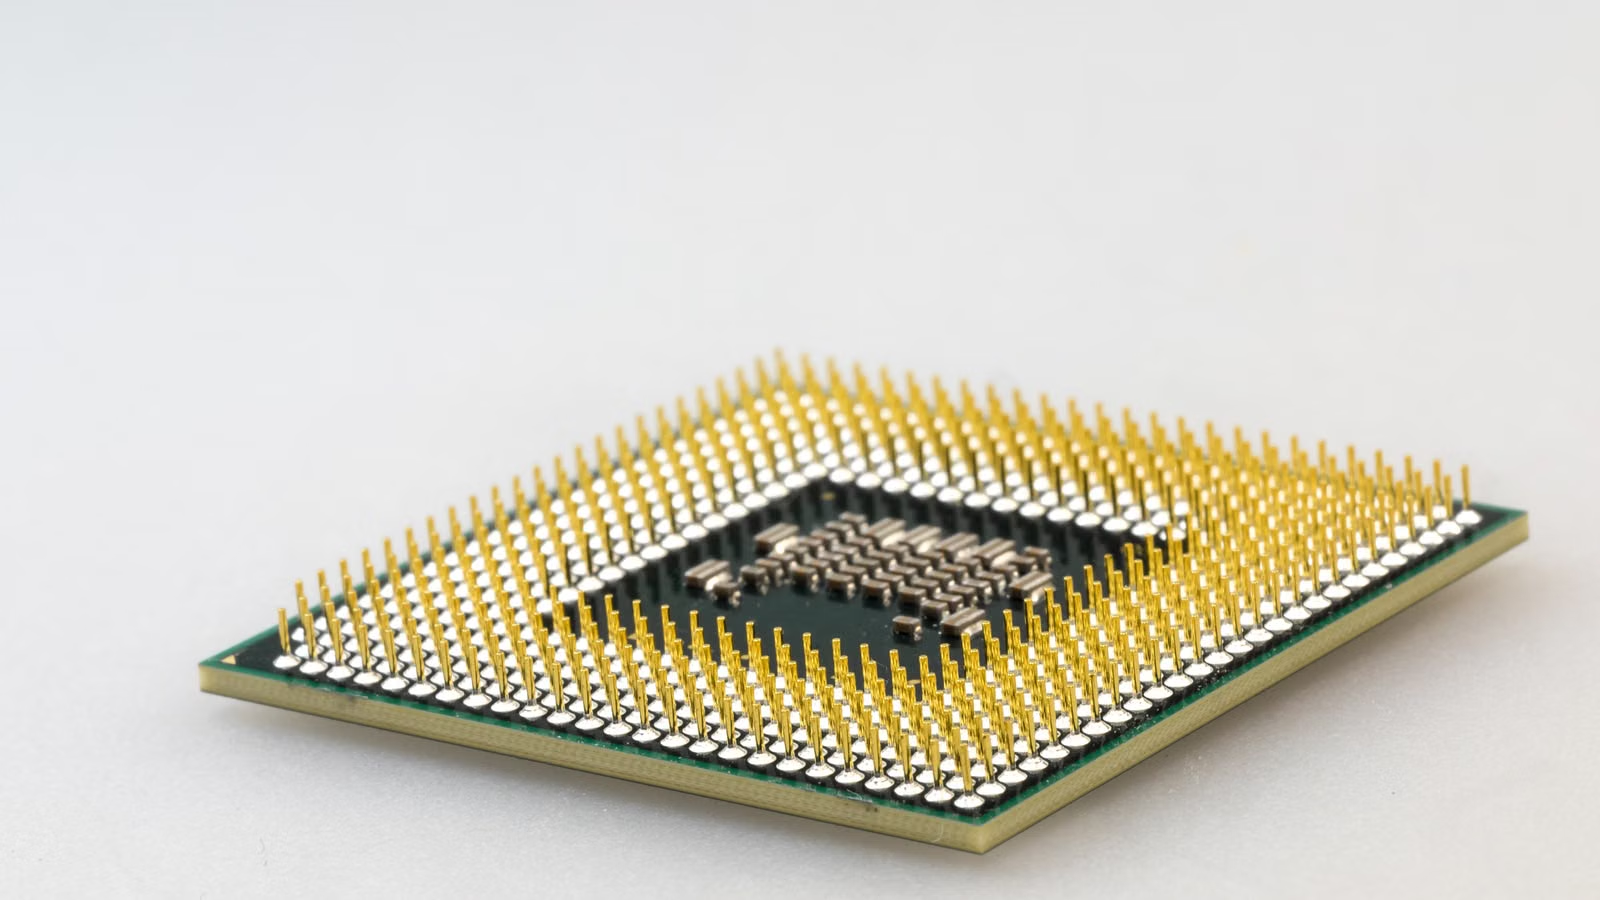
As of mid-2026, HBM is still in a phase of demand expansion and tight high-end capacity, but it is no longer in the early stage where every product, every supplier, and every price point rises together. A more accurate view is this: AI demand is still growing, HBM4 still carries a premium, but mature HBM3E, supplier share, and stock valuations are starting to diverge. You should separate demand, pricing, profit, and stock performance.
“How much longer can HBM keep rising?” actually contains three separate questions. The first is how long demand can keep growing, which depends on how much additional HBM is needed by AI GPUs, AI ASICs, and inference servers. The second is how long unit prices can keep rising, which depends on long-term contracts, supply gaps, yield, and product generations. The third is how long HBM-related stocks can keep rising, which depends on whether earnings growth can exceed already elevated market expectations.
| Cycle Stage | Demand Feature | Supply Feature | Pricing Behavior | Investment Focus |
|---|---|---|---|---|
| Introduction | AI GPUs begin adopting HBM | Qualified suppliers are limited | Product premium rises quickly | Technology qualification |
| Shortage | GPU shipments and capacity per chip rise together | Capacity is locked in advance | Contract prices are strong | Orders and share |
| Expansion | GPUs and ASICs grow together | Suppliers expand aggressively | Pricing begins to diverge | Yield and margins |
| Balance | Demand still grows but slows | New capacity gradually releases | ASP normalizes | Inventory and cash flow |
| Downturn | Customers delay procurement | Supply exceeds short-term demand | Prices and profits decline | Capex cuts |
2026 looks more like an expansion phase than a confirmed downturn. AI data center demand remains strong, HBM4 is being introduced, and cloud providers’ in-house ASICs are creating new sources of procurement. At the same time, pricing signals are no longer one-way. Some market research suggests that as more suppliers increase HBM bit output, mature HBM products may face repricing pressure, while high-end HBM4, customized HBM, and customer-locked capacity may still hold premiums. Discussions around HBM price adjustment risk in 2026 show that the market is shifting from a shortage narrative to a divergence narrative.
To judge where the cycle stands, focus on six groups of data:
- Whether HBM bit demand continues to grow faster than ordinary DRAM.
- How the product mix shifts between HBM3E and HBM4.
- Same-generation contract pricing, not just blended ASP.
- Customer prepayments, long-term orders, and locked capacity.
- Inventory days, lead times, and customer pull-in behavior.
- Capex, depreciation, and free cash flow.
Market growth does not automatically mean stock prices will keep rising. Stocks usually discount one to several years of future orders and profits in advance, especially for memory leaders such as SK Hynix, Micron, and Samsung. Even if HBM industry revenue keeps growing, share prices can still correct if pricing growth slows, gross margins miss expectations, or capex becomes too heavy. Conversely, some challengers may gain more upside if share recovery beats expectations, even while the broader industry’s pricing momentum slows.
Summary: HBM is still in an expansion cycle, but it is no longer in the simple early phase where demand, pricing, profit, and valuation rise together. The key characteristics of 2026 are strong demand, tight supply, pricing divergence, and higher market expectations. When assessing how much longer HBM can rise, do not look only at AI demand or supplier expansion announcements. A better approach is to track demand, same-generation pricing, product mix, inventory, capex, and free cash flow together. Demand may peak last, pricing may peak earlier, and stock valuations may move even earlier.
Why Is HBM Supply Difficult to Increase Quickly, and When Will New Capacity Arrive?

HBM supply cannot increase quickly because expansion is not just about producing more DRAM wafers. HBM also involves TSVs, wafer thinning, stacking, bonding, testing, base logic dies, advanced packaging, and customer qualification. In 2026, all three major suppliers are increasing investment, but much of the new capacity may not become effective supply until 2027 or later. High-end shortages will not disappear just because suppliers announce expansion plans.
HBM expansion is more complex than ordinary DRAM expansion, first because it consumes more wafer resources. For the same bit capacity, HBM often uses more advanced DRAM resources and can displace part of ordinary server DRAM capacity. Second, 8-high, 12-high, and even higher stacks require stricter wafer thinning, bonding precision, thermal management, and testing. A qualified single DRAM die does not guarantee a qualified HBM stack. As stack height increases, yield loss can be magnified.
| Supply Link | Main Bottleneck | Expansion Cycle | Impact on Pricing |
|---|---|---|---|
| DRAM wafers | Advanced nodes and wafer area | Medium to long term | Determines base supply |
| TSV and stacking | Stack height, bonding precision, yield | Medium term | Affects effective output |
| Base logic die | Process and customer customization | Medium term | Raises HBM4 barriers |
| Advanced packaging | Interposers, testing, thermal design | Medium term | Limits system delivery |
| Customer qualification | GPU and ASIC platform validation | Several quarters | Delays revenue recognition |
| New fabs | Equipment, talent, ramp-up | Several years | Affects post-2027 supply |
The three major suppliers are expanding in different ways. SK Hynix is increasing capacity through its existing HBM leadership and Korean manufacturing base. Its management still believes 2027 could bring an even more severe memory shortage because AI demand is growing faster than effective capacity formation. SK Hynix CEO Kwak Noh-jung’s view on a possible 2027 memory supply gap reflects a supplier-side optimistic demand outlook.
Samsung’s priority is HBM4 share recovery. The company announced commercial shipments of HBM4 and said its 2026 HBM sales were expected to grow more than threefold from 2025. Samsung’s advantage lies in its broader resources across DRAM, logic chips, foundry, and packaging. Whether it truly improves industry supply still depends on customer qualification, production yield, and long-term orders.
Micron is expanding AI memory exposure through HBM and advanced DRAM investment. The company has announced that its 36GB 12-high HBM4, designed for NVIDIA’s Vera Rubin platform, has entered high-volume production. It is also increasing U.S. manufacturing investment. Reuters reported that Micron’s U.S. investment program has increased to more than $250 billion by 2035. This may strengthen long-term supply resilience, but it will not immediately remove high-end HBM tightness.
Supply easing requires five confirmation signals:
- Lead times from major suppliers shorten for several consecutive quarters.
- Customers stop locking in multi-year capacity in advance.
- HBM4 yields quickly approach mature HBM3E levels.
- Inventory grows faster than actual shipments.
- Additional HBM capacity no longer clearly squeezes ordinary DRAM supply.
HBM4 may also create new bottlenecks. Its interface, base logic die, and customer customization requirements are higher, and early-stage yields are usually not as stable as mature products. In other words, 2026–2027 may show a dual structure: HBM3E gradually loosens, while HBM4 remains tight. The supply inflection point will not be determined by total nameplate capacity, but by usable capacity, qualified capacity, and customer-accepted capacity.
Summary: HBM supply will not loosen immediately just because suppliers announce expansion. Investment in 2026 mainly addresses future demand, and the capacity that truly affects supply-demand balance is more likely to arrive gradually from 2027 onward. To judge the supply turning point, do not focus only on fab investment amounts, equipment purchases, or headlines. Watch yield, customer qualification, lead times, and inventory. As long as effective HBM4 output remains limited, customers continue locking capacity in advance, and high-end packaging stays tight, the industry remains structurally constrained.
What Determines HBM Pricing, and When Might Prices Peak?
HBM pricing is determined by the supply-demand gap, product generation, long-term contracts, yield, and supplier competition. In 2026, total HBM revenue may still grow, but unit prices for some mature products may already be normalizing. Pricing usually peaks before demand peaks, because customers lock prices in advance, suppliers compete for share before new capacity comes online, and the stock market often trades this change even earlier.
Long-term contracts are central to HBM pricing. Large GPU, ASIC, and cloud customers typically secure capacity in advance and negotiate pricing, delivery schedules, and product specifications with memory suppliers. This improves revenue visibility for suppliers and reduces the risk that customers cannot secure supply during shortages. The problem is that long-term contracts can also hide a pricing inflection point. Contract prices do not move daily like spot prices, so weakness may not appear until a new negotiation round.
| Pricing Support | Pricing Pressure |
|---|---|
| GPU and ASIC shipments exceed expectations | New capacity releases at the same time |
| HBM capacity per chip increases | HBM3E supplier competition intensifies |
| HBM4 yield improves slowly | Customers expand multi-supplier sourcing |
| Long-term orders lock capacity | Long-term contracts are renegotiated |
| Advanced packaging remains tight | AI capex growth slows |
| New product mix keeps rising | Inventory and lead times weaken |
Ordinary DRAM price increases should not be confused with HBM pricing. HBM expansion consumes advanced DRAM wafers, which may squeeze ordinary server DRAM supply and push up ordinary DRAM prices. At the same time, mature HBM3E may experience slower pricing momentum as more suppliers enter and customer bargaining power improves. TrendForce’s HBM Industry Analysis 2Q26 places CSP and ASIC demand, SK Hynix leadership, Samsung recovery, and Micron’s TSV capacity expansion in the same framework, showing that the HBM market has entered a more segmented competitive stage.
To monitor the pricing cycle, focus on these indicators:
- Same-generation HBM contract pricing, not only blended ASP.
- Revenue mix between HBM3E and HBM4.
- Price per GB and memory value per AI accelerator.
- Customer prepayments and minimum purchase commitments.
- Supplier quarterly gross margins.
- Packaging, testing, and base logic die costs.
- Inventory write-downs or pricing adjustments.
- The price gap between ordinary DRAM and HBM.
Product mix can easily create the illusion that prices are still rising. For example, same-generation HBM3E prices may be falling, but if more expensive HBM4 accounts for a higher share, a supplier’s total HBM revenue and blended ASP can still rise. Investors need to distinguish between two things: genuine same-generation price increases and blended pricing improvement from product upgrades. The first reflects tighter supply-demand conditions; the second may simply reflect mix improvement.
SK Hynix, Samsung, and Micron all want to defend premiums through more advanced products, but customers are also pushing multi-supplier procurement. Multi-sourcing will not immediately collapse pricing, but it does change the negotiation structure. When NVIDIA, AMD, and cloud ASIC customers can source HBM4 from two or three qualified suppliers, mature product pricing is more likely to move toward cost and yield economics.
Summary: HBM pricing may peak while demand is still growing. In 2026, a more likely structure is that HBM4 maintains a high premium while mature HBM3E gradually normalizes, rather than all HBM products rising or falling together. To assess pricing, do not look only at industry revenue or company blended ASP. Same-generation contract prices, product mix, customer bargaining power, inventory, and gross margin matter more. When pricing begins to diverge, the cycle has shifted from shortage-driven upside to execution and share competition.
How Much HBM Growth Can AI GPUs, AI ASICs, and Inference Still Support?
AI GPUs remain the largest source of HBM demand, but in 2026 the more important incremental growth comes from cloud providers’ in-house ASICs and inference servers. NVIDIA Rubin uses HBM4 and continues to support high-end demand. At the same time, Google, Amazon, Meta, Microsoft, and other cloud providers are increasing deployment of in-house AI chips, expanding HBM demand from a single GPU supply chain into a multi-platform market. Demand can still grow, but not infinitely.
NVIDIA Rubin is a central anchor for 2026–2027 HBM demand. NVIDIA’s discussion of the Vera Rubin platform emphasizes a multi-chip, rack-scale design for AI factories. Rubin uses HBM4, pushing memory suppliers into another round of customer qualification and share competition. However, GPU announcement, memory qualification, server mass production, and cloud deployment do not happen at the same time. A product announcement should not be treated as immediate HBM revenue.
| Link | Key Variable | Impact on HBM |
|---|---|---|
| GPU launch | Product specifications and timing | Determines HBM generation |
| Customer qualification | Yield, power, and stability | Determines supplier share |
| GPU production | Wafer and packaging capacity | Determines actual procurement |
| Server delivery | Networking, power, and rack construction | Determines demand timing |
| Cloud deployment | Utilization and customer demand | Determines follow-on orders |
AI ASICs are the second growth curve. Cloud providers do not design their own chips to fully replace NVIDIA GPUs. They do it to reduce costs and gain supply-chain control for specific training, inference, or internal workloads. ASIC HBM configurations are customized according to model requirements, networking needs, inference throughput, and cost targets. Some industry forecasts suggest that ASIC-driven HBM demand may grow much faster than GPU-side demand in 2026, creating more share recovery opportunities for Samsung and Micron.
Inference demand will also support HBM, but it will not raise HBM consumption without limit. Long-context models, multimodal workloads, video generation, and agent systems increase KV cache capacity and bandwidth needs. Large-scale real-time inference is also more likely to be constrained by memory bandwidth. On the other hand, quantization, cache compression, tiered memory, and specialized inference architectures can reduce HBM required per task. NVIDIA’s Rubin CPX targets ultra-long-context inference and emphasizes video and long-context processing capability, showing that inference is becoming a new hardware battleground, but not every task requires the same HBM configuration.
For AI demand to keep supporting HBM, six conditions matter:
- AI GPU shipment volume continues to grow.
- Cloud providers deploy in-house ASICs as planned.
- HBM capacity per chip keeps increasing.
- Long-context and real-time inference demand expands.
- Model-efficiency improvements do not fully offset usage growth.
- Data center power, networking, and rack construction do not become stronger bottlenecks.
SK Hynix’s 2026 HBM market outlook emphasizes that AI memory demand is driven not only by HBM, but also by server DRAM and enterprise storage. That view is reasonable. From an investment perspective, however, you still need to verify whether customers are turning capex into real deployments, not just announcing budgets. Power, networking, cooling, and depreciation costs at AI data centers will all affect future procurement pace.
Summary: AI GPUs remain the foundation of the HBM cycle, while ASICs and inference determine whether growth can continue beyond 2027. NVIDIA Rubin supports HBM4 demand, but cloud providers’ in-house ASICs may become a faster incremental driver. Inference workloads increase memory bandwidth and capacity requirements, but model-efficiency gains, tiered memory, and cost constraints can reduce HBM per task. The key is not whether model parameters keep getting larger, but how many chips are actually deployed, how much HBM each chip carries, server utilization, and customer capex returns.
How Much Longer Can HBM Rise? Three Cycle Scenarios to Watch
In the base case, HBM demand and industry revenue still have room to rise in 2026, while 2027 becomes the key year for determining whether supply and demand move toward balance. Pricing may weaken before demand does, and related stocks may move before product pricing adjusts. You do not need to predict one single peak date. A better approach is scenario analysis: where are demand, supply, pricing, inventory, and valuation in the cycle?
| Scenario | Demand | Supply | Pricing and Profit | Key Signal |
|---|---|---|---|---|
| Bullish | GPU, ASIC, and inference demand keep beating expectations | Expansion still lags demand | HBM4 keeps a high premium | Cloud capex keeps rising |
| Base | Demand grows but growth slows | Supply gradually releases in 2027 | Revenue grows, unit pricing normalizes | Inventory and contract repricing |
| Cautious | AI deployment is delayed or utilization is weak | New capacity comes online together | Prices and margins decline together | Customers cut orders |
In the bullish scenario, AI GPU and ASIC demand both exceed expectations, HBM4 yield improves slowly, and tight supply lasts into 2028. This is most favorable to SK Hynix, while also supporting Samsung and Micron revenue expansion. In the base scenario, 2026 remains strong, supply increases in 2027, demand still grows, but pricing normalizes; suppliers’ revenue continues to grow, while margin growth slows. In the cautious scenario, cloud AI capex slows, new capacity comes online at the same time, and inventory and depreciation pressure rise.
A quarterly HBM cycle dashboard can include:
- NVIDIA, AMD, and AI ASIC shipment guidance.
- Cloud AI capex and depreciation changes.
- HBM capacity per chip.
- HBM4 customer qualification and actual revenue.
- Same-generation HBM contract pricing.
- Capex and capacity from the three major suppliers.
- Inventory days and lead times.
- Gross margin, free cash flow, and market expectations.
Cycle changes affect companies differently. SK Hynix is the most sensitive to HBM strength. If supply remains tight, its profit leverage is the most direct. But if the market has already priced in high share and high gross margins, valuation may also be more volatile. Samsung’s key variable is HBM4 share recovery. If it succeeds, earnings upside could be meaningful, but smartphones, displays, and foundry operations will dilute HBM’s stock impact. Micron combines HBM and ordinary DRAM cycle exposure. Its U.S.-listed structure is more direct for many investors, but high capex and lower market share can also amplify volatility.
Trading costs also matter. HBM-related names often move sharply around earnings, customer qualification, product launches, and AI capex guidance. When trading in batches, you should not look only at price moves. U.S. stock trading costs may include commissions, platform fees, external institutional fees, transaction activity fees, and other charges shown on the order page. If your region and account status meet the relevant service rules, you can review Biya U.S. stock trading fees. Biya charges $0 commission for U.S. stock trading, while platform fees, external institutional fees, and other charges are subject to the fee schedule and order page.
Summary: How much longer HBM can rise depends on whether you are looking at demand, pricing, profit, or stocks. Demand still has support in 2026. Pricing has already entered a phase of structural divergence. 2027 is the key window for judging whether supply release can match demand growth. Industry revenue, unit pricing, supplier profits, and stock valuations will not peak at the same time. Use orders, same-generation pricing, inventory, capex, cash flow, and valuation together to confirm the cycle rather than relying only on supplier or customer comments.
If you plan to keep tracking HBM and the AI memory theme, place Micron, SK Hynix ADRs, Samsung, NVIDIA, AMD, semiconductor equipment makers, and advanced packaging companies in the same framework. When following related names through U.S. stock information, you can compare prices, earnings dates, valuations, and market expectations together. A global multi-asset trading wallet such as Biya can also help you manage U.S. stock, Hong Kong stock, and digital asset watchlists, turning a hot theme from news-driven excitement into quarterly evidence tracking. You can also use Download App to record watchlists and trading costs. The information above discusses public market data, trading rules, and fee structures only, and does not constitute investment advice. Service availability depends on user location, identity verification, platform rules, and applicable laws and regulations.
FAQ
Why Can HBM Product Prices Fall While the HBM Market Is Growing?
HBM market size can grow while unit prices decline. This happens when shipment volume rises, product mix upgrades, and mature-product pricing normalizes at the same time. You should distinguish total revenue, blended ASP, and same-generation contract pricing rather than using market size alone to judge the pricing cycle.
Does HBM4 Mass Production Mean the Supply Shortage Is Ending?
Not necessarily. HBM4 mass production only shows that a supplier has production capability. Whether the shortage eases depends on yield, customer qualification, advanced packaging, and actual delivery. Supply can be considered loosening only when effective output rises, lead times shorten, and inventory improves at the same time.
Can AI ASIC Growth Reduce HBM Dependence on NVIDIA GPUs?
Yes, it can reduce dependence on a single platform, but it cannot fully replace GPU demand. AI ASICs broaden the HBM customer base and may change the share structure among Samsung, SK Hynix, and Micron. The key indicators are actual deployment volume, HBM capacity per chip, and cloud capex.
How Are Ordinary DRAM Price Increases Related to the HBM Cycle?
Ordinary DRAM and HBM share some wafer resources, but their pricing cycles are not fully synchronized. HBM expansion may squeeze ordinary DRAM supply and push ordinary DRAM prices higher. At the same time, mature HBM products may normalize in price as competition intensifies.
Why Can Memory Stocks Fall While the HBM Industry Is Still Growing?
Memory stocks trade future expectations, not only current industry growth. If the market has already priced in high growth, stock prices can fall when pricing normalizes, capex is too high, margins miss expectations, or inventory rises. Investors should assess valuation and personal risk tolerance before making decisions.
Which Indicators Should Retail Investors Watch for an HBM Cycle Turning Point?
Retail investors should prioritize five indicators: orders, same-generation pricing, inventory, effective capacity, and AI chip shipments. Capex, gross margin, and free cash flow are also important. A single technology announcement, market-share figure, or customer rumor is not enough to confirm an HBM cycle turning point.
*This article is provided for general information purposes and does not constitute legal, tax or other professional advice from BiyaPay or its subsidiaries and its affiliates, and it is not intended as a substitute for obtaining advice from a financial advisor or any other professional.
We make no representations, warranties or warranties, express or implied, as to the accuracy, completeness or timeliness of the contents of this publication.
Related Blogs of

HBM Investment Theme: Samsung, SK Hynix, or Micron—Which One Deserves the Most Attention?


Why Does the AI Data Explosion Also Benefit HDDs? Cold Data, Nearline HDDs, and Cloud Storage Demand


Will NAND Prices Keep Rising? Enterprise SSD Demand and the Memory Cycle


What Is HBM? Why AI Servers Depend on High-Bandwidth Memory
Choose Country or Region to Read Local Blog
 Australia
 Austria
 Belgium
 Canada
 Cyprus
 Czech Republic
 Denmark
 Estonia
 Finland
 France
 Germany
 Greece
 Hong Kong
 India
India Indonesia
 Ireland
 Italy
Italy Japan
Japan Latvia
 Lithuania
 Luxembourg
 Malaysia
 Malta
Malta Morocco
 Nepal
Nepal Netherlands
 New Zealand
 Norway
 Pakistan
 Philippines
 Poland
 Portugal
 Romania
 Singapore
 Slovakia
 Slovenia
 South Africa
 South Korea
 Spain
Spain Sweden
 Thailand
 The United States
 Turkey
 United Arab Emirates
 United Kingdom
 Vietnam
Contact Us




BIYA GLOBAL LLC is registered with the Financial Crimes Enforcement Network (FinCEN), an agency under the U.S. Department of the Treasury, as a Money Services Business (MSB), with registration number 31000218637349, and regulated by the Financial Crimes Enforcement Network (FinCEN).
BIYA GLOBAL LIMITED is a registered Financial Service Provider (FSP) in New Zealand, with registration number FSP1007221, and is also a registered member of the Financial Services Complaints Limited (FSCL), an independent dispute resolution scheme in New Zealand.