What Is AI CAPEX, and Why Does It Determine Technology Stock Valuations in 2026?




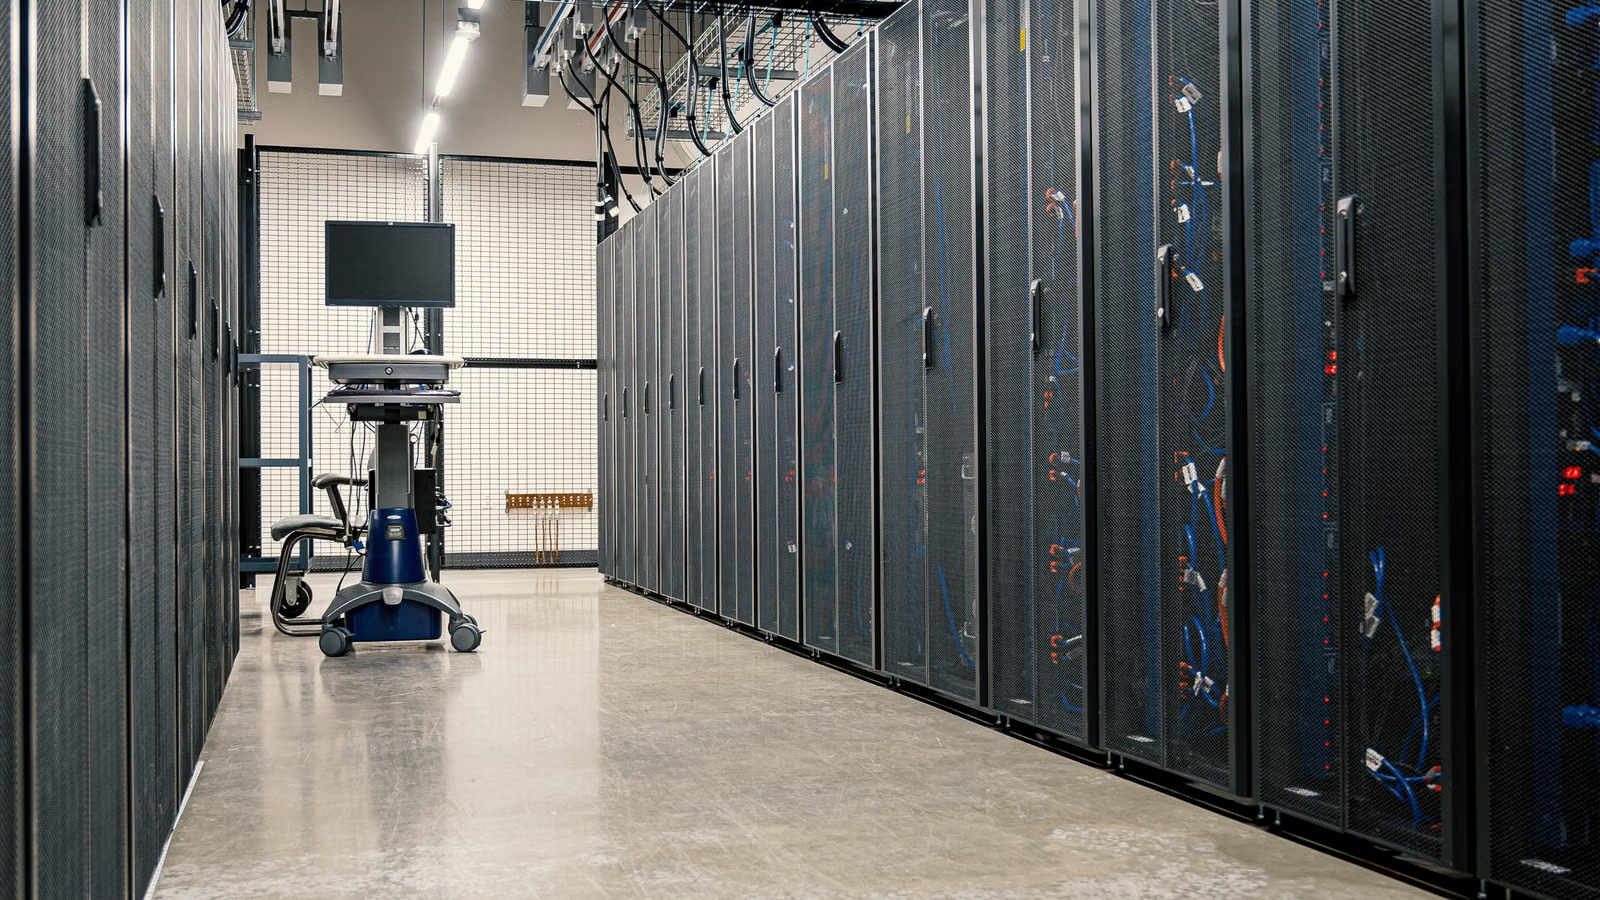
AI CAPEX is the capital expenditure companies use to obtain future AI computing capacity, including GPUs, servers, networking equipment, storage, data centers, electricity infrastructure, and cooling systems. It has become a decisive factor in technology stock valuations in 2026 because investors are no longer satisfied with hearing that a company is “investing in AI.” They now expect that investment to generate cloud revenue, advertising efficiency, enterprise orders, profits, and free cash flow. High CAPEX can create long-term competitive barriers, but it can also introduce depreciation, financing, and excess-capacity risks.
Key Takeaways
- AI CAPEX is a long-term investment in future computing capacity.
- Capital expenditure consumes cash first and affects profits gradually through depreciation.
- In 2026, investors are increasingly testing returns on AI infrastructure spending.
- Higher cloud spending transmits demand to chips, storage, and equipment suppliers.
- High CAPEX supports premium valuations only when it produces revenue and cash flow.
- Utilization, margins, and returns on capital must be analyzed together.
What Is AI CAPEX, and How Is It Different From Ordinary CAPEX and OPEX?
AI CAPEX is the capital expenditure used to build, acquire, or expand long-term AI infrastructure. When GPUs, servers, data centers, or networking equipment are expected to remain in use for several accounting periods, companies generally record the spending as an asset and recognize the cost gradually through depreciation. Electricity, labor, maintenance, and software subscriptions are closer to OPEX and affect current-period profits more quickly.
AI CAPEX is not usually reported as a separate accounting line item. You will generally find it within “purchases of property and equipment,” “capital expenditures,” or a similar item in the cash flow statement, then use management commentary to estimate how much relates to AI. The U.S. Securities and Exchange Commission’s guide to financial statements explains how the balance sheet, income statement, and cash flow statement work together, which is essential for understanding CAPEX.
What Does AI CAPEX Usually Include?
- Nvidia and AMD GPUs and other AI accelerators;
- Custom ASICs, CPUs, and supporting servers;
- HBM, DRAM, enterprise SSDs, and capacity storage;
- Ethernet, InfiniBand, optical modules, and switches;
- Data center land, buildings, racks, and cabling;
- Electrical substations, backup power, liquid cooling, and air-conditioning systems;
- Long-term finance leases and certain construction-in-progress assets.
Disclosure methods differ across companies. Meta includes finance lease principal repayments in its capital expenditure guidance, while other companies may focus mainly on cash purchases of property and equipment. Direct comparisons can therefore be misleading unless leases, buildings, and server purchases are measured consistently.
| Comparison | AI CAPEX | AI OPEX |
|---|---|---|
| Main purpose | Build long-term compute capacity and infrastructure | Maintain daily operations |
| Typical items | GPUs, servers, buildings, networking equipment | Electricity, labor, maintenance, cloud rentals |
| Income statement impact | Recognized gradually through depreciation | Usually recognized in the current period |
| Cash flow classification | Mainly investing cash flow | Mainly operating cash flow |
| Valuation focus | Utilization, useful life, and return on capital | Cost control and operating leverage |
Suppose a company spends $10 billion on AI servers. Cash may leave the business during the purchasing period, but the income statement will not immediately record the full $10 billion as an expense. If the equipment is depreciated over five years with no residual value, the company may recognize approximately $2 billion of depreciation each year. Net income can therefore continue growing even while free cash flow has already fallen substantially.
It is also important to distinguish between buying compute capacity and renting it. When a company purchases GPUs for long-term use, the spending is generally closer to CAPEX. Paying a third-party cloud provider based on usage is generally closer to OPEX. Buying hardware creates utilization and obsolescence risk, while renting reduces upfront cash pressure but may not provide a lower long-term unit cost.
Summary: AI CAPEX is essentially the use of current cash to purchase future computing capacity. Unlike wages or electricity costs, it does not immediately flow through the income statement in full. It first becomes a fixed asset and then affects profit gradually through depreciation. When analyzing technology companies, you should examine cash capital expenditure, finance leases, asset useful lives, and depreciation policies rather than relying on one headline spending figure.
Why Has AI CAPEX Become a Core Technology Stock Valuation Variable in 2026?
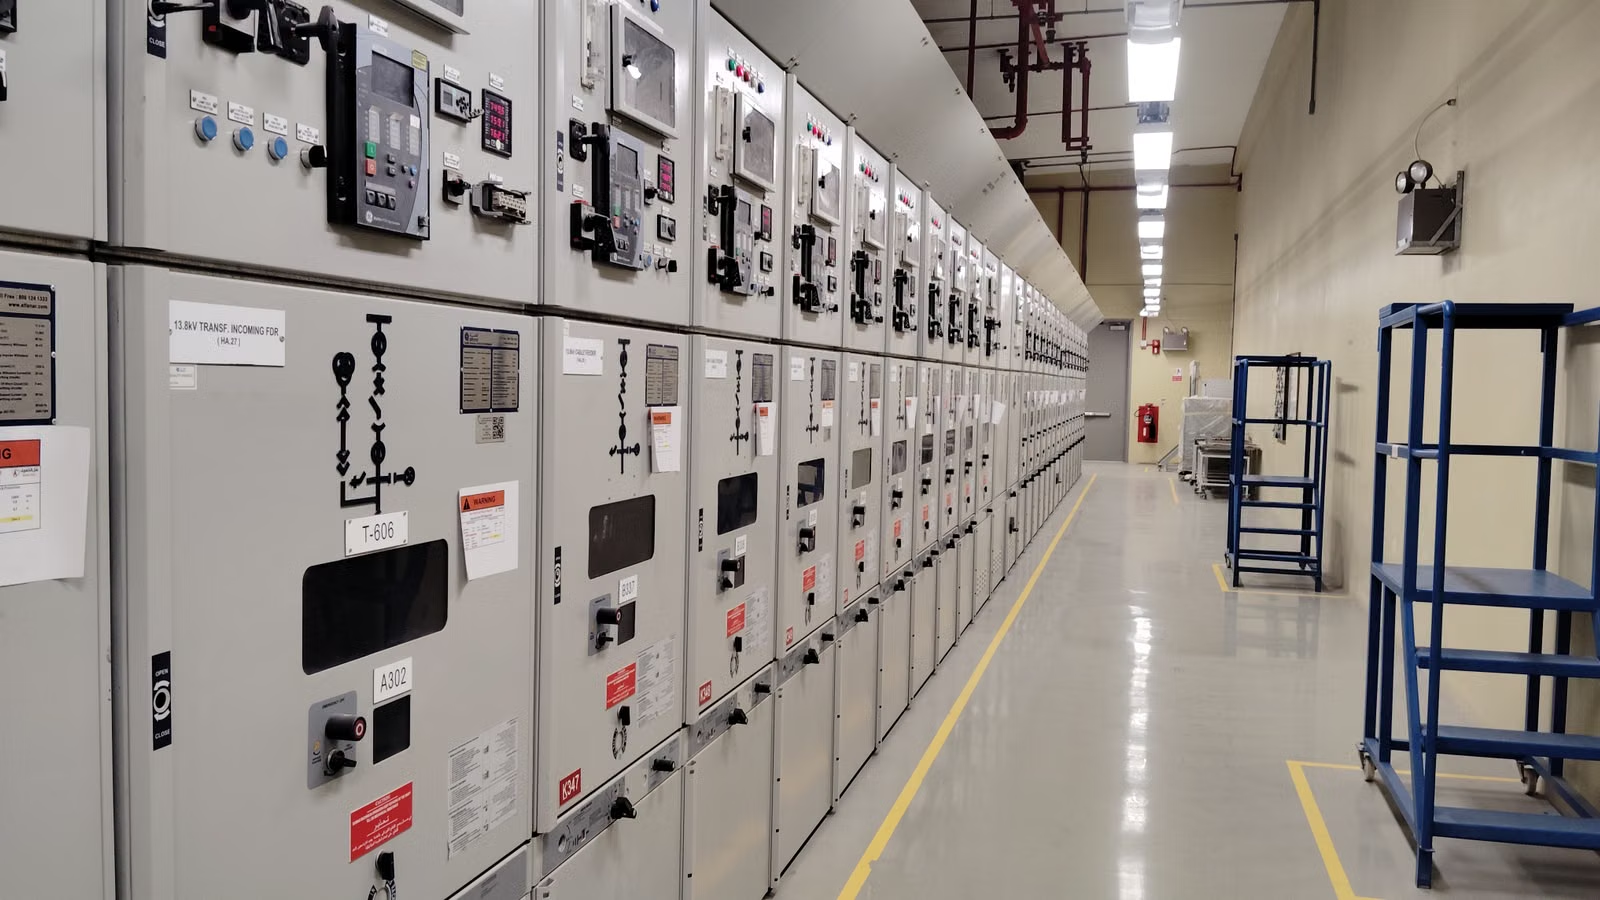
AI CAPEX has become a core valuation variable in 2026 because the scale of investment is now large enough to change the cash flow, margins, and financing structures of major technology companies. Between 2023 and 2025, investors mainly focused on whether companies could obtain GPUs and develop competitive AI models. In 2026, the key questions are whether the new compute capacity is being used, whether AI revenue can catch up with capital spending, and how long it will take for the investment to generate an adequate return.
The budgets announced by hyperscale cloud companies show that these are no longer experimental projects.
| Company | 2026 Capital Expenditure Signal | Return the Market Needs to See |
|---|---|---|
| Alphabet | $180 billion–$190 billion | Cloud, Gemini, and advertising efficiency |
| Meta | $125 billion–$145 billion | Advertising monetization, models, and new products |
| Amazon | Approximately $200 billion | AWS demand and return on invested capital |
| Oracle | Approximately $50 billion in fiscal 2026 | AI cloud contracts, utilization, and cash flow |
| Microsoft | Quarterly investment remains elevated | Azure, Copilot, and cloud margins |
Alphabet’s first-quarter 2026 earnings raised full-year CAPEX guidance from $175 billion–$185 billion to $180 billion–$190 billion. The company said most technical infrastructure spending was directed toward servers, with the remainder going to data centers and networking equipment. Investors therefore need to determine whether Google Cloud, Gemini, and search advertising efficiency can support the company’s rapidly expanding asset base.
Meta’s first-quarter 2026 results raised full-year capital expenditure guidance to $125 billion–$145 billion, including finance lease principal repayments. Higher component prices and future data center capacity will increase investment, but the valuation ultimately depends on whether recommendation systems, advertising conversion, and AI products generate measurable returns.
Amazon’s 2026 capital expenditure plan is approximately $200 billion and covers AI, semiconductors, robotics, and other infrastructure. Investors may interpret the spending as evidence of strong AWS demand, but they must also consider whether such a large cash commitment can maintain an attractive return on invested capital.
Microsoft does not always provide a single annual figure in the same format as some peers, but its fiscal 2026 third-quarter earnings already show that continued investment in AI infrastructure and increased usage of AI products are putting pressure on the company’s gross margin. The effect of capital expenditure is therefore beginning to move from the cash flow statement into the income statement.
The 2026 investment environment differs from the earlier AI cycle in several ways:
- GPU shortages are no longer the only constraint; power supply and data center construction have also become bottlenecks;
- Capital expenditure represents a larger percentage of operating cash flow;
- Depreciation is increasing as earlier server investments enter service;
- Some companies are using finance leases, debt, or equity to support expansion;
- Investors are distinguishing measurable AI revenue from a broad AI narrative;
- Valuation has shifted from “more investment means stronger leadership” to “is the return on investment high enough?”
Oracle provides a more extreme example. Oracle’s full-year fiscal 2026 results showed rapid cloud growth alongside negative free cash flow of $23.7 billion, primarily because of continued cloud infrastructure construction. This does not automatically mean the investment has failed, but it clearly demonstrates that high growth and heavy cash consumption can occur at the same time.
Summary: In 2026, technology stock valuations no longer reward AI investment purely based on scale. Investors compare capital expenditure with revenue, profit, and cash flow conversion. When demand is strong and compute capacity remains undersupplied, high CAPEX can expand long-term revenue potential. When monetization is slow, utilization is weak, or financing costs rise, the same spending becomes a valuation risk.
How Does AI CAPEX Affect Profit, Free Cash Flow, and Valuation?

AI CAPEX first reduces free cash flow, then affects margins through depreciation and operating costs, and ultimately changes the valuation multiple investors are willing to pay. The market may tolerate lower cash flow for a period, but only when new servers and data centers are expected to generate higher revenue and produce a long-term return on capital above the company’s financing cost.
How Does AI CAPEX Enter the Three Financial Statements?
- Balance sheet: GPUs, servers, and buildings are recorded as property and equipment;
- Cash flow statement: Equipment purchases create investing cash outflows;
- Income statement: Assets generate depreciation expense over their useful lives;
- Operating costs: Electricity, staffing, networking, and maintenance expenses increase;
- Free cash flow: Operating cash flow minus CAPEX declines.
For example, a company’s operating cash flow may increase from $50 billion to $60 billion, which initially suggests a clear business improvement. However, if capital expenditure rises from $20 billion to $50 billion, simplified free cash flow falls from $30 billion to $10 billion.
| Item | Before Expansion | After Expansion |
|---|---|---|
| Operating cash flow | $50 billion | $60 billion |
| Capital expenditure | $20 billion | $50 billion |
| Simplified free cash flow | $30 billion | $10 billion |
| Net income | May increase | May still increase |
| Valuation impact | Relatively stable cash return | Depends on future monetization |
Free cash flow is not a fully standardized GAAP metric. Companies may treat finance leases, equipment prepayments, or asset sales differently, so the calculation method should be checked before making cross-company comparisons.
Through Which Variables Does CAPEX Change Valuation?
- Revenue growth: Can the additional compute capacity generate more cloud and AI revenue?
- Gross margin: Are depreciation, power, and inference costs consuming incremental revenue?
- Free cash flow yield: Has the cash return associated with the current share price declined?
- Return on invested capital: Does incremental profit justify the additional asset base?
- Asset utilization: Are GPUs and data centers operating at high workloads?
- Cost of capital: Have debt, leases, and equity financing become more expensive?
- Equipment life: Is technological progress making assets obsolete earlier than expected?
The market can respond very differently to similar CAPEX increases. When cloud revenue is accelerating and customers are waiting for capacity, higher spending signals undersupply and future growth. When revenue guidance does not improve, the same increase looks more like a margin and cash-flow risk.
Microsoft Cloud’s gross margin has been affected by AI infrastructure investment and growing AI product usage, although efficiency improvements have offset some of the pressure. This is the type of result investors want to see: investment increases costs, but scale and revenue growth gradually absorb them.
Oracle illustrates another source of pressure. In 2026, the company announced an equity and debt financing plan to raise between $45 billion and $50 billion. When data center construction requires external financing, investors must also consider interest expense, equity dilution, and balance sheet risk.
Summary: The valuation effect of AI CAPEX involves a clear time lag. Cash leaves the company during procurement and construction, depreciation rises gradually over several years, and revenue may arrive later still. Looking only at EPS can understate cash pressure, while focusing only on free cash flow may overlook infrastructure that is still being built. A more balanced approach compares revenue growth, margins, cash flow, utilization, and the cost of capital.
How Does AI CAPEX Transmit Through the Chip, Storage, and Data Center Supply Chain?
For cloud companies, AI CAPEX is a cash outflow. For upstream suppliers, it becomes orders and revenue. Spending usually flows first into GPUs, custom chips, servers, and networking equipment, then reaches TSMC’s advanced manufacturing, ASML lithography systems, Micron HBM, enterprise storage, power infrastructure, and cooling systems. Because each segment has a different delivery cycle, revenue is not recognized in the same quarter.
A typical transmission path looks like this:
- Cloud providers set data center and compute budgets;
- Nvidia, AMD, and custom ASIC suppliers receive chip orders;
- TSMC handles advanced-node production and CoWoS packaging;
- Foundries order equipment from companies such as ASML;
- Micron and other memory suppliers provide HBM, DRAM, and SSDs;
- Networking, power, and liquid-cooling companies build supporting infrastructure;
- As data accumulates, nearline HDD capacity demand increases.
Nvidia’s fiscal 2027 first-quarter results showed quarterly revenue of $81.6 billion, while data center revenue reached $75.2 billion, up 92% year over year. This demonstrates that cloud CAPEX has already been converted into substantial revenue for AI chip and networking suppliers.
TSMC handles the production side. [TSMC’s 2026 capital budget](https://investor.tsmc.com/english/encrypt/files/encrypt_file/reports/2026-01/51d09df96cd89ac19d65af39032b038dc2896a24/TSMC 4Q25 Transcript.pdf) is expected to reach $52 billion–$56 billion, up from $40.9 billion in 2025, mainly for advanced processes, packaging, and global capacity expansion. This spending then transmits demand to semiconductor equipment suppliers.
ASML’s first-quarter 2026 results raised full-year sales expectations to €36 billion–€40 billion and indicated that AI infrastructure investment was encouraging advanced logic and memory customers to accelerate capacity expansion. Equipment orders lead chip revenue, but the process from ordering to installation and acceptance can span multiple quarters.
| Supply-Chain Segment | CAPEX-Related Products | Key Indicators | Main Risks |
|---|---|---|---|
| AI chips | GPUs, CPUs, ASICs | Data center revenue and guidance | Custom chips and slower customer procurement |
| Foundries | Advanced nodes and CoWoS | HPC revenue and capital expenditure | Customer concentration and yield |
| Semiconductor equipment | EUV, etching, deposition | Orders, backlog, delivery | Expansion-cycle reversal |
| Memory and storage | HBM, DRAM, SSDs | Shipments, pricing, margins | Excess supply growth |
| Networking | Switches and optical modules | AI orders and revenue | Technology migration |
| Power and cooling | Substations, generation, liquid cooling | Project backlog and delivery | Approval and construction delays |
| Capacity storage | Nearline HDDs | Exabyte shipments | Cloud customer inventory |
The memory industry is also increasing investment. Micron’s latest investor materials indicate that the company is investing at record levels in technology, products, and supply to meet AI-era memory demand. Fiscal 2026 capital expenditure is expected to reach approximately $27 billion, reflecting further investment in HBM, advanced DRAM, and cleanroom capacity.
Upstream suppliers still face risks. Cloud providers may overbook equipment and power capacity, order growth may slow after supply bottlenecks ease, and new GPU generations may reduce the economic life of older servers. A market rotation from cloud companies toward “picks-and-shovels” suppliers does not mean supplier valuations can become disconnected from end demand.
Summary: AI CAPEX converts cloud-company cash into revenue for chip, foundry, equipment, memory, and data center suppliers. The buyer assumes depreciation and utilization risk, while suppliers assume order-cycle and expansion risk. Supply-chain analysis must distinguish between orders, deliveries, and revenue recognition rather than assuming that higher capital expenditure benefits all related stocks at the same time.
How Can You Tell Whether AI CAPEX Is a Growth Investment or a Valuation Risk?
The size of AI CAPEX alone does not determine whether the spending is productive. You need to compare capital expenditure growth with AI revenue growth, capacity utilization, margins, free cash flow, and financing structure. When demand continues to exceed supply and AI revenue grows faster than investment, high CAPEX can strengthen a competitive advantage. When spending rises rapidly without better utilization, profits, or cash returns, it becomes a valuation risk.
A seven-factor scorecard can help:
- Is CAPEX growth consistently higher than revenue growth?
- Is cloud or AI product revenue accelerating?
- Does demand still exceed available compute capacity?
- Are gross and operating margins stable?
- Is free cash flow deteriorating for an extended period?
- Can management quantify AI revenue or efficiency improvements?
- Are analysts raising future cash-flow estimates?
| CAPEX Condition | Revenue and Utilization | Cash Flow Performance | Valuation Implication |
|---|---|---|---|
| Productive expansion | Revenue accelerates and supply remains tight | Declines initially, then recovers | May support a long-term premium |
| Front-loaded construction | Revenue has not fully materialized | Temporarily pressured | Requires further validation |
| Efficiency improvement | CAPEX growth slows | Free cash flow recovers | Valuation quality improves |
| Overbuilding | Utilization and revenue weaken | Continues deteriorating | Valuation compression risk |
| Financing-led expansion | High growth depends on external capital | Interest or dilution rises | Higher return hurdle |
Which Signals Suggest That CAPEX Is Generating Returns?
- Azure, AWS, Google Cloud, or OCI growth accelerates;
- AI products generate identifiable revenue rather than only user growth;
- Data center capacity remains constrained;
- Unit inference costs decline and gross margins stabilize;
- Advertising conversion, subscription pricing, or customer retention improves;
- CAPEX growth gradually falls below AI revenue growth;
- Free cash flow begins to recover after the expansion phase.
Which Signals Suggest Possible Overbuilding?
- Management repeatedly raises spending but cannot quantify monetization;
- GPU and data center utilization decline;
- Depreciation grows materially faster than operating profit;
- CAPEX increasingly depends on debt, leases, or equity financing;
- Customer order growth falls below capacity expansion;
- Actual equipment life is shorter than the accounting depreciation period;
- Analysts repeatedly reduce free cash flow forecasts.
Trading costs also matter for short- and medium-term strategies. AI CAPEX-related stocks can move sharply after earnings and guidance updates. Frequent adjustments to positions in Microsoft, Alphabet, Amazon, Meta, Nvidia, or related suppliers involve more than commissions. Platform fees, external institutional charges, bid-ask spreads, and slippage also affect actual results.
Under the current Biya U.S. stock fee structure, the commission is $0, while the platform fee is $0.005 per share, subject to a minimum of $0.99 per order and a maximum of 1% of the transaction value. External institutional and trading activity fees total $0.00396 per share. For fractional-share orders involving less than one full share, the platform fee is 1% of the transaction value, capped at $1. Actual charges remain subject to the fee center and the order screen.
Summary: The central question in AI CAPEX analysis is not how much more a company will spend, but whether each dollar of capital can produce more revenue and cash flow. High utilization, improving monetization, and stable margins can turn heavy spending into a long-term competitive advantage. Weak revenue conversion, rising financing needs, and persistently lower cash flow can turn the same spending into a valuation risk.
When tracking Microsoft, Alphabet, Amazon, Meta, Oracle, Nvidia, and other AI CAPEX-related companies, you can use Biya’s U.S. stock search to organize earnings dates, capital expenditure guidance, cloud growth, and free cash flow. Cloud companies can then be compared with supply-chain businesses such as TSMC, ASML, and Micron. Biya also provides access to relevant market information and trading arrangements, while the App supports ongoing monitoring. Growth in AI infrastructure investment does not guarantee that related stocks will rise, and public financial information does not constitute investment advice. Service availability depends on the user’s location, identity-verification results, platform rules, and applicable laws and regulations.
FAQ
Why Does Higher AI CAPEX Reduce a Company’s Free Cash Flow?
Because capital expenditure creates an actual cash outflow. Even when the cost of GPUs and servers is recognized through depreciation over several years, the purchase may already have been paid for in the current period. If operating cash flow grows more slowly than CAPEX, net income can rise while free cash flow falls sharply.
Does Higher AI CAPEX Always Produce Better Long-Term Stock Returns?
No. High CAPEX creates value only when it generates higher revenue, profits, and returns on capital. If new data centers have low utilization, equipment becomes obsolete quickly, or financing costs rise, large investments can reduce free cash flow and compress valuation multiples.
Is the Purchase of GPUs for an AI Data Center Classified as CAPEX or OPEX?
GPUs purchased for long-term use are generally capitalized and depreciated over their estimated useful lives. GPUs rented from a cloud provider on a time-based or usage-based basis are generally closer to operating expenses. The exact classification depends on the company’s accounting policies and financial disclosures.
Why Does Higher AI CAPEX From Cloud Companies Benefit Semiconductor Companies?
Cloud-company spending becomes orders for GPUs, wafers, advanced packaging, HBM, networking equipment, and storage. However, several quarters may pass between an order and the supplier’s revenue recognition. The benefit also depends on market share, production capacity, and product mix.
Where Can Ordinary Investors Find AI CAPEX Data in Financial Reports?
Start with purchases of property and equipment in the cash flow statement, then review management earnings calls, capital expenditure guidance, finance lease disclosures, and fixed-asset notes. Definitions differ across companies, so leases, buildings, and server investments should be measured consistently before making comparisons.
*This article is provided for general information purposes and does not constitute legal, tax or other professional advice from BiyaPay or its subsidiaries and its affiliates, and it is not intended as a substitute for obtaining advice from a financial advisor or any other professional.
We make no representations, warranties or warranties, express or implied, as to the accuracy, completeness or timeliness of the contents of this publication.
Related Blogs of

Why Did APT Satellite’s Share Price Surge? Business, Valuation, and Risks in the Commercial Space Boom


How Can One Company’s Earnings Affect the Entire AI Supply Chain? From TSMC and ASML to Micron and Seagate


What Should You Listen for in AI Earnings Calls? Four Keywords: CAPEX, HBM, ROI, and Guidance


Alphabet Earnings Preview: Will AI Search Weigh on Advertising or Drive Google Cloud Growth?

Choose Country or Region to Read Local Blog
 Australia
 Austria
 Belgium
 Canada
 Cyprus
 Czech Republic
 Denmark
 Estonia
 Finland
 France
 Germany
 Greece
 Hong Kong
 India
India Indonesia
 Ireland
 Italy
Italy Japan
Japan Latvia
 Lithuania
 Luxembourg
 Malaysia
 Malta
Malta Morocco
 Nepal
Nepal Netherlands
 New Zealand
 Norway
 Pakistan
 Philippines
 Poland
 Portugal
 Romania
 Singapore
 Slovakia
 Slovenia
 South Africa
 South Korea
 Spain
Spain Sweden
 Thailand
 The United States
 Turkey
 United Arab Emirates
 United Kingdom
 Vietnam
Contact Us




BIYA GLOBAL LLC is registered with the Financial Crimes Enforcement Network (FinCEN), an agency under the U.S. Department of the Treasury, as a Money Services Business (MSB), with registration number 31000218637349, and regulated by the Financial Crimes Enforcement Network (FinCEN).
BIYA GLOBAL LIMITED is a registered Financial Service Provider (FSP) in New Zealand, with registration number FSP1007221, and is also a registered member of the Financial Services Complaints Limited (FSCL), an independent dispute resolution scheme in New Zealand.