Has the DRAM Price Cycle Entered an Upswing? Key Indicators for Memory Stock Investing




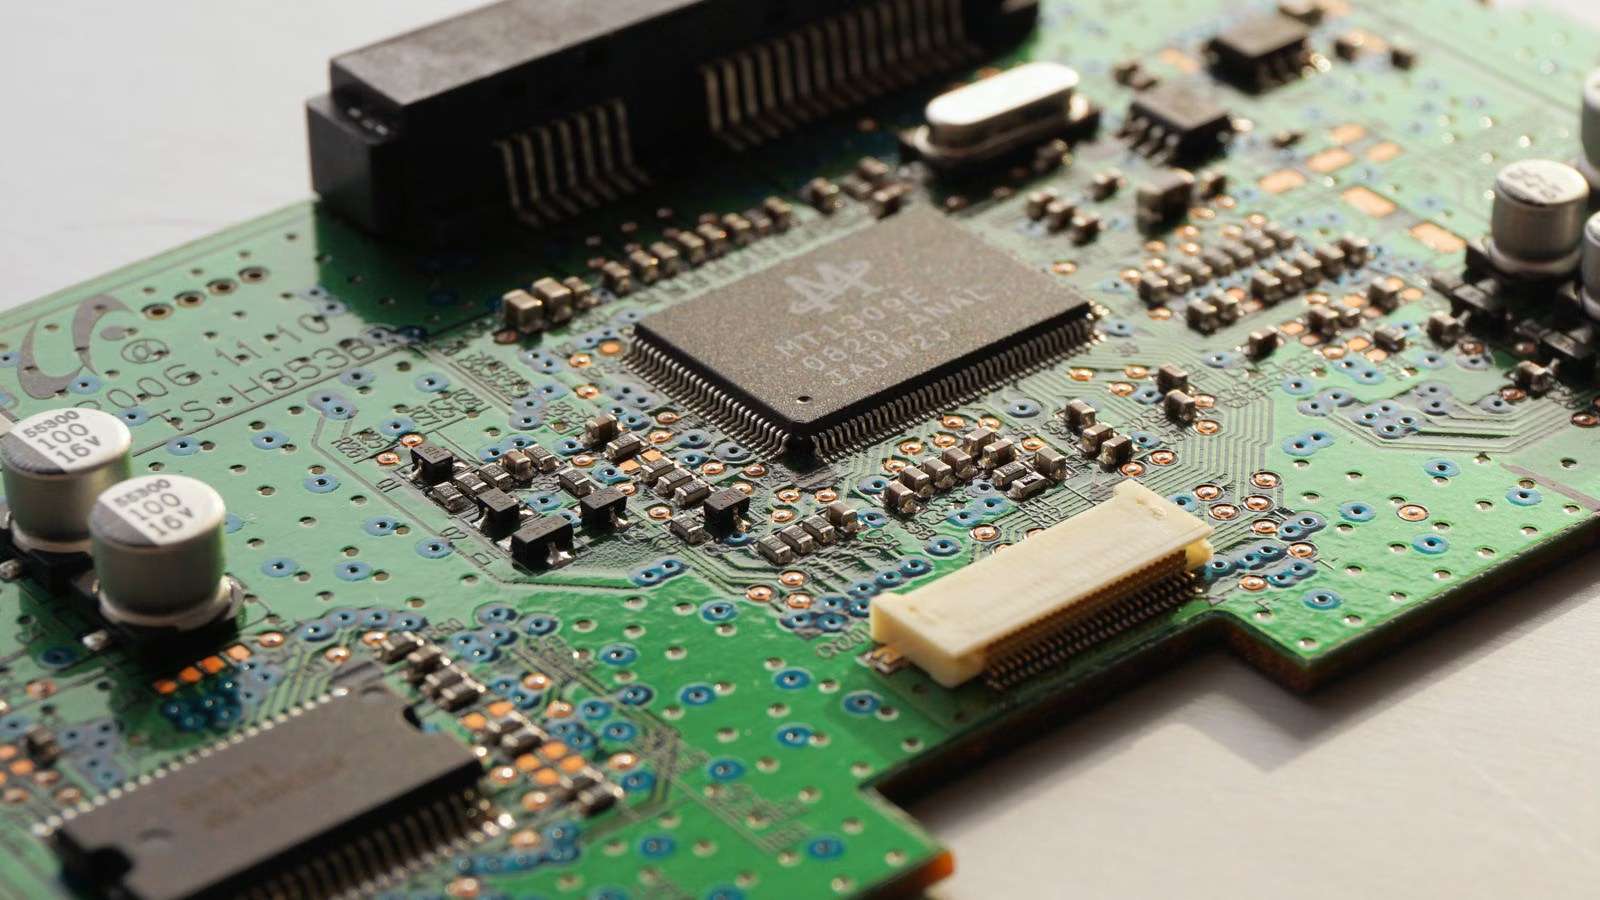
DRAM has clearly entered a price upcycle, but this is not a simple cycle in which every memory product rises at the same pace. The real drivers are AI servers, HBM expansion, server DDR5 demand, and the reallocation of traditional DRAM capacity. When you evaluate memory stock opportunities, you should not rely only on the phrase “DRAM prices are rising.” You also need to track contract prices, inventory, bit supply, capital expenditure, gross margin, and market expectations. If these indicators improve together, the cycle still has support; if inventories rise, expansion accelerates, and price growth slows, risk may appear earlier than earnings show.
Key Takeaways
- DRAM is already in an upcycle, but server and consumer demand are diverging.
- HBM expansion can crowd out traditional DRAM capacity and push up prices.
- Contract prices are more important than spot prices for judging supplier pricing power.
- Memory stocks often peak before financial results and price indicators turn down.
- Investors should track price, inventory, supply, valuation, and capital expenditure together.
- Cycle risk often appears first in rising customer inventory and slowing price increases.
Has the DRAM Price Cycle Already Entered an Upswing?
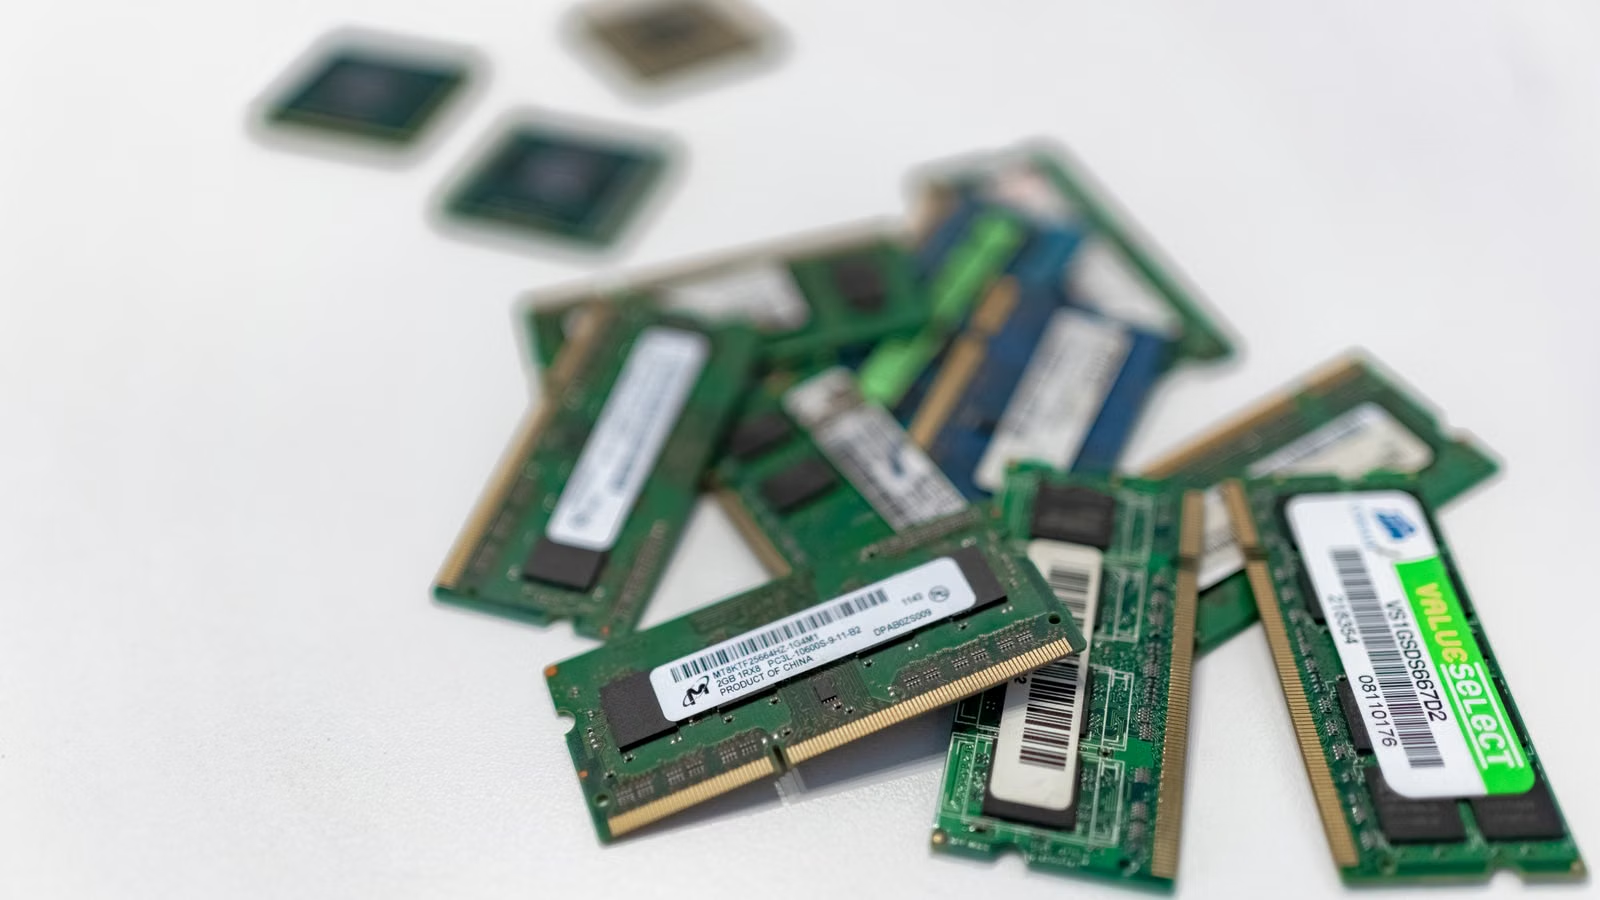
The DRAM price cycle has already entered an upswing. The basis for this judgment is not a one-day move in spot prices, but the combined improvement in contract prices, supplier pricing power, corporate gross margins, and server demand. For investors, a more accurate description of the current phase is “a clear uptrend with internal divergence.” Server DRAM and HBM-related products are stronger, while PCs, smartphones, and traditional consumer electronics have more limited ability to absorb price increases. That means not every memory stock should be treated as the same opportunity.
A DRAM cycle usually goes through four stages: price decline and destocking, price stabilization and restocking, tight supply and rising prices, then capacity expansion and cycle peaking. The current market is closer to the third stage: supply is tight, customers are locking in supply earlier, and supplier average selling prices are rising. According to TrendForce’s forecast for DRAM contract prices in the third quarter of 2026, conventional DRAM contract prices are expected to rise 13%–18% quarter over quarter, but PC and smartphone customers are already approaching their price tolerance limits, so the pace of increases has started to moderate compared with previous quarters.
You need to distinguish between a “price rebound” and a “complete upcycle.” A short-term rise in spot prices may come from channel restocking, trader inventory building, or temporary shortages in specific specifications. A full cycle requires several quarters of rising contract prices, improving supplier gross margins, downstream customers willing to lock in volume early, and no obvious inventory buildup. For example, Micron’s earnings call materials stated that tight supply and demand in DRAM and NAND could extend beyond 2027, while also expecting industry DRAM bit shipment growth in 2026 to be in the low-to-mid 20% range. This suggests the supply-demand imbalance is not just a single-quarter disturbance.
You can use the following table to assess where the cycle stands:
| Indicator | Current Signal | Cycle Implication |
|---|---|---|
| Contract prices | Rising for several quarters | Supplier pricing power is strengthening |
| Server DRAM | Leading price gains | AI and data-center demand dominate |
| PC DRAM | Still rising but under pressure | End demand limits pricing power |
| Mobile DRAM | Stronger in high-end models | Cost pressure is higher in mass-market devices |
| Supplier profitability | Gross margins improving | Price increases are flowing into profits |
| Customer procurement | Long-term agreements and restocking coexist | Demand is strong, but inventory needs monitoring |
However, spot prices should not be used as a standalone indicator. Large cloud providers, server OEMs, PC brands, and smartphone makers usually buy through quarterly contracts or long-term agreements. The spot market reflects short-term channel sentiment more than structural demand. Pricing for server DRAM and HBM is also affected by long-term supply agreements, customer qualification, product generations, and advanced packaging capacity, so its transmission rhythm differs from ordinary memory modules.
Summary: The DRAM upcycle has been validated by contract prices, supplier profitability, and AI server demand. Still, this cycle is not a broad-based boom driven by a traditional consumer electronics recovery. You should understand the current phase as a structural upcycle: servers are strong, AI memory is strong, and consumer demand is under pressure. Investment decisions should not rely only on rising spot prices. You also need to confirm whether contract prices continue to rise, whether customer inventory remains healthy, whether supplier gross margins keep improving, and whether stock prices have already reflected several quarters of future price increases.
What Supply and Demand Factors Are Driving This DRAM Price Increase?
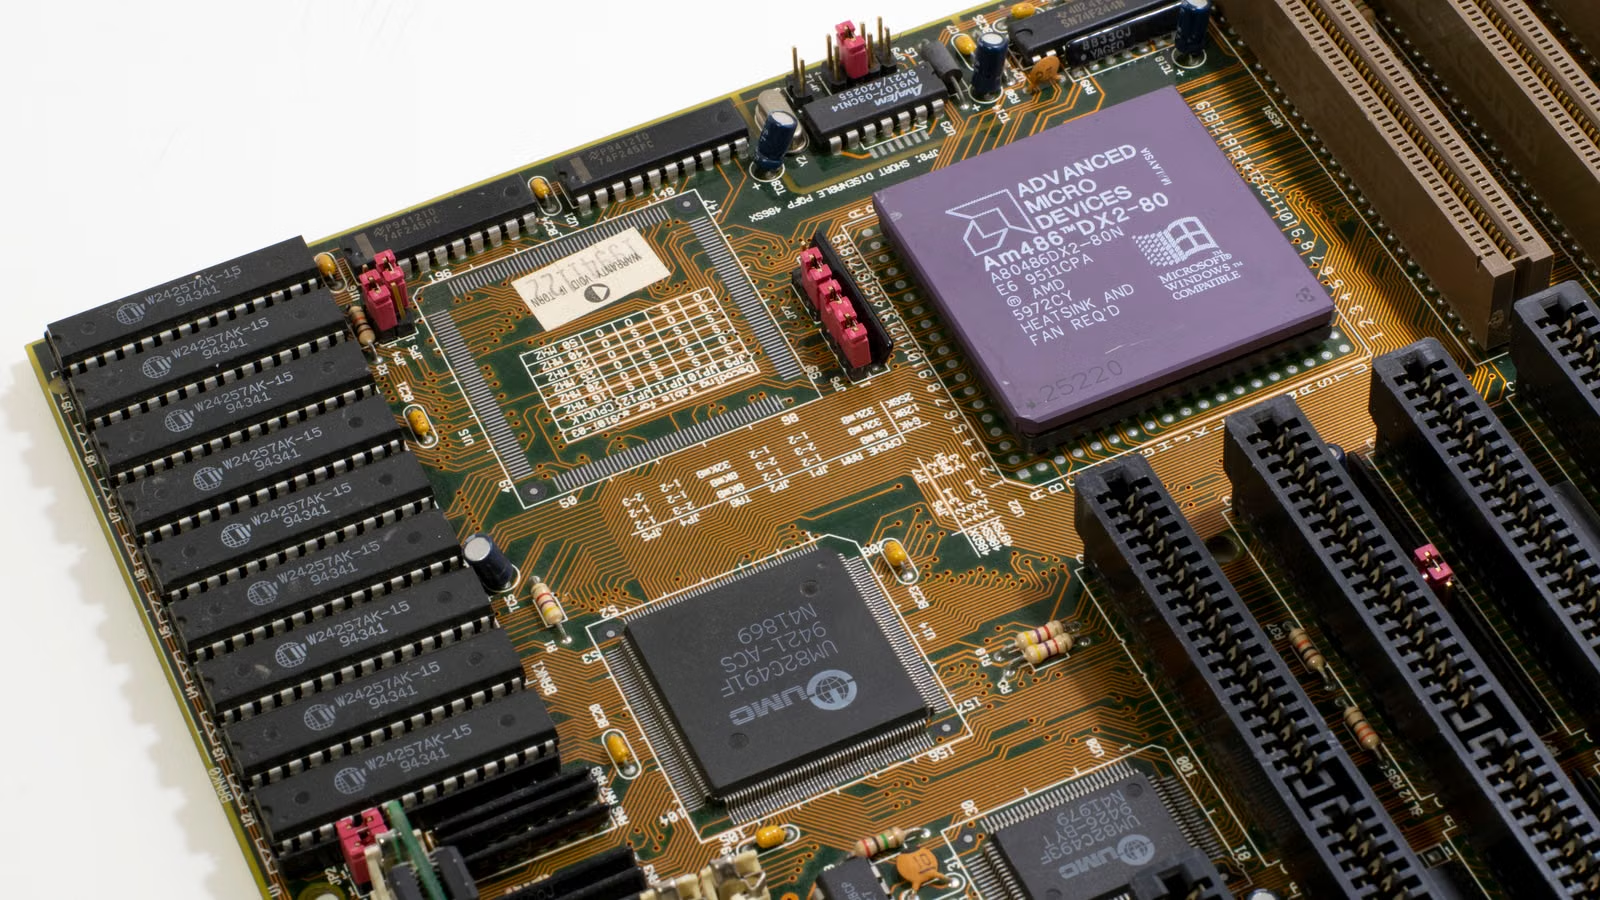
The main driver of this DRAM price increase is not a sudden surge in PCs and smartphones, but the combined effect of AI servers, HBM, server DDR5, and supply discipline. You can understand it this way: high-value AI memory is absorbing more wafers, cleanroom capacity, and capital resources, reducing the capacity allocated to traditional DRAM. At the same time, cloud providers are still expanding AI infrastructure, keeping server memory demand elevated.
AI servers do not only consume HBM. They also require large amounts of server DDR5, RDIMM, high-capacity memory modules, and enterprise SSDs. As model training, inference, and long-context applications increase, both memory capacity and bandwidth per server are rising. In Samsung’s first-quarter results, the company noted that its Memory Business reached record quarterly revenue and operating profit due to high-value AI demand, higher industry memory prices, and stronger ASPs. It also expected server memory demand to remain strong in the second half of the year.
HBM’s impact on traditional DRAM is even more important. HBM is not a completely separate market. It still requires DRAM wafers, advanced process technology, yield control, packaging and testing, and customer qualification. When manufacturers prioritize HBM, server DDR5, and high-capacity RDIMM, ordinary PC DRAM, mobile DRAM, DDR4, and some mature specifications receive less capacity. Because HBM has a higher unit value, suppliers naturally allocate scarce resources to products with more certain orders and better margins.
This price cycle can be broken down into a causal chain:
- Cloud providers and AI companies continue expanding compute infrastructure.
- GPUs, AI ASICs, and server platforms drive HBM and DDR5 demand.
- Memory makers shift capacity toward HBM, RDIMM, and enterprise products.
- Available capacity for PC, smartphone, and traditional consumer DRAM declines.
- Downstream customers restock or sign long-term agreements because they worry about tighter supply in 2027.
- Contract prices, ASPs, and gross margins improve together.
Supply also cannot be released quickly. A new wafer fab usually requires a long cycle of construction, equipment installation, yield ramp-up, and customer qualification. Even if a supplier announces capacity expansion, that does not mean supply pressure will ease within a few quarters. Micron has said its Idaho ID1 fab is expected to begin first wafer output in mid-2027, while ID2 is expected in late 2028. These timelines show that advanced DRAM capacity additions come with a clear lag.
| Demand Market | Main Growth Driver | Main Constraint |
|---|---|---|
| AI servers | HBM, DDR5, RDIMM, high-capacity memory | Power, racks, CPUs, and packaging supply |
| Traditional servers | Enterprise IT upgrades, virtualization, database demand | Corporate budget cycles |
| PCs | Replacement cycle, commercial restocking, AI PC theme | Higher system prices suppress demand |
| Smartphones | Memory upgrades in high-end models | Cost sensitivity in mid- and low-end models |
| Automotive and industrial | Higher memory content per device | Smaller base and long qualification cycles |
The key risk in this cycle is that consumer end markets may not be able to absorb price increases for long. TrendForce noted that PC OEMs are still supporting procurement through restocking, but higher component costs will gradually pass through to notebook prices. Smartphone makers may also raise retail prices to offset LPDRAM costs, but that can suppress shipment volume. In other words, strong server demand can support the cycle, but if consumer demand weakens sharply, price increases may shift from “broad-based” to “strong in high-end products, weak in ordinary products.”
Summary: This DRAM price increase is driven by AI infrastructure and HBM capacity crowding, not a full traditional consumer electronics recovery. Server DDR5, RDIMM, HBM, and enterprise products are at the center of the cycle, while PCs and smartphones are more like followers. As long as cloud AI investment, server shipments, and high-capacity memory demand remain strong, the DRAM upcycle still has support. But if device makers start cutting memory configurations or slowing procurement, the sustainability of price increases will be tested.
Which Core Indicators Should You Track to Judge the DRAM Cycle?
To judge the DRAM cycle, you should not look at prices alone. At a minimum, you need to track seven categories of indicators: contract prices, inventory, bit supply, utilization rates, capital expenditure, product mix, and downstream demand. Prices tell you how tight supply is today, inventory tells you whether demand is real, capital expenditure determines future supply, and gross margins confirm whether price increases are turning into profits. If you focus on only one indicator, it is easy to misread the second half of the cycle.
Among price indicators, contract prices matter more than spot prices. Server customers, cloud providers, PC OEMs, and smartphone brands mainly buy through quarterly contracts or long-term agreements, so contract prices better reflect real pricing power in the supply chain. You can focus on server DDR5, RDIMM, LPDDR5X, PC DRAM, the DDR4-DDR5 price spread, and supplier DRAM ASPs. For example, TrendForce’s forecast for server DRAM contract prices showed that server DRAM contract prices were expected to rise 13%–18% quarter over quarter in the third quarter of 2026, but some US CSPs had already signed long-term supply agreements, so incremental price gains were more likely to come from non-LTA customers and supply beyond existing agreements.
Inventory indicators must be examined by layer. Falling supplier inventory usually indicates improving supply-demand conditions. Rising customer inventory requires a closer look at server deployment progress. If cloud providers lock in inventory early but server CPUs, power, racks, or data-center construction cannot keep pace, DRAM may accumulate at the customer level before it is consumed. TrendForce also noted that server CPU shortages had previously slowed system assembly and caused US CSPs to gradually build DRAM inventory in the second quarter. This kind of signal should not be interpreted simply as a demand collapse, but it should not be ignored either.
| Indicator Category | What to Track | Risk Signal |
|---|---|---|
| Price | Contract price, spot price, ASP | Contract prices turn down or growth narrows repeatedly |
| Inventory | Supplier inventory, customer inventory, channel inventory | Shipments weaken while inventory keeps rising |
| Supply | Bit shipments, utilization, process migration | Supply growth exceeds demand growth |
| Capital expenditure | New fabs, equipment orders, cleanroom expansion | Capacity releases cluster together |
| Profitability | Gross margin, operating margin, free cash flow | ASPs stop rising while costs continue increasing |
| Demand | Cloud CAPEX, servers, PCs, smartphones | Downstream customers cut configurations or orders |
Bit supply matters more than wafer count. DRAM suppliers can increase bit output per wafer through process migration even without adding many wafers. At the same time, HBM capacity conversion consumes more resources, reducing equivalent supply for traditional DRAM. Therefore, you cannot only ask whether companies are expanding capacity. You also need to know whether new capacity is going into HBM, DDR5, LPDDR, or mature DDR4.
Corporate earnings are the key validation point for the cycle. You should track DRAM ASP changes quarter over quarter, bit shipments, data-center revenue mix, HBM revenue, gross margin, inventory turnover days, capital expenditure, and next-quarter guidance. Micron’s third-quarter results showed strong year-over-year growth in cloud memory and core data-center revenue. The company also disclosed that HBM4 had entered high-volume shipment and that 256GB DDR5 RDIMM qualification samples had been delivered to key server ecosystem customers. These product developments say more about structural upgrades than headline revenue alone.
Summary: The most practical way to monitor the DRAM cycle is to place price, inventory, supply, profitability, and end demand in the same framework. Rising contract prices show that suppliers still have pricing power. Low inventory indicates that demand has not been obviously overdrawn. Bit supply and capital expenditure determine whether future oversupply may emerge. ASPs and gross margins confirm whether price increases are entering the income statement. Downstream shipments confirm whether demand is real. Only when several indicators weaken together does a cycle reversal become more likely. One month of spot price volatility is not enough to support a trading conclusion on its own.
How Should Investors Compare Different Memory Stocks?
When investing in memory stocks, you should not simply compare which company has the highest DRAM market share. You need to compare HBM competitiveness, server product mix, cost capability, customer structure, capital expenditure efficiency, and valuation. Whether you are buying “cycle sensitivity” or “long-term AI memory growth” will directly affect company selection. Companies with higher DRAM purity can offer stronger price-upcycle leverage, but their downside-cycle volatility is also greater. Companies with more diversified products may carry lower risk, but the cyclical upside may be diluted by other businesses.
Major global memory companies can be grouped into several types: companies with stronger HBM and high-end server DRAM exposure, integrated electronics and semiconductor groups, and memory companies with convenient US-market access and relatively transparent disclosures. SK hynix, Samsung Electronics, and Micron all benefit from DRAM price increases and AI memory demand, but their business mix, customer structure, and valuation logic differ. For example, SK hynix’s first-quarter results emphasized that high-value products, including HBM, high-capacity server DRAM modules, and enterprise SSDs, helped the company extend its upward momentum. Samsung, by contrast, also has memory, foundry, smartphone, and display businesses, making its profit sources more complex.
| Comparison Dimension | Why It Matters | What to Watch |
|---|---|---|
| HBM capability | Determines AI memory premium | Customer qualification, generation progress, yield |
| Server DRAM | Determines the core leverage of this cycle | RDIMM, MRDIMM, high-capacity modules |
| Cost capability | Determines whether price increases become profit | Process node, yield, scale |
| Customer structure | Determines revenue stability | Cloud providers, AI chip customers, long-term agreement ratio |
| Capital expenditure | Determines future supply and cash flow | New fab timelines, equipment spending |
| Valuation | Determines whether expectations are already priced in | Mid-cycle profit, free cash flow |
Product mix has a major impact on earnings leverage. HBM, server DDR5, and high-capacity RDIMM usually have higher value per unit and better order visibility. Consumer DRAM depends more on PC demand, smartphone demand, and channel inventory. Mature DDR4 may rise temporarily as suppliers exit capacity, but long-term demand is still migrating toward DDR5. Micron’s DDR5 product materials show that DDR5 RDIMM and MRDIMM continue to improve in bandwidth and capacity. This is one of the fundamental reasons server platform upgrades increase memory value per system.
Valuation cannot be judged only by static P/E ratios. Memory companies can look optically cheap at the top of the cycle because profits are very high. But if the market expects prices to fall later, a low P/E ratio may actually be a risk signal. You should also use mid-cycle profit, free cash flow, how close gross margins are to historical highs, capital expenditure pressure, and balance-sheet quality. For memory stocks that have already risen sharply, you also need to see whether analysts are still raising ASP, gross margin, and earnings forecasts. If earnings upgrades stop, stock prices may adjust before DRAM prices do.
There is also a trading-cost connection. If you are following Micron, Samsung ADRs, SK hynix ADRs, or related semiconductor ETFs, you need to evaluate not only the cycle but also actual trading costs, FX costs, and order types. US stock trading costs may include more than commissions; they may also include platform fees, external agency fees, and trading activity fees. For example, under Biya’s US stock trading fees, US stock trading commission is USD 0, while platform fees, external agency fees, and other charges are subject to the fee center and order page. Service availability depends on the user’s location, identity verification result, platform rules, and applicable laws and regulations.
Summary: The key to comparing memory stocks is not simply choosing the largest company, but identifying which company has the strongest profit sensitivity to this cycle. Higher exposure to HBM and server DRAM makes a company more likely to benefit from AI memory demand. Higher exposure to consumer DRAM makes performance more dependent on PC and smartphone recovery. On valuation, you should not rely only on low P/E ratios. You also need to judge whether the market has already priced in future price increases, whether capital expenditure may erode free cash flow, and whether stock prices have already anticipated the cycle peak ahead of industry indicators.
When Might the DRAM Upcycle Peak?
A DRAM cycle usually does not end suddenly while prices are still rising rapidly. Before that, you often see early signals such as slowing price increases, rising customer inventory, faster capacity expansion, slower earnings estimate upgrades, and weaker stock-price reactions to good news. What you need to observe is not “the exact day of the highest price,” but the process through which supply-demand conditions move from tight to loose. Memory stocks often peak before prices and earnings, so risk identification needs to happen early.
Before prices peak, structural divergence often appears first. Server DRAM may still rise, while PC DRAM or mobile DRAM price growth slows. Long-term agreement customers may still have stable prices, while non-LTA customers refuse higher quotes. Spot prices may fall first while contract prices continue rising. This phase does not necessarily mean the cycle is over, but it does require more caution. If contract price growth narrows for two consecutive quarters, supplier ASPs miss expectations, and customers start delaying orders, the cycle is becoming more mature.
Inventory and capital expenditure are more important leading indicators. If supplier inventory is low and customer inventory is also healthy, the price upcycle can continue. If customer inventory keeps rising while end shipments do not grow at the same pace, the market may face a demand vacuum after early restocking. On the other hand, if all major suppliers expand aggressively and new capacity comes online around the same time, future oversupply risk rises. Samsung’s second-quarter earnings guidance showed that the company expected a sharp increase in both sales and operating profit, indicating strong current profitability. But for cyclical stocks, the more important question is whether supply and demand can continue supporting high margins in the next several quarters.
| Price Trend | Inventory Trend | Possible Stage |
|---|---|---|
| Rising | Falling | Upcycle strengthening |
| Rising | Rising | Customer restocking; monitor closely |
| Flat | Rising | Cycle entering a mature phase |
| Falling | Rising | Downcycle confirmed |
| Falling | Falling | Late destocking or early next bottom |
Stock prices can also react to cycle risk early. Reuters’ report on SK hynix share volatility noted that after AI memory enthusiasm had pushed the stock sharply higher, the market also began worrying about valuation, profit-taking, and future supply pressure from expansion. This kind of volatility shows that strong earnings do not automatically mean stock prices will keep rising. When the market is already very optimistic about future profits, any slowdown in growth can be amplified.
You can build a simple red-yellow-green framework:
- Green light: contract prices rise, inventory is low, server demand is revised upward, and gross margins improve.
- Yellow light: price growth narrows, customer inventory rises, and capital expenditure accelerates.
- Red light: contract prices turn down, earnings forecasts are cut, and bit supply exceeds demand.
Summary: A DRAM cycle peak is not a single event, but a process in which multiple indicators weaken gradually. The earliest signals usually come from slowing price increases, rising customer inventory, and weaker stock-price reactions to good news. Stronger confirmation signals include falling contract prices, weaker-than-expected supplier ASPs, effective supply from capital expenditure, and downward earnings revisions. You should track risk while earnings still look strong, instead of waiting until the industry is already in a clear downcycle before reassessing positions.
If you want to turn the DRAM price cycle into an actionable investment watchlist, you can put memory stock tickers, quarterly earnings, contract prices, cloud CAPEX, inventory changes, and valuation indicators into one table. Through US stock information search, you can first check basic information for Micron, semiconductor ETFs, or related US-listed stocks. If relevant service conditions are met, you can also use Biya to follow multiple asset markets, including US stocks, Hong Kong stocks, and digital assets. Before trading, you should confirm order types, fee structures, FX impact, and your own risk tolerance. Biya is a global multi-asset trading wallet that supports US and Hong Kong stock trading as well as digital-asset trading. Service availability is subject to the user’s location, identity verification result, platform rules, and applicable laws and regulations.
FAQ
Which Better Reflects the DRAM Cycle: Spot Prices or Contract Prices?
Contract prices better reflect the DRAM cycle because large server, PC, and smartphone customers mainly buy through quarterly contracts or long-term agreements. Spot prices react faster, but they are more easily affected by channel restocking, temporary shortages, and trading sentiment. For cycle judgment, use contract prices and supplier ASPs as the core indicators, while using spot prices to observe short-term changes.
Why Does HBM Demand Growth Push Up Ordinary DRAM Prices?
HBM can push up ordinary DRAM prices because HBM and standard DRAM share some wafers, cleanroom capacity, equipment, R&D resources, and packaging and testing capacity. When memory suppliers prioritize HBM and server DDR5, available capacity for PC DRAM, mobile DRAM, and some DDR4 products may decline, tightening supply for ordinary DRAM.
Does Rising DDR4 Pricing Mean Better Long-Term Investment Opportunity?
Rising DDR4 pricing does not necessarily mean better long-term investment opportunity. DDR4 may rise temporarily because suppliers reduce capacity, customers shift orders, or mature specifications become scarce. But long-term server and high-end PC demand is still migrating toward DDR5. Investors should distinguish between supply-exit-driven price increases and sustainable demand growth.
How Often Should Retail Investors Update DRAM Cycle Indicators?
Retail investors can review DRAM spot prices and channel inventory monthly, and update contract prices, supplier ASPs, gross margins, inventory, and capital expenditure quarterly. When Micron, Samsung, or SK hynix report earnings, or when cloud AI CAPEX changes significantly, the original cycle judgment should be reassessed.
What Is the Main Difference Between Memory Stocks and Memory ETFs?
Memory stocks offer higher cycle sensitivity and product exposure, but they also carry more company-specific execution risk, customer concentration risk, technology risk, and valuation volatility. Memory or semiconductor ETFs can reduce single-company risk, but they may include equipment makers, foundries, chip designers, and other non-pure memory companies. Investors should check holdings, fees, and index exposure before trading.
Does a Low P/E Ratio Mean a Memory Stock Is Undervalued?
A low P/E ratio does not necessarily mean a memory stock is undervalued. When memory companies are near peak-cycle profits, static P/E ratios often fall, but the market may already expect future prices and margins to decline. Valuation should be assessed together with mid-cycle profit, free cash flow, inventory, capital expenditure, and future DRAM price trends.
*This article is provided for general information purposes and does not constitute legal, tax or other professional advice from BiyaPay or its subsidiaries and its affiliates, and it is not intended as a substitute for obtaining advice from a financial advisor or any other professional.
We make no representations, warranties or warranties, express or implied, as to the accuracy, completeness or timeliness of the contents of this publication.
Related Blogs of

What Is HBM? Why AI Servers Depend on High-Bandwidth Memory


HBM Investment Theme: Samsung, SK Hynix, or Micron—Which One Deserves the Most Attention?


Will NAND Prices Keep Rising? Enterprise SSD Demand and the Memory Cycle


What Is the Roundhill DRAM ETF? Buying the AI Memory Supply Chain with One ETF
Choose Country or Region to Read Local Blog
 Australia
 Austria
 Belgium
 Canada
 Cyprus
 Czech Republic
 Denmark
 Estonia
 Finland
 France
 Germany
 Greece
 Hong Kong
 India
India Indonesia
 Ireland
 Italy
Italy Japan
Japan Latvia
 Lithuania
 Luxembourg
 Malaysia
 Malta
Malta Morocco
 Nepal
Nepal Netherlands
 New Zealand
 Norway
 Pakistan
 Philippines
 Poland
 Portugal
 Romania
 Singapore
 Slovakia
 Slovenia
 South Africa
 South Korea
 Spain
Spain Sweden
 Thailand
 The United States
 Turkey
 United Arab Emirates
 United Kingdom
 Vietnam
Contact Us




BIYA GLOBAL LLC is registered with the Financial Crimes Enforcement Network (FinCEN), an agency under the U.S. Department of the Treasury, as a Money Services Business (MSB), with registration number 31000218637349, and regulated by the Financial Crimes Enforcement Network (FinCEN).
BIYA GLOBAL LIMITED is a registered Financial Service Provider (FSP) in New Zealand, with registration number FSP1007221, and is also a registered member of the Financial Services Complaints Limited (FSCL), an independent dispute resolution scheme in New Zealand.