2026 AI Earnings Calendar: What to Watch in Samsung, ASML, TSMC, Tesla, Alphabet, and Microsoft





The July 2026 AI earnings calendar is not just a list of reporting dates. It is better understood as a sequence for validating the AI value chain. You should first look at Samsung for HBM and the memory cycle, then ASML and TSMC for AI chip production and delivery capacity, followed by Tesla for AI applications, and finally Alphabet and Microsoft to see whether AI CAPEX is turning into cloud revenue, enterprise subscriptions, and cash flow.
Key Takeaways
- The AI earnings calendar should be read in value-chain order, not through isolated EPS numbers.
- Samsung first validates HBM and memory strength, while ASML validates equipment demand.
- TSMC’s key metrics are advanced nodes, HPC revenue, and CoWoS capacity.
- Tesla should be analyzed separately across deliveries, energy storage, FSD, and robotics expectations.
- Alphabet and Microsoft determine whether AI CAPEX is converting into cloud revenue.
- After earnings, stock reactions depend more on expectations, guidance, and cash flow pressure.
Why the AI Earnings Calendar Itself Is a Supply Chain Signal

The value of the AI earnings calendar is not just that it tells you when results will be released. Its real value is that it helps you validate the AI theme in sequence. Samsung provides the first signals on HBM and memory pricing. ASML and TSMC validate equipment demand, advanced-node capacity, and CoWoS. Tesla tests AI applications. Alphabet and Microsoft then show whether AI CAPEX is actually becoming cloud revenue, enterprise demand, and commercial AI adoption. That sequence matters more than any single EPS figure.
The best way to read the calendar is to place the six companies into one chain. Samsung represents HBM, DRAM, NAND, and server memory. ASML represents EUV, DUV, and fab expansion. TSMC represents advanced nodes, HPC, and CoWoS. Tesla represents the shift from compute infrastructure toward autonomous driving, robotics, and energy storage. Alphabet represents Google Cloud, AI search, and advertising monetization. Microsoft represents Azure, AI ARR, and enterprise AI commercialization.
| Company | Earnings / Call Date | Value Chain Position | Key Metrics | Most Important Question |
|---|---|---|---|---|
| Samsung | Guidance already released; 2Q26 call on July 30 | HBM and memory | HBM, DRAM/NAND, inventory | Can AI memory strength continue? |
| ASML | July 15, 2026 | Semiconductor equipment | EUV, DUV, orders, full-year guidance | Are fabs still expanding? |
| TSMC | July 16, 2026 | Advanced process and CoWoS | HPC, 3nm/5nm, margin | Can AI chip deliveries stay smooth? |
| Tesla | After market close on July 22, 2026 | AI applications and energy storage | Deliveries, energy storage, FSD, robotaxi | Can AI narratives turn into business results? |
| Alphabet | July 22, 2026 | Cloud, search, AI platform | Google Cloud, ads, CAPEX | Is AI strengthening both search and cloud growth? |
| Microsoft | July 29, 2026 | Cloud and enterprise AI | Azure, AI ARR, RPO, CAPEX | Is enterprise AI still commercializing at scale? |
This calendar also helps you avoid a common mistake: treating every AI-related company as the same kind of company. Samsung’s question is whether HBM supply and demand remain tight. ASML’s question is whether customers are still ordering lithography systems. TSMC’s question is whether advanced nodes and CoWoS can support AI chip delivery. Microsoft and Alphabet, by contrast, must answer whether AI infrastructure investment is truly turning into revenue. These are different questions and should not be judged with the same EPS lens.
Summary: The AI earnings calendar is not just a schedule. It is a validation chain that runs from supply to demand, from hardware to software, and from capital spending to revenue realization. Read in sequence, it gives you a clearer view of whether the AI theme still holds: whether memory remains strong, whether equipment and fabs are still expanding, whether chip delivery capacity is intact, whether AI applications are progressing, and whether cloud providers can convert CAPEX into revenue and cash flow. That approach is much more useful than reading each company’s earnings in isolation.
Samsung First: Is AI Server Demand Still Driving HBM and Memory Profits?
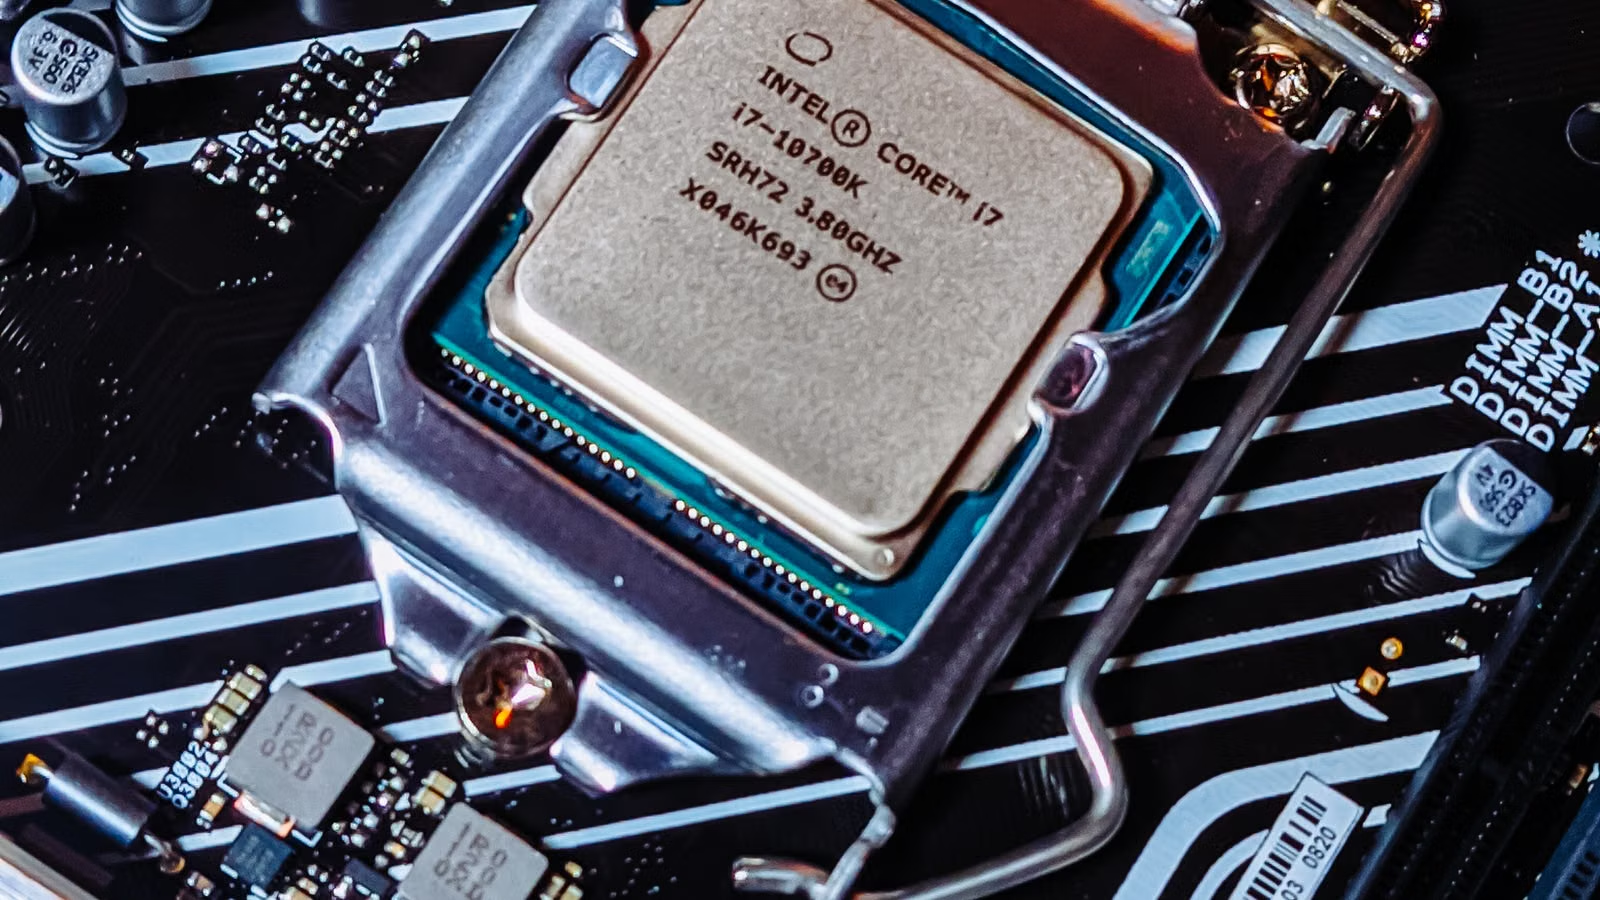
Samsung is the first major piece of the 2026 AI earnings calendar because it gives the earliest read on HBM and the memory cycle. When you look at Samsung’s earnings, the key is not just how high operating profit is. You need to judge whether that profit improvement comes from HBM, server DRAM, NAND pricing, lower inventory, or non-recurring factors. The AI memory story becomes much more durable only if high-end HBM share and pricing strength improve at the same time.
Samsung Electronics has already released Q2 2026 earnings guidance, showing consolidated sales of approximately KRW 171 trillion and operating profit of approximately KRW 89.4 trillion. Those are very strong figures, but the guidance alone does not answer everything. Segment-level profitability, HBM customer mix, memory pricing, and the performance of foundry or device-related businesses still need to be confirmed in the full earnings release and conference call.
Samsung’s full 2Q26 Earnings Conference Call is scheduled for 10:00 a.m. KST on July 30, 2026. You should pay close attention to management’s comments on HBM3E and HBM4 progress, advanced HBM customer qualification, server DRAM demand, NAND ASP, inventory days, and second-half supply-demand conditions. If management focuses only on broad memory price improvement without clearly addressing high-end HBM share or customer structure, the market may still question the sustainability of earnings strength.
| Metric | Related Business | Why It Matters | Potential Impact |
|---|---|---|---|
| HBM shipments and qualification | AI memory | Determines whether Samsung is truly gaining traction in high-end AI supply chains | Affects valuation premium |
| Server DRAM | Data-center memory | Reflects cloud provider demand for AI servers | Affects revenue and margins |
| NAND ASP | SSDs and enterprise storage | Shows whether the storage price cycle is continuing | Affects earnings leverage |
| Inventory levels | Memory cycle | Helps judge whether price increases are healthy | Affects second-half guidance |
| Customer concentration | HBM business | Shows order stability and pricing power | Affects risk discount |
| Gross margin | Overall semiconductor business | Shows whether price increases are reaching the income statement | Affects stock reaction |
Strong guidance also does not guarantee a strong stock reaction. Reuters reported that after Samsung released strong Q2 guidance, the market still worried about whether AI infrastructure demand could remain durable, and the stock faced pressure. This is a reminder that earnings season is really about expectation gaps. If the market has already priced in HBM price strength and AI memory upside, the official numbers have to deliver something even stronger to justify a further rerating.
Summary: Samsung’s earnings validate the AI memory chain, but operating profit alone is not enough. You need to know whether HBM is actually getting into high-end customer supply chains, whether server DRAM and NAND pricing can remain firm, whether inventories are staying under control, and whether customer demand is stable. The more clearly Samsung can show that profit growth is coming from high-quality AI memory demand rather than a simple cyclical price rebound, the more likely the market is to trust that AI server demand is still supporting the memory cycle.
ASML and TSMC Take Over: Can Advanced Nodes and CoWoS Support AI Chip Delivery?
ASML and TSMC are the core supply-chain checkpoints in the AI earnings calendar. ASML reflects whether fabs are still willing to expand capacity, while TSMC shows whether advanced nodes, HPC demand, and CoWoS packaging can turn AI chip orders into actual deliverable products. If equipment orders, advanced-node demand, and packaging capacity all remain strong, the market is more likely to believe that AI CAPEX is backed by real demand.
For ASML, the key is not just quarterly EPS but fab expansion confidence. ASML Q1 2026 financial results reported Q1 net sales of €8.8 billion and a gross margin of 53.0%, while guiding for Q2 net sales of €8.4 billion to €9.0 billion and a gross margin of 51% to 52%. ASML also said that AI infrastructure investment is pushing chip demand beyond supply and that customers are accelerating expansion plans for 2026 and beyond.
When you analyze ASML, you need to read EUV, DUV, bookings, installed-base service, and export restrictions together. EUV represents cutting-edge process expansion, while DUV still matters for mature nodes, advanced packaging, and parts of the broader manufacturing chain. Strong orders mean customers are still committing capital to demand several years out. Weak orders could suggest that fabs are becoming more cautious about the pace of AI demand. ASML’s earnings often show supply-chain confidence earlier than chip companies themselves.
TSMC is the next key checkpoint because it determines whether AI chips can actually be delivered. TSMC’s Second Quarter 2026 Earnings Conference will be held on July 16, 2026. Investors will focus on HPC and AI demand, 3nm and 5nm utilization, gross margin, CoWoS expansion, and customer order visibility. AI chips are not shipped just because they are designed. They still need wafer production, advanced packaging, testing, HBM integration, and server-level assembly before they can be deployed.
CoWoS is one of the most important terms in this AI earnings season. Put simply, it is an advanced packaging approach that allows GPUs or ASICs to integrate efficiently with HBM. Advanced nodes determine how powerful a chip can be. CoWoS determines how that chip and high-bandwidth memory become a deliverable system. If CoWoS capacity is constrained, AI accelerator deliveries can still be delayed even when cloud providers are spending aggressively and chip designers have strong demand.
| Company | Value Chain Role | Core Metrics | Positive Signal | Risk Signal |
|---|---|---|---|---|
| ASML | Semiconductor equipment | EUV/DUV, orders, full-year guidance | Customers are accelerating expansion plans | Export restrictions or weaker bookings |
| TSMC | Advanced process and packaging | HPC, 3nm/5nm, CoWoS | Strong AI chip demand and stable margins | Packaging bottlenecks or weaker customer orders |
| Shared relevance | Upstream AI supply chain | Equipment and capacity | Confirms AI CAPEX is real | Highly sensitive to cycle changes |
Summary: ASML and TSMC jointly determine whether the AI chip supply chain can move from order books to actual deliveries. ASML tells you whether fabs are still willing to buy equipment. TSMC tells you whether advanced nodes, HPC demand, and CoWoS capacity can support AI chip output. Looking only at chip-design company orders is not enough, because true delivery capability depends on whether equipment, wafer production, advanced packaging, and HBM integration all scale together.
Tesla Must Be Read Separately: Deliveries, Energy Storage, and AI Expectations Are Not the Same Thing
Tesla occupies a special place in the AI earnings calendar because it is neither a typical cloud provider nor a pure semiconductor supply-chain company. When you read Tesla’s Q2 earnings, you should separate three layers: short-term vehicle deliveries and automotive margins, energy storage growth and profitability, and the longer-term AI narrative around FSD, robotaxi, and Optimus. In the near term, financial performance is still driven mainly by cars and storage. The AI narrative influences the valuation range more than the current quarter’s income statement.
Tesla Q2 2026 production, deliveries and deployments showed that Tesla produced more than 450,000 vehicles in Q2, delivered 480,126 vehicles, and deployed 13.5 GWh of energy storage products. Tesla also made clear that deliveries and storage deployments are only operating metrics and do not by themselves represent quarterly financial results. Net income and cash flow will still depend on the full Q2 report.
Tesla’s full Q2 financial results will be released after market close on July 22, 2026, with management Q&A scheduled the same day. The main items to track are automotive gross margin, ASP, costs, mix, energy storage margin, operating expenses, capital expenditures, and free cash flow. Even if deliveries are strong, the market can still reassess the quality of earnings if pricing remains under pressure, costs do not improve enough, or storage margins stay volatile.
Tesla’s AI narrative includes FSD, robotaxi, Dojo and AI compute, Optimus, and vehicle-side AI. That makes Tesla very different from Microsoft or Alphabet. Cloud providers show AI returns through cloud revenue, subscriptions, and enterprise demand. Tesla’s AI return depends much more on real-world driving data, fleet size, regulatory approval, safety validation, software monetization, and the pace of autonomous driving commercialization. You cannot evaluate Tesla with a simple cloud-revenue framework.
Six questions to focus on in Tesla’s Q2 earnings:
- Are automotive margins stabilizing, and is pricing pressure easing?
- Is delivery growth coming from real demand or from incentives and inventory adjustments?
- Can storage deployment growth translate into stable gross margins?
- Is there any meaningful update on FSD adoption, subscription revenue, or regulation?
- Is robotaxi moving into verifiable operations rather than remaining a narrative?
- Can AI- and robotics-related CAPEX be supported by cash flow?
| Observation Layer | Key Question | Stock Impact |
|---|---|---|
| Automotive core business | Deliveries, ASP, gross margin | Determines short-term earnings quality |
| Energy storage | Deployment volume, margin, backlog | Determines credibility of the second growth curve |
| AI software | FSD, robotaxi, vehicle AI | Determines long-term valuation elasticity |
| Robotics | Optimus progress | Influences long-term narrative rather than near-term earnings |
Summary: Tesla’s earnings need to be separated into distinct parts. Automotive and energy storage drive short-term financials. FSD, robotaxi, and robotics shape long-term upside expectations. Strong deliveries do not automatically mean strong profits, and a strong AI narrative does not mean cash flow has already caught up. To understand Tesla’s role in the AI earnings calendar, the main question is whether it can show AI moving from technological promise to business application, not just how many vehicles it delivered in a single quarter.
Alphabet and Microsoft Close the Sequence: Can AI CAPEX Turn Into Cloud Revenue?
Alphabet and Microsoft are the closing validation points in the AI earnings calendar because they determine whether the market still believes AI CAPEX can be converted into cloud revenue, enterprise subscriptions, and durable cash flow. Samsung, ASML, and TSMC validate the supply side. Tesla validates applications. Alphabet and Microsoft answer the most important demand-side question: are customers still willing to pay for AI infrastructure and AI services?
Alphabet’s main issues are Google Cloud, AI search, and CAPEX pressure. Alphabet’s Q1 2026 results showed that Google Cloud revenue grew 63% to $20.0 billion, driven by enterprise AI Solutions, enterprise AI Infrastructure, and core GCP services. In the Q2 call, the market will want to know whether that cloud growth can continue and whether AI search is strengthening rather than weakening the economics of the search business.
Alphabet’s special risk is that AI is both an opportunity and a pressure point. On one hand, Gemini, AI infrastructure, and enterprise AI solutions can accelerate Google Cloud. On the other hand, AI Overviews and generative search could change the structure of search clicks and ad distribution. When reading Alphabet’s earnings, you should not look only at cloud growth. You should also look at Search & other, YouTube, subscriptions, CAPEX, free cash flow, and management’s explanation of AI search monetization.
Microsoft is a stronger benchmark for enterprise AI commercialization. Microsoft Cloud and AI strength fuels third quarter results reported FY2026 Q3 revenue of $82.9 billion, up 18%; Microsoft Cloud revenue of $54.5 billion, up 29%; Azure and other cloud services growth of 40%; and AI business annual revenue run rate of more than $37 billion, up 123%. Those figures make Microsoft one of the clearest indicators of real enterprise AI demand.
For Microsoft, the next question is not whether it has AI exposure, but whether AI continues to drive Azure growth, Microsoft 365 Copilot adoption, enterprise subscriptions, RPO, and commercial bookings. You should pay attention to how management describes data-center CAPEX, GPU deployment efficiency, inference costs, tokens per dollar, depreciation, and free cash flow. Even if Azure remains strong, heavy CAPEX and depreciation could still create valuation debate.
| Company | Revenue Metrics | Cost Metrics | AI Commercialization Signal | Biggest Risk |
|---|---|---|---|---|
| Alphabet | Google Cloud, Search, YouTube | CAPEX, power, data centers | Gemini, AI infrastructure, enterprise AI | AI search changes the ad ecosystem |
| Microsoft | Azure, AI ARR, Microsoft Cloud | CAPEX, depreciation, GPU costs | Copilot, Azure AI, RPO | AI payback period becomes longer |
Summary: Alphabet and Microsoft come last because they determine whether AI infrastructure investment is entering the revenue-recognition phase. Alphabet must prove that AI can drive cloud growth while preserving the search advertising ecosystem. Microsoft must prove that Azure and enterprise AI are still monetizing at scale. The real question is not whether the AI narrative sounds strong. It is whether cloud revenue, AI ARR, CAPEX, free cash flow, and guidance all point in the same direction.
How to Read Market Reactions Before and After Earnings: Why Can Good Results Still Lead to a Sell-Off?
The AI earnings calendar gives you observation windows, not trading answers. Good earnings can still lead to a sell-off because stock reactions depend on expectation gaps, guidance, valuation, CAPEX returns, and crowded positioning. If the market has already priced in HBM price gains, cloud revenue acceleration, or expanding AI CAPEX, then the official earnings release may still disappoint unless it goes meaningfully beyond those expectations.
Earnings announcements usually contain two layers of information. The first layer is fast data: revenue, EPS, gross margin, CAPEX, cash flow, and next-quarter guidance. The second layer is slower-moving signals: management tone on the earnings call, order visibility, customer demand, supply bottlenecks, and explanations of AI ROI. Recent research on price jumps after earnings announcements also suggests that earnings announcements can trigger rapid repricing in both the reporting company and related stocks, especially in after-hours trading.
| Earnings Result | Guidance Change | CAPEX Change | Possible Market Reaction | What Investors Should Watch |
|---|---|---|---|---|
| Beats expectations | Raised | Justified | Higher probability of a positive reaction | Is demand real? |
| Beats expectations | Unchanged | Stable | Possible spike then pullback | Were expectations already too high? |
| In line | Cautious | Higher | More likely to be volatile | Is ROI being questioned? |
| Misses expectations | Lowered | Lowered | Risk appetite may weaken | Is the cycle turning? |
| Strong profit | Weak cash flow | Sharply higher | Greater valuation debate | What about depreciation and payback? |
When trading activity increases around earnings, transaction costs matter as well. The cost of trading U.S. stocks usually includes more than commission. It may also include platform fees, external institution fees, trading activity fees, and order-execution-related costs. Biya charges US$0 commission for U.S. stock trading, while platform fees, external institution fees, and other charges are shown through U.S. stock trading fees and the order display. Service availability depends on your location, identity verification result, platform rules, and applicable laws and regulations.
If you want to track pre-market and after-hours moves around earnings, it is more useful to build a watchlist first through U.S. stock information rather than reacting only to social-media headlines. A common mistake during AI earnings season is to assume that strong reported results guarantee a stock rally, or that an after-hours drop means fundamentals have deteriorated. A better approach is to compare results, guidance, valuation, CAPEX, and market expectations together.
Summary: Stock reactions during AI earnings season are essentially a repricing of expectations. Strong results without strong guidance can still lead to declines. Heavy CAPEX without support from cloud revenue and cash flow can also be viewed as a risk. You should not treat earnings dates as direct buy-or-sell signals. Instead, use each report as a validation window to see whether a company is providing enough evidence that AI investment is becoming a sustainable return.
How to Put All Six Companies Into One AI Earnings Watchlist
The most practical way to read the 2026 AI earnings calendar is to sort companies by date, group them by their place in the value chain, and then use one common set of questions for cross-validation. Samsung is about HBM. ASML is about equipment orders. TSMC is about CoWoS and advanced manufacturing. Tesla is about AI applications. Alphabet and Microsoft are about cloud revenue and CAPEX returns. These six companies are not isolated events. They form a continuous chain of validation.
You can read the sequence through a three-layer framework. The first layer is supply: whether Samsung, ASML, and TSMC still show tight AI chip and server supply conditions. The second layer is application: whether Tesla can show that autonomous driving, robotaxi, storage, and robotics expectations are moving beyond a long-term story. The third layer is demand: whether Alphabet and Microsoft can prove that cloud customers, enterprise customers, and AI workloads are still willing to spend.
The final view can be reduced to three questions:
- Does AI demand still exceed supply?
- Are supply-chain bottlenecks easing or becoming worse?
- Can CAPEX be converted into revenue, profit, and cash flow?
| Company | What You Should Check First | Second-Level Metrics | Often Overlooked Risk | How to Verify After Earnings |
|---|---|---|---|---|
| Samsung | HBM and operating profit | DRAM/NAND ASP, inventory | AI memory strength may already be priced in | Use the call to confirm customers and pricing |
| ASML | EUV/DUV orders | Full-year guidance, export controls | Fab expansion pace may change | Watch bookings and customer commentary |
| TSMC | HPC and CoWoS | Gross margin, advanced nodes | Packaging bottlenecks can restrict delivery | Compare capacity plans with customer orders |
| Tesla | Deliveries and storage | FSD, robotaxi, margin | AI narrative may run ahead of financials | Focus on cash flow and real deployment |
| Alphabet | Google Cloud | Search ads, CAPEX | AI search may change click economics | Watch cloud growth and ad performance |
| Microsoft | Azure and AI ARR | RPO, Copilot, CAPEX | AI payback period may lengthen | Watch guidance and cash flow explanations |
Earnings season is information-dense, and pre-market and after-hours volatility can move quickly. Investors often need to track company announcements, market prices, order types, and cost structures at the same time. You can use Biya to follow U.S. stocks, Hong Kong stocks, and digital assets, and, subject to platform rules and local regulations, move further through register an account or download the app. Biya is a global multi-asset trading wallet that supports U.S. stocks, Hong Kong stocks, and digital asset trading, while also supporting conversion between USDT and major fiat currencies such as USD and HKD. Before trading, you should still rely on platform rules, order details, and applicable regulatory requirements rather than treating any single earnings event as a certain opportunity.
Summary: These six companies form an AI value-chain validation path rather than six unrelated earnings events. Samsung validates memory. ASML and TSMC validate upstream capacity. Tesla validates AI applications. Alphabet and Microsoft validate cloud revenue and enterprise AI commercialization. Putting them into one watchlist makes it easier to answer the real question behind the 2026 AI earnings season: is the AI theme still supported by real demand, deliverable supply, and sustainable cash flow?
FAQ
Which companies matter most in the 2026 AI earnings calendar?
The most important companies in the 2026 AI earnings calendar are Samsung, ASML, TSMC, Tesla, Alphabet, and Microsoft. They represent HBM and memory, semiconductor equipment, advanced process and CoWoS, AI applications, cloud and search, and enterprise AI commercialization. Together, they provide a broad view of whether the AI theme is still intact.
Why do Samsung’s earnings matter for AI memory stocks?
Samsung’s earnings influence the market’s view of HBM, DRAM, and NAND supply-demand conditions. You should focus on HBM share, server DRAM pricing, NAND ASP, inventory levels, and customer qualification. Strong operating profit alone is not enough. The real question is whether pricing power and demand can remain durable.
Why should investors watch CoWoS in TSMC’s earnings?
CoWoS matters because it affects whether AI chips can be packaged and delivered at scale. AI GPUs and ASICs need not only advanced-node manufacturing but also efficient integration with HBM. If CoWoS capacity is tight, customer orders and shipment timing can both be affected.
Who is a better indicator of AI cloud revenue, Microsoft or Alphabet?
Both Microsoft and Alphabet are important, but they reflect different parts of AI cloud monetization. Microsoft is more closely tied to Azure, AI ARR, Copilot, and enterprise AI commercialization. Alphabet is more connected to Google Cloud, AI search, Gemini, and advertising monetization. In both cases, CAPEX and free cash flow still matter.
In Tesla’s AI earnings story, should investors focus on cars or robots?
Both matter, but near-term financial performance still depends mainly on vehicle deliveries, automotive gross margin, and the energy storage business. FSD, robotaxi, and Optimus are more relevant to long-term valuation expectations. Those factors become more financially meaningful only when they show verifiable commercial progress.
What are the main risks of short-term trading during AI earnings season?
The main risks are expectation gaps, after-hours price jumps, liquidity changes, and transaction costs. Strong earnings do not always lead to stock gains, and weak earnings do not always mean further declines. Before trading, you should evaluate your risk tolerance, order types, fee structure, and local regulatory requirements.
*This article is provided for general information purposes and does not constitute legal, tax or other professional advice from BiyaPay or its subsidiaries and its affiliates, and it is not intended as a substitute for obtaining advice from a financial advisor or any other professional.
We make no representations, warranties or warranties, express or implied, as to the accuracy, completeness or timeliness of the contents of this publication.
Related Blogs of

What to Watch in ASML Earnings: EUV, DUV, Backlog, and China Market Risk


ASML Q2 Earnings Preview: Can AI Chip Demand Continue to Support EUV Orders?


Samsung’s Strong Earnings but Falling Share Price: Has the AI Storage Rally Peaked?



Choose Country or Region to Read Local Blog
 Australia
 Austria
 Belgium
 Canada
 Cyprus
 Czech Republic
 Denmark
 Estonia
 Finland
 France
 Germany
 Greece
 Hong Kong
 India
India Indonesia
 Ireland
 Italy
Italy Japan
Japan Latvia
 Lithuania
 Luxembourg
 Malaysia
 Malta
Malta Morocco
 Nepal
Nepal Netherlands
 New Zealand
 Norway
 Pakistan
 Philippines
 Poland
 Portugal
 Romania
 Singapore
 Slovakia
 Slovenia
 South Africa
 South Korea
 Spain
Spain Sweden
 Thailand
 The United States
 Turkey
 United Arab Emirates
 United Kingdom
 Vietnam
Contact Us




BIYA GLOBAL LLC is registered with the Financial Crimes Enforcement Network (FinCEN), an agency under the U.S. Department of the Treasury, as a Money Services Business (MSB), with registration number 31000218637349, and regulated by the Financial Crimes Enforcement Network (FinCEN).
BIYA GLOBAL LIMITED is a registered Financial Service Provider (FSP) in New Zealand, with registration number FSP1007221, and is also a registered member of the Financial Services Complaints Limited (FSCL), an independent dispute resolution scheme in New Zealand.