
Which Company Depends More on Nearline HDDs: Seagate (STX) or Western Digital (WDC)?




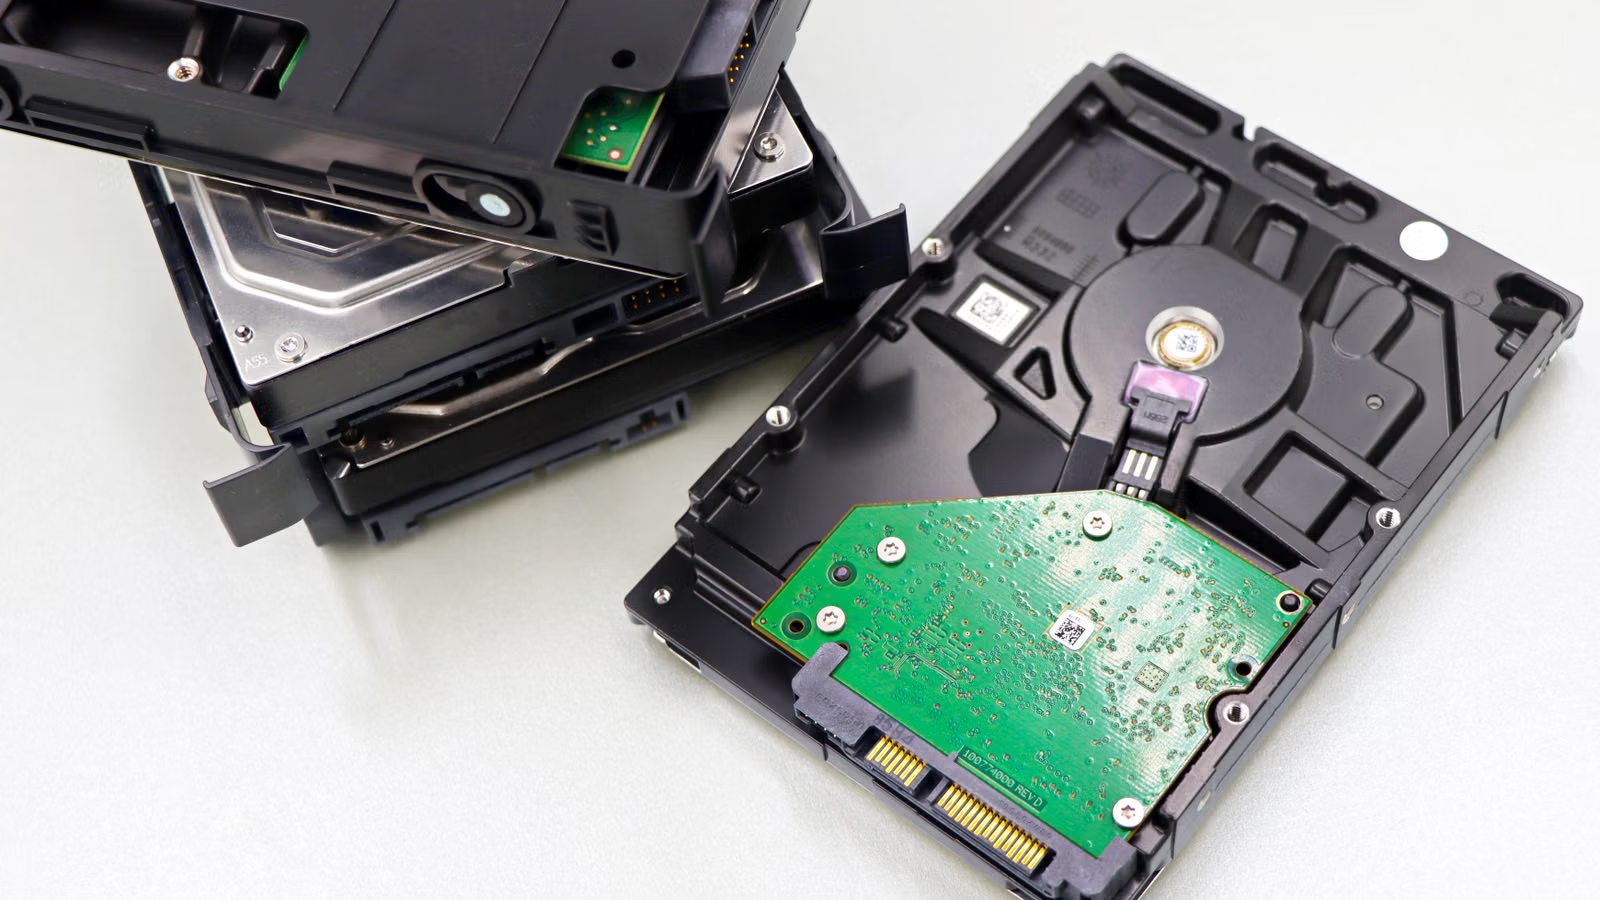
Based on the latest revenue structure, Western Digital (WDC) has a more concentrated exposure to Nearline HDDs. Based on shipment structure and technology roadmap, Seagate (STX) is also deeply tied to Nearline HDDs. WDC’s Cloud revenue share is higher, meaning its financials are more directly affected by cloud data-center HDD demand. STX has a very high nearline EB shipment share, and its HAMR / Mozaic technology roadmap is more prominent. When comparing the two companies, you should not only ask which one is an HDD company. You need to separate revenue, shipments, technology, and customer concentration.
Key Takeaways
- WDC currently has a higher Cloud revenue share, making its Nearline HDD exposure more concentrated.
- STX also shows high dependence through its Data Center revenue share and nearline EB shipments.
- WDC looks more like a pure cloud HDD company, while STX emphasizes the mass-capacity technology roadmap.
- AI data-center demand benefits both companies, but also amplifies customer concentration and cycle risk.
- Comparing STX and WDC requires tracking revenue share, EB shipments, ASP, and technology progress.
Which Company Depends More on Nearline HDDs? Start by Defining “Dependence”
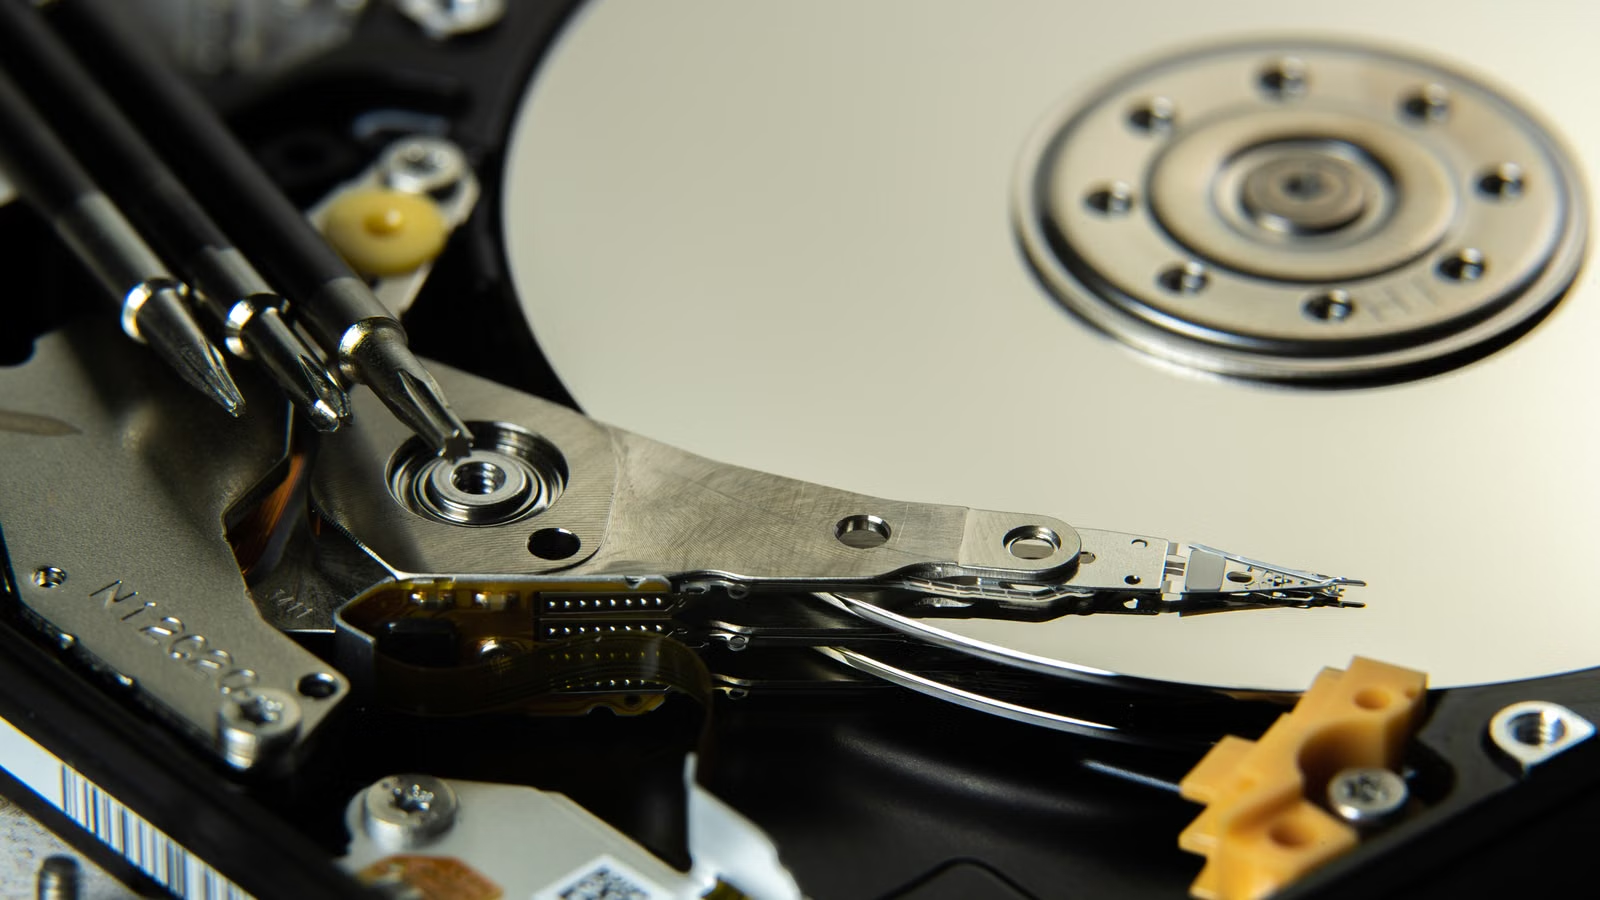
If you measure dependence by revenue concentration, WDC depends more on Nearline HDDs. If you measure it by shipment structure and technology roadmap, STX is also highly dependent. This question cannot be answered simply with “Seagate” or “Western Digital,” because the two companies use different reporting categories: WDC reports Cloud, Client, and Consumer; STX reports Data Center and Edge IoT. The right way is to assess revenue, shipments, technology roadmap, and customer structure separately.
WDC’s dependence is easiest to see through Cloud revenue. After Western Digital completed the separation of its hard drive and Flash businesses in 2025, WDC continued to operate the HDD business, while Sandisk took on the Flash business. WDC described itself in its 10-Q as a pure-play HDD company. After the separation, the key question for WDC became: will cloud providers and hyperscalers continue buying high-capacity enterprise HDDs?
STX’s dependence is better measured through Data Center revenue and nearline EB shipments. Seagate explains in its 10-Q that Data center mainly includes high-capacity nearline products for cloud and enterprise customers. In other words, STX’s Data Center revenue is not a vague data-center label. It is directly tied to mass-capacity data storage and Nearline HDDs.
| Dependence Metric | STX | WDC | Initial View |
|---|---|---|---|
| Revenue structure | Data Center: 80% | Cloud: 89% | WDC is more concentrated |
| Shipment structure | Nearline: 175.4 EB; total HDD: 199.4 EB | Cloud exabytes up 36% YoY | Both are highly exposed |
| Technology roadmap | HAMR / Mozaic 4+ is more prominent | ePMR / UltraSMR / HAMR in parallel | STX has a stronger technology narrative |
| Customer structure | Cloud and enterprise data-center customers | Cloud and hyperscaler customers | Both are concentrated |
| Investment label | Mass-capacity HDD | Cloud HDD / AI storage | WDC is purer; STX is more technology-driven |
So the answer should be two-layered: by financial revenue share, WDC depends more on Nearline HDDs; by business substance, both STX and WDC are highly dependent on high-capacity HDDs for cloud data centers. WDC’s higher Cloud revenue share means its revenue volatility is more directly tied to cloud HDD demand. STX’s nearline shipment data is clearer, showing that it is also deeply tied to this market through high-capacity HDD shipments and technology upgrades. To judge which company is more dependent, do not stop at company labels. Track revenue, EB shipments, ASP, gross margin, and order visibility from major customers.
Why Have Nearline HDDs Become the Shared Core of STX and WDC?

Nearline HDDs have become the shared core of STX and WDC because AI data centers need more than GPUs, HBM, and SSDs. They also need massive amounts of data capacity that can be stored for long periods at low cost. A Nearline HDD is not a PC hard drive. It is a high-capacity enterprise hard drive used for cloud data centers, object storage, data lakes, backups, logs, model data, and inference data retention. AI increases both the amount of data and the length of time that data needs to be stored.
AI workloads generate many types of data: training datasets, model checkpoints, inference logs, image and video assets, user interaction data, vector retrieval data, and compliance archives. Not all of these require SSD-level low-latency access. Large amounts of warm and cold data care more about cost per terabyte, supply scale, long-term reliability, and rack-level capacity density. These are the core strengths of Nearline HDDs.
In Seagate’s fiscal Q3 2026 results, the company said AI applications amplify data creation and support sustained storage demand. Seagate also reported Revenue of $3.11 billion, non-GAAP gross margin of 47.0%, and free cash flow of $953 million. WDC also emphasized in its fiscal Q3 2026 results that almost every AI workload creates data that needs to be stored durably and cost-effectively on HDDs. Its Revenue of $3.34 billion increased 45% year over year, with non-GAAP gross margin reaching 50.5%.
| AI Data Type | More Common Storage Layer | Meaning for STX / WDC |
|---|---|---|
| Training datasets | Nearline HDD + SSD cache | Drives high-capacity HDD procurement |
| Inference logs | Nearline HDD | Increases continuous writes and long-term retention |
| Model checkpoints | HDD / SSD tiering | Both capacity and access speed matter |
| Video, image, and audio data | Nearline HDD | Sensitive to cost per TB |
| Hot data retrieval | SSD / Flash | Not the main battlefield for STX / WDC |
The value of Nearline HDDs is not single-drive speed. It is TCO. For hyperscalers, what matters is whether drives can operate reliably at the lowest cost per unit of capacity, reduce rack count, lower power consumption, and be delivered at scale on schedule. As AI moves deeper into enterprise use cases, data volume grows, and data centers need a high-capacity storage layer that is predictable, scalable, and suitable for long-term deployment.
Summary: STX and WDC both depend on Nearline HDDs because AI data centers consume not only compute power, but also data capacity. GPUs and HBM solve compute speed. SSDs solve hot-data access. Nearline HDDs solve large-scale, long-term storage. AI training, inference, logs, video and image data, and object storage all expand capacity demand, making STX and WDC increasingly dependent on the cloud data-center HDD cycle for revenue, gross margin, and free cash flow. The difference is that WDC’s financial exposure is more concentrated, while STX’s shipment structure and technology roadmap are more representative.
Why Is WDC’s Nearline HDD Exposure More Direct from Its Financial Structure?
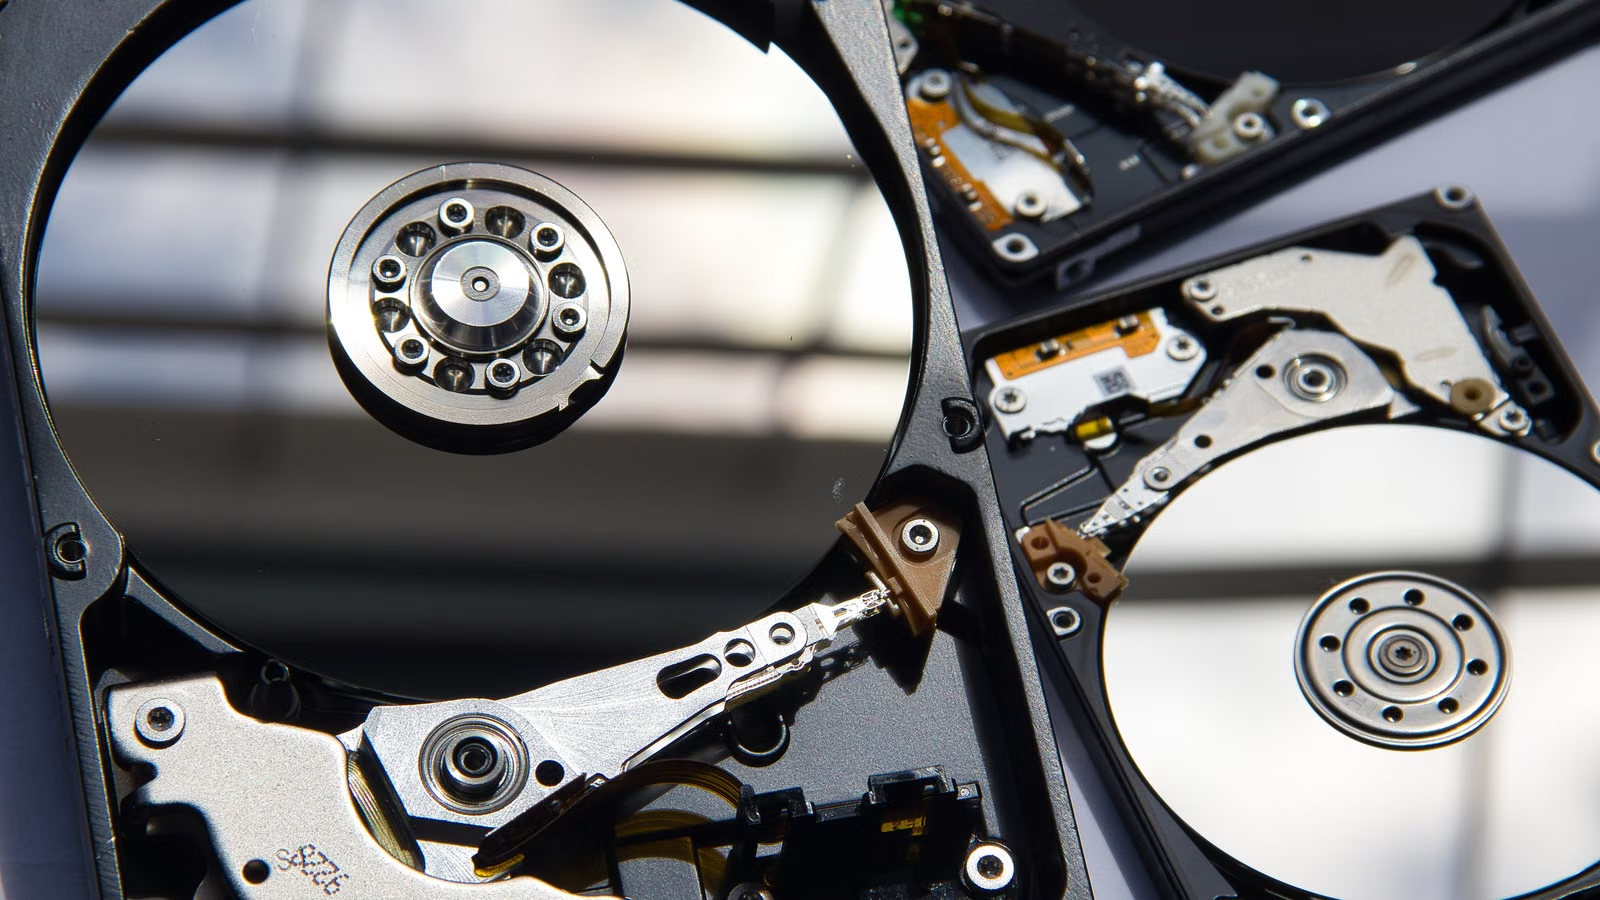
From a financial structure perspective, WDC’s Nearline HDD exposure is more direct because after the Flash spin-off, WDC is closer to a pure HDD company. Its Cloud revenue accounts for 89% of total revenue, and Cloud mainly reflects demand for high-capacity HDDs from public cloud, private cloud, and enterprise customers. When analyzing WDC, the focus is no longer the old NAND cycle. The key indicators are Cloud revenue, exabyte shipments, ASP per exabyte, gross margin, and free cash flow.
WDC states in its 10-Q that Cloud mainly consists of products for public or private cloud environments and enterprise customers. In fiscal Q3 2026, WDC’s Cloud revenue was $2.972 billion, while total revenue was $3.337 billion. Cloud revenue accounted for about 89% of total revenue. This is not ordinary consumer hard drive revenue. It is a revenue category highly tied to cloud data centers, high-capacity enterprise drives, and nearline demand.
The source of growth is even more important. WDC disclosed that Cloud revenue, representing 89% of total revenue, rose 48% year over year, driven by a 36% increase in exabytes sold and a 9% increase in average selling price per exabyte. In other words, WDC’s growth was not merely the result of an accounting category change. It came from both higher capacity shipments and better unit capacity pricing.
| WDC Metric | Fiscal Q3 2026 Data | Relationship to Nearline HDDs |
|---|---|---|
| Total revenue | $3.337 billion | Baseline HDD revenue |
| Cloud revenue | $2.972 billion | Core cloud and enterprise high-capacity HDD category |
| Cloud revenue share | 89% | Very concentrated exposure |
| Cloud revenue YoY growth | +48% | Driven by AI and cloud data-center demand |
| GAAP gross margin | 50.2% | Improved pricing and product mix |
| Free cash flow | $978 million | Cash flow release from the HDD cycle |
WDC’s margin leverage also comes from the Nearline HDD cycle. The company said margin improvement was driven by higher shipments, lower cost structure for newer-generation products, and a stronger pricing environment. If Cloud exabytes continue growing and ASP per exabyte remains strong, WDC’s earnings leverage will be more direct. If cloud customer procurement slows, the pressure on WDC will also be more direct.
Summary: WDC’s dependence on Nearline HDDs is easier to quantify because after the Flash separation, its financials are highly centered on Cloud HDDs. Cloud revenue accounts for 89% of total revenue, Cloud exabytes rose 36% year over year, and ASP per exabyte increased 9%. These metrics show that WDC’s growth engine is high-capacity HDDs for cloud data centers. When analyzing WDC, you should no longer use a traditional consumer HDD or NAND Flash framework. Focus instead on Cloud revenue, capacity shipments, unit capacity pricing, gross margin, and major customer orders.
Why Is STX Also Highly Dependent on Nearline HDDs from a Product-Roadmap Perspective?
From a product roadmap and shipment structure perspective, STX is also highly dependent on Nearline HDDs. Although WDC has a higher Cloud revenue share, STX provides more direct nearline EB data. In fiscal Q3 2026, Seagate shipped 199.4 EB of total HDD capacity, of which nearline shipments were 175.4 EB. That means nearline accounted for about 88% of total HDD shipments. STX’s capacity shipments and business growth are already mainly driven by nearline.
Seagate’s 10-Q shows that in fiscal Q3 2026, Data Center accounted for 80% of revenue, while Edge IoT accounted for 20%. The same table disclosed nearline HDD shipments of 175.4 EB, non-nearline shipments of 24.0 EB, and total HDD shipments of 199.4 EB. For investors, this data is crucial: STX is not a company that merely has some nearline business. Nearline has become the main source of its capacity shipments.
Seagate also disclosed that revenue growth was mainly driven by an increase in nearline exabytes shipped and favorable pricing actions. This means STX’s profit leverage also comes from two drivers: selling more nearline capacity and improving pricing in a tight supply-demand environment. If AI data centers continue expanding, STX benefits directly. If hyperscaler procurement timing changes, STX is also directly affected.
On technology, STX’s HAMR / Mozaic narrative is more prominent. In March 2026, Seagate announced that Mozaic 4+ supports up to 44TB and has shipped in volume to two leading hyperscale cloud providers. The significance of HAMR is not just the headline capacity number. It is about improving areal density, drive capacity, rack-level density, and data-center power efficiency, which are exactly what the nearline HDD market values.
| STX Metric | Fiscal Q3 2026 Data / Information | Analytical Meaning |
|---|---|---|
| Total revenue | $3.112 billion | HDD cycle revenue baseline |
| Data Center share | 80% | Highly dependent on cloud and enterprise data centers |
| Nearline shipments | 175.4 EB | Core capacity source |
| Non-nearline shipments | 24.0 EB | Traditional business share has declined |
| Total HDD shipments | 199.4 EB | Nearline accounts for the majority of shipments |
| Mozaic 4+ | Up to 44TB, shipped in volume to two hyperscalers | Technology roadmap tied to nearline |
Summary: STX’s Nearline HDD dependence may not exceed WDC’s by revenue share, but from shipment structure and technology roadmap, it is also a highly nearline-dependent company. Data Center accounts for 80% of revenue, and nearline shipments account for about 88% of total HDD shipments. This shows that STX’s growth engine has shifted toward high-capacity hard drives for cloud data centers. HAMR / Mozaic further strengthens STX’s link to the hyperscale nearline market. When analyzing STX, focus on nearline EB, Data Center share, pricing actions, gross margin, and the pace of HAMR ramp.
How Should You Compare STX and WDC’s Dependence on Nearline HDDs?
STX and WDC’s Nearline HDD dependence should be compared through three lenses: by revenue, WDC is more concentrated; by shipments, STX is more transparent; by strategy, STX emphasizes the HAMR technology roadmap, while WDC emphasizes Cloud revenue purity. The most balanced conclusion is that WDC’s financials are more sensitive to cloud HDD demand, while STX is equally sensitive to nearline shipments and the high-capacity technology cycle.
By revenue, WDC’s Cloud share is 89%, while STX’s Data Center share is 80%. These two metrics are not perfectly equivalent, but they point to the same broad fact: both companies’ main revenue base is now built around cloud data centers and high-capacity storage. WDC is more direct because Cloud revenue is almost the core of its financial statements. STX’s Data Center category is slightly broader because it includes systems and some enterprise scenarios, but it is still mainly based on high-capacity nearline products.
By shipments, STX is clearer. STX directly reports nearline and non-nearline EB shipments, allowing investors to calculate that nearline accounts for about 88% of total HDD shipments. WDC does not use the same nearline / non-nearline split. It reports Cloud revenue, Cloud exabyte growth, and ASP per exabyte. Therefore, STX’s nearline shipment dependence can be separated more directly, while WDC’s dependence is more concentrated in Cloud revenue.
By strategy, STX is more technology-roadmap driven, while WDC is more revenue-purity driven. STX’s Mozaic 4+ and HAMR have become core labels for how the market understands its competitiveness. WDC, meanwhile, is pursuing ePMR, UltraSMR, and HAMR in parallel. At Western Digital’s Innovation Day 2026, the company said its 40TB UltraSMR ePMR HDD had entered qualification with two hyperscale customers, and that its HAMR roadmap is intended to extend toward 100TB+.
| Comparison Dimension | STX | WDC | View |
|---|---|---|---|
| Revenue dependence | Data Center: 80% | Cloud: 89% | WDC is higher |
| Shipment dependence | Nearline: 175.4 EB, about 88% of total | Cloud exabytes up 36% YoY | STX disclosure is clearer |
| Technology roadmap | HAMR / Mozaic 4+ | ePMR / UltraSMR / HAMR | STX has a stronger technology narrative |
| Customer structure | Cloud + enterprise data center | Cloud / hyperscaler concentration | Both are concentrated |
| Valuation sensitivity | HAMR ramp, nearline pricing | Cloud share, gross margin, FCF | Different focus areas |
Summary: If you must answer in one sentence, WDC depends more on Nearline HDDs by revenue concentration, while STX is also deeply tied to nearline through shipments and technology roadmap. WDC’s higher Cloud share means its financials are more sensitive to cloud HDD demand. STX’s nearline EB share and HAMR / Mozaic roadmap mean it has stronger leverage to the high-capacity HDD technology cycle. When comparing the two companies, avoid looking only at revenue share or only at technology. You need to evaluate financials, shipments, customers, and valuation expectations together.
What Does Higher Nearline HDD Dependence Mean for Investors?
High Nearline HDD dependence is both an opportunity and a risk. The opportunity is that AI data-center demand can flow more directly into revenue, ASP, gross margin, and free cash flow. The risk is that cloud CAPEX, hyperscaler orders, price negotiations, and technology validation timelines can also affect results more directly. For investors, higher dependence means greater operating leverage, but also more concentrated volatility.
When demand is strong, STX and WDC can benefit through three transmission channels. First, cloud customers buy more high-capacity drives, increasing EB shipments. Second, tight supply and long-term procurement improve pricing conditions and lift ASP. Third, a higher mix of high-capacity products supports gross margin and cash flow. STX’s fiscal Q3 2026 non-GAAP gross margin was 47.0%, while WDC’s fiscal Q3 2026 non-GAAP gross margin was 50.5%, showing that the HDD cycle has improved meaningfully.
The risks are also concentrated. WDC disclosed in its 10-Q that its top 10 customers accounted for 71% of quarterly net revenue, while its three largest customers accounted for 17%, 15%, and 11%, respectively. Customer concentration is not necessarily bad, because large-customer procurement can improve order scale and visibility. But when procurement timing changes, deliveries are delayed, or pricing is renegotiated, financial volatility can become more visible.
STX’s risk is more tied to the nearline sales cycle. Seagate’s 10-Q notes that the sales cycle for nearline storage solutions can exceed one year and is affected by CSP procurement and deployment timelines, data-center construction, and the supply of other components. This means STX’s results depend not only on end-demand for data, but also on hyperscaler qualification, deployment, and purchase timing.
If you are watching volatile U.S.-listed storage names such as STX and WDC, trading preparation should include more than earnings and price action. U.S. stock trading costs may include not only commission, but also platform fees, external agency fees, trading activity fees, and order-related costs. Biya supports multi-asset trading across U.S. stocks, Hong Kong stocks, and digital assets. U.S. stock trading fees show that Biya charges $0 commission for U.S. stock trades, while platform fees, external agency fees, and other costs are subject to the fee center and order display. Service availability depends on the user’s location, identity verification result, platform rules, and applicable laws and regulations.
| Main Risk | Impact on STX | Impact on WDC |
|---|---|---|
| Cloud CAPEX slowdown | Data Center orders and nearline EB come under pressure | Cloud revenue growth slows |
| Pricing decline | Pricing actions weaken and gross margin falls | ASP per exabyte declines |
| Customer concentration | Hyperscaler deployment timing affects shipments | Major customers account for a high share of revenue |
| Technology delay | HAMR / Mozaic ramp falls short | UltraSMR / HAMR qualification is delayed |
| Valuation overheating | AI storage trade pulls back | Cloud HDD expectations cool |
Summary: High Nearline HDD dependence means STX and WDC can benefit more directly from AI data-center expansion, but they are also more exposed to cloud customer orders, price cycles, and technology ramp timing. When demand is strong, revenue, gross margin, and free cash flow can improve together. When demand slows, valuations and share prices may also adjust quickly. Investors should separate “strong industry demand,” “strong company results,” and “reasonable current price.” AI data growth should not be treated as the same thing as a low-risk opportunity.
How Should Ordinary Investors Track STX and WDC Nearline HDD Metrics?
For ordinary investors, the most effective way to track STX and WDC is not to look only at the “AI storage” theme, but to build a Nearline HDD metric table. For STX, focus on Data Center share, nearline EB shipments, pricing actions, gross margin, FCF, and HAMR ramp. For WDC, focus on Cloud share, Cloud exabyte growth, ASP per exabyte, customer concentration, gross margin, and UltraSMR / HAMR progress.
You can also classify STX, WDC, and other storage companies separately. STX and WDC are HDD / nearline names. SNDK is more exposed to the NAND Flash / SSD cycle. Micron includes DRAM, HBM, and NAND. If you classify all of them simply as “AI storage stocks,” you may misread their earnings drivers. STX and WDC are about cost per unit of capacity, cloud customers, and high-capacity drives. SNDK and Micron are more about memory chip pricing, SSDs, DRAM, or HBM cycles.
| Tracking Metric | STX Focus | WDC Focus |
|---|---|---|
| Revenue structure | Data Center share | Cloud share |
| Shipment structure | Nearline EB / total EB | Cloud exabyte growth |
| Pricing metric | Pricing actions, ASP trend | ASP per exabyte |
| Technology roadmap | Mozaic, HAMR, 44TB+ | ePMR, UltraSMR, HAMR |
| Financial quality | Gross margin, FCF, debt | Gross margin, FCF, customer concentration |
| Risk variable | Cloud order visibility | Top customer exposure |
A practical tracking process can be done quarterly: first check the revenue mix, then shipment or exabyte changes, then ASP and gross margin, and finally management commentary on next-quarter demand, technology qualification, and customer orders. This is more stable than only watching share-price movement, and it is more useful for judging which company is more sensitive to Nearline HDDs.
If you need to watch STX, WDC, SNDK, MU, and other U.S.-listed storage-chain companies together, U.S. stock information search can help with ticker lookup, market tracking, and preliminary screening before you combine earnings dates and fee structures into your trading preparation. Biya covers more than 190 countries and regions, supports payments in more than 40 local currencies, and supports conversion between USDT and major fiat currencies such as USD or HKD. Specific functions, fees, and availability should still be based on platform rules, account status, and local laws and regulations.
Summary: To track STX and WDC, break Nearline HDD dependence into observable indicators. For STX, focus on Data Center share, nearline EB, HAMR / Mozaic, and pricing actions. For WDC, focus on Cloud share, Cloud exabytes, ASP per exabyte, customer concentration, and free cash flow. Only by combining financial metrics, technology roadmaps, customer structure, and trading costs can you better judge which company is more sensitive to Nearline HDDs and avoid being distracted by a broad AI theme.
When adding STX and WDC to a watchlist, consider recording three layers: at the business level, Data Center / Cloud share; at the technology level, HAMR, UltraSMR, and high-capacity drive qualification progress; at the trading level, order costs, exchange rates, and execution records. Biya can be used as a multi-asset tracking tool for U.S. stocks, Hong Kong stocks, and digital assets, helping you monitor tickers, check fees, and manage order records. For further use, Biya App provides access to account, order, and applicable rule details. Public market information and fee structures can improve preparation quality, but they do not constitute investment advice or replace your own judgment on earnings, valuation, and risk tolerance.
FAQ
Which company depends more on Nearline HDD revenue, STX or WDC?
Based on the latest revenue share, WDC depends more on Nearline / Cloud HDDs because its Cloud revenue accounts for 89% of total revenue. STX’s Data Center revenue accounts for 80%, so its dependence is also high. The difference is that WDC’s revenue is more concentrated, while STX’s nearline shipments and HAMR roadmap are more prominent.
How should investors read Seagate STX’s Nearline HDD shipments?
Seagate STX’s nearline shipments are now a core metric. In fiscal Q3 2026, STX shipped 175.4 EB of nearline HDDs out of total HDD shipments of 199.4 EB, meaning nearline accounted for about 88%. Investors can combine this with Data Center revenue, pricing actions, gross margin, and HAMR ramp to assess cycle strength.
Is Western Digital WDC’s Cloud revenue the same as Nearline HDD revenue?
WDC’s Cloud revenue is not exactly the same as Nearline HDD revenue, but it is highly related. WDC Cloud mainly reflects high-capacity HDD demand from public cloud, private cloud, and enterprise customers. It is the core metric for tracking nearline HDD exposure, but investors should also consider exabyte growth, ASP per exabyte, and customer concentration.
Why does AI data-center demand support Nearline HDDs?
AI data-center demand supports Nearline HDDs because AI creates large amounts of training data, inference logs, model checkpoints, image and video content, and object storage needs. Nearline HDDs offer low cost per unit of capacity and are suitable for large-scale long-term storage, making them a beneficiary of AI data growth.
How are the Nearline HDD risks different for STX and WDC?
STX’s risks are more tied to HAMR / Mozaic ramp, Data Center orders, and nearline pricing actions. WDC’s risks are more tied to Cloud revenue share, customer concentration, and ASP per exabyte. Both companies are affected by cloud CAPEX, the AI storage cycle, and hyperscaler procurement timing.
How should ordinary investors track STX and WDC earnings?
For STX, investors should track Data Center share, nearline EB, gross margin, free cash flow, and HAMR progress. For WDC, investors should track Cloud share, Cloud exabytes, ASP per exabyte, customer concentration, and cash flow. Before trading, investors should also review platform fees, order rules, and personal risk tolerance.
*This article is provided for general information purposes and does not constitute legal, tax or other professional advice from BiyaPay or its subsidiaries and its affiliates, and it is not intended as a substitute for obtaining advice from a financial advisor or any other professional.
We make no representations, warranties or warranties, express or implied, as to the accuracy, completeness or timeliness of the contents of this publication.
Related Blogs of

Choosing a Stock Trading App: Beginner Checklist


Wire Transfer Requirements: Sender and Beneficiary Details Checklist




Choose Country or Region to Read Local Blog
 Australia
 Austria
 Belgium
 Canada
 Cyprus
 Czech Republic
 Denmark
 Estonia
 Finland
 France
 Germany
 Greece
 Hong Kong
 India
 Indonesia
 Ireland
 Italy
 Japan
 Latvia
 Lithuania
 Luxembourg
 Malaysia
 Malta
 Morocco
 Nepal
 Netherlands
 New Zealand
 Norway
 Pakistan
 Philippines
 Poland
 Portugal
 Romania
 Singapore
 Slovakia
 Slovenia
 South Africa
 South Korea
 Spain
 Sweden
 Thailand
 United States
 Turkey
 United Arab Emirates
 United Kingdom
 Vietnam