
How to Read Western Digital’s WDC Earnings: HDD Revenue, Gross Margin, Long-Term Agreements, and Cash Flow





When reading WDC earnings, do not focus only on whether EPS beats expectations. The more important question is whether HDDs are entering a higher-quality upcycle. You should first understand Western Digital’s business scope after the Flash separation, then break down Cloud revenue, nearline HDD shipments, ASP per exabyte, gross margin, long-term supply agreements, and free cash flow. This framework is useful if you follow WDC stock, AI storage, data center HDD demand, or comparisons between WDC and Seagate.
Key Takeaways
- After the Flash separation, WDC’s investment logic is more concentrated on HDDs.
- Cloud and nearline HDD demand are the main revenue drivers.
- Gross margin improvement comes from pricing, capacity, and product mix.
- Long-term agreements improve visibility but do not remove cycle risk.
- Free cash flow determines deleveraging and shareholder return potential.
What to Look at First in WDC Earnings: Start With the Post-Separation HDD Scope

The first step in reading WDC earnings is to separate the company from its old “HDD plus Flash” framework. Western Digital has completed the separation of its Flash business. After SanDisk became an independent company, WDC’s continuing operations became much closer to a data storage infrastructure company centered on HDDs. That means the current earnings focus is no longer the NAND cycle, but Cloud, nearline HDDs, exabyte shipments, ASP, gross margin, and cash flow.
This distinction matters because many investors still use the old framework to understand WDC. When they see “storage,” they may immediately think of NAND, SSDs, Flash price increases, or SanDisk’s cycle leverage. In reality, Western Digital announced the completion of its Flash business separation in February 2025, and SanDisk later completed its Nasdaq listing as an independent company. This means your WDC analysis should focus on HDD supply and demand, as well as cloud customer capital expenditure, rather than treating WDC as a full memory company.
A more practical approach is to break WDC earnings into four layers:
| Layer | Key Metrics | What You Should Judge | Common Misread |
|---|---|---|---|
| Business scope | HDD, Cloud, Client, Consumer | Whether WDC is truly focused on high-capacity HDDs | Still valuing it like a NAND company |
| Revenue quality | Cloud mix, nearline demand | Whether growth comes from data centers | Looking only at total revenue growth |
| Profit quality | GAAP / non-GAAP gross margin | Whether pricing and product mix are improving | Looking only at EPS beats |
| Cash quality | Operating cash flow, free cash flow, debt | Whether the cycle is turning into real cash | Ignoring working capital changes |
Based on the latest Q3 FY2026 earnings, WDC reported quarterly revenue of $3.337 billion, up 45% year over year. GAAP gross margin was 50.2%, non-GAAP gross margin was 50.5%, operating cash flow was $1.123 billion, and free cash flow was $978 million. The significance of these numbers is not merely that profit improved. They show that HDD supply and demand, product mix, and pricing conditions are improving at the same time.
Summary: When reading WDC earnings, the first question is not whether EPS beat consensus. The first question is whether you are using the right business framework. After the separation, WDC has shifted away from the old “HDD plus Flash” structure and toward an HDD-centered company. The key variables are now Cloud revenue, nearline HDD demand, high-capacity HDD technology, gross margin, and cash flow. If these metrics improve together, WDC may not just be benefiting from short-term storage price increases. It may be riding a capacity expansion cycle driven by AI data centers. If revenue growth mainly comes from one-quarter pricing, customer pull-ins, or non-recurring gains, the quality of the earnings should be discounted.
How to Read HDD Revenue: Cloud and Nearline Are WDC’s Main Story

When judging WDC’s revenue quality, you should focus on Cloud rather than only total revenue. Cloud revenue reflects demand from hyperscalers, AI data centers, enterprise storage, and nearline HDDs. It is the company’s most important growth source today. In its Form 10-Q, WDC disclosed that Cloud revenue accounted for 89% of total revenue in Q3 FY2026 and grew 48% year over year. This shows that WDC’s revenue leverage mainly comes from cloud and data center customers.
Cloud revenue is important because it is tied to high-capacity enterprise HDDs, not ordinary consumer hard drives. AI training, inference, logs, video, backup, object storage, and cold data archiving all increase data center demand for low-cost, high-capacity storage. GPUs and HBM solve compute and high-speed memory needs. HDDs solve long-term storage for massive data sets. In its long-term HDD value white paper, WDC also emphasizes that HDDs remain an important economic foundation for high-capacity data center storage.
Revenue growth should also be split into “volume” and “price.” WDC’s Q3 FY2026 net revenue grew 45% year over year, supported by a 34% increase in exabytes sold and a 9% increase in average selling price per exabyte. This is more meaningful than revenue growth alone because it shows WDC is not only selling more capacity, but also earning a better price per unit of capacity.
| Revenue Item | Q3 FY2026 Signal | Investment Implication |
|---|---|---|
| Total revenue | $3.337 billion | Overall business momentum remains strong |
| Cloud mix | 89% | Data centers are the main driver |
| Cloud growth | 48% YoY | Hyperscaler demand remains strong |
| Exabytes sold | Up 34% YoY | Shipped capacity is expanding |
| ASP per exabyte | Up 9% YoY | Pricing environment is improving |
| Client / Consumer | Around 11% combined | Consumer demand is no longer the core variable |
You should also pay attention to the other side of the revenue structure. When Cloud becomes such a high percentage of revenue, WDC’s reliance on a small number of large customers also increases. In Q3 FY2026, the top ten customers contributed 71% of net revenue, with three customers accounting for 17%, 15%, and 11%, respectively. This is not automatically negative, because hyperscalers are naturally the major buyers of high-capacity HDDs. But it does remind you that WDC’s growth is not driven by dispersed retail demand. It depends on large customer procurement cycles, long-term agreements, and data center expansion schedules.
Summary: WDC’s HDD revenue is not simply about whether the company sells more hard drives. The key question is whether Cloud and nearline HDD demand continue to scale. You should prioritize Cloud revenue mix, exabyte shipments, ASP per exabyte, and customer concentration. Volume and price rising together usually signal a healthier industry supply-demand setup, especially when high-capacity enterprise HDDs become the main product. But the higher the Cloud mix, the more important it becomes to track customer concentration, procurement timing, and AI capex volatility.
How to Read Gross Margin: Does a 50%+ Margin Mean the HDD Cycle Has Changed?
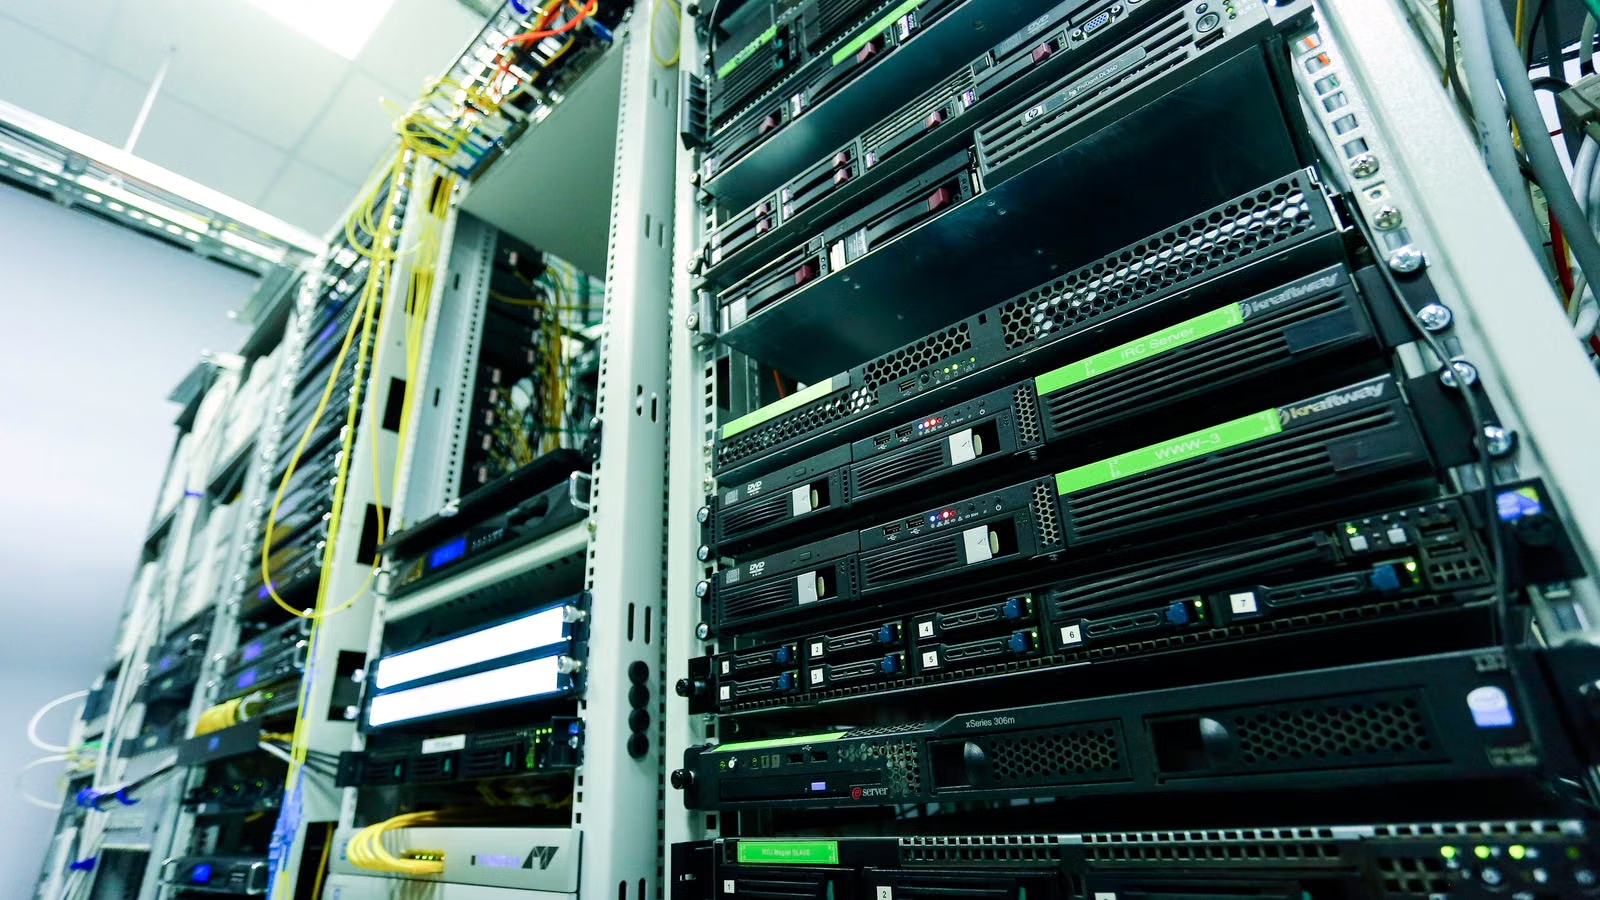
WDC’s gross margin above 50% shows that the current HDD cycle is not just a revenue recovery. Pricing, product mix, and cost structure are improving together. In Q3 FY2026, GAAP gross margin was 50.2%, and non-GAAP gross margin was 50.5%, up more than 10 percentage points year over year. To judge whether this is sustainable, you should not rely on one quarter’s number alone. You need to look at high-capacity products, UltraSMR, ePMR, customer long-term agreements, and supply discipline.
Gross margin improvement usually comes from three forces. First, product mix improves. High-capacity nearline HDDs offer stronger scale economics and customer stickiness than ordinary consumer drives. Second, ASP per exabyte rises, showing that customers are willing to pay more for capacity density, reliability, power efficiency, and lower total cost of ownership. Third, newer-generation products improve cost structure. In its 10-Q, WDC stated that gross margin improvement was mainly supported by higher shipments, lower cost structure for newer-generation products, and better pricing.
| Gross Margin Layer | Positive Signal | Risk Signal |
|---|---|---|
| Pricing | ASP per exabyte continues to rise | Price increases slow or customers push back |
| Product mix | Cloud / nearline mix increases | Consumer mix rises without strong margin |
| Technology roadmap | UltraSMR, ePMR, and HAMR qualifications progress | New technology ramps are delayed |
| Cost structure | High-capacity platforms lower unit cost | Components, yields, or supply chain costs rise |
| Supply-demand balance | Long-term agreements lock in demand | Customers reduce AI capex |
You should also distinguish GAAP from non-GAAP. GAAP gross margin is better for looking at final accounting results. Non-GAAP gross margin is more useful for tracking operating trends. WDC provided both GAAP and non-GAAP figures in Q3 FY2026, and the difference between the two was small. That suggests the gross margin improvement was not purely driven by adjustments. However, when EPS includes non-operating factors such as retained interest in SanDisk, investors should look at gross margin, operating margin, and free cash flow together.
The technology roadmap is also a medium- to long-term driver of gross margin. In its AI-era storage innovation roadmap, WDC said its 40TB UltraSMR ePMR HDD was under qualification with two hyperscale customers and was planned for mass production in the second half of 2026. HAMR was also being qualified by two hyperscale customers, with a ramp planned for 2027. If the transition to ePMR and HAMR goes smoothly, high-capacity drives may continue to support higher profit per unit of capacity.
Summary: WDC’s gross margin above 50% is a strong signal, but it should not be interpreted mechanically as proof that HDDs have fully escaped cyclicality. You need to identify the source of margin improvement. If it comes from Cloud mix, higher high-capacity product share, rising ASP per exabyte, and cost reductions, the quality is high. If it mainly comes from short-term supply tightness or one-off pricing, sustainability is more uncertain. The next key test is whether WDC can deliver on its Q4 guidance for non-GAAP gross margin of 51% to 52%.
How to Read Long-Term Agreements: Better Visibility, but Customer Concentration Still Matters
The significance of WDC’s long-term agreements is that they move part of the traditional HDD business away from purely short-cycle orders and toward more visible exabyte volume and pricing constructs. You can think of it this way: large cloud customers want to secure high-capacity HDD supply in advance, so they agree with WDC on future capacity and pricing frameworks. This helps WDC plan capacity, stabilize gross margin, and improve revenue predictability. But long-term agreements do not mean earnings are risk-free.
In its Q2 FY2026 commentary, WDC management said the company had strong visibility into 2026 HDD supply and had established multi-year agreements with some large customers. A third-party transcript of the Q2 FY2026 earnings call also noted that the agreements included purchase orders and multi-year commercial arrangements with top customers. By Q3 FY2026, management continued to highlight extended long-term visibility, while the market focused on whether WDC’s agreements covered 2028 and 2029.
Long-term agreements help WDC in three main ways:
| Impact Area | Positive Effect | What You Should Watch |
|---|---|---|
| Revenue visibility | Locks in large customer capacity demand in advance | Customer order timing may change |
| Gross margin | Pricing frameworks help stabilize profit | Price reset terms may limit upside |
| Capital expenditure | Helps capacity planning around real demand | If demand cools, expansion returns weaken |
| Customer relationship | Deepens hyperscaler partnerships | Customer concentration rises further |
| Technology qualification | New platforms can enter customer roadmaps more easily | Qualification failures can delay ramp |
But you should not simply call long-term agreements a “moat.” WDC’s top ten customers accounted for 71% of revenue, meaning the procurement plans, data center construction schedules, and AI capex decisions of a small number of customers can directly affect results. If AI data center expansion continues, long-term agreements can increase WDC’s revenue visibility. If cloud companies reduce capital expenditure, delay data center launches, or adjust their storage architecture, long-term agreements may not fully offset demand volatility.
The industry is also showing similar changes. Tom’s Hardware discussed how long-term supply agreements for SSDs and HDDs have lengthened as large customers seek to secure capacity, configurations, and pricing. This suggests that WDC is not an isolated case. AI infrastructure expansion is pushing the storage supply chain from short-order models toward stronger reservation and capacity-locking arrangements.
Summary: Long-term agreements are one of the most important quality signals in WDC earnings because they improve visibility into revenue, capacity planning, and gross margin. They also show that hyperscaler demand for high-capacity HDDs is not merely temporary inventory restocking. But long-term agreements must be analyzed together with customer concentration. Longer agreement periods mean deeper ties with large customers; higher concentration means greater sensitivity to a small group of customers’ capex plans. A reasonable conclusion is that long-term agreements improve the cycle profile, but they do not eliminate cycle risk.
How to Read Cash Flow: Free Cash Flow Determines Deleveraging and Shareholder Returns
WDC’s free cash flow is central to judging earnings quality because it answers the question: has profit turned into cash? In Q3 FY2026, WDC generated $1.123 billion of operating cash flow and $978 million of free cash flow, while net purchases of property, plant, and equipment were $145 million. For investors, this is more important than EPS alone because strong cash flow can support deleveraging, buybacks, dividends, and technology investment.
WDC’s cash flow improvement has several layers. First, revenue growth and gross margin expansion lift operating profit. Second, compared with wafer manufacturing, the HDD business has a different capital intensity profile from NAND fabs. Third, after the separation, the business is clearer, making it easier for the market to assess the sustainability of HDD cash flow. At the end of Q3 FY2026, WDC had about $2.05 billion in cash and cash equivalents and about $1.6 billion in debt, showing a significantly improved balance sheet.
| Cash Flow Item | Q3 FY2026 Signal | Investment Implication |
|---|---|---|
| Operating cash flow | $1.123 billion | Strong conversion from core business profit |
| Free cash flow | $978 million | Can support debt reduction, buybacks, and dividends |
| Capital expenditure | $145 million | HDD expansion pressure appears manageable |
| Cash and equivalents | $2.05 billion | Liquidity is relatively strong |
| Debt | $1.6 billion | Deleveraging has progressed significantly |
| Quarterly dividend | Raised to $0.15 | Management signals confidence in cash flow |
Cash flow also affects valuation. If WDC’s EPS rises but free cash flow is weak, the market may question earnings quality. If gross margin rises while free cash flow expands, valuation can more easily shift from a pure cycle-stock framework to a higher-quality cash-flow framework. Of course, strong free cash flow does not mean the stock price will necessarily rise. The market will still consider expectation gaps, peer performance, valuation multiples, and future guidance.
Trading costs also matter. If you track high-volatility U.S. stocks such as WDC and STX, earnings periods can bring large gaps, after-hours moves, and wider spreads. Your actual trading outcome depends not only on the stock price direction, but also on commissions, platform fees, external agency fees, and execution costs. If the service is available in your region, you can review Biya’s U.S. stock trading fees. Biya charges $0 commission for U.S. stock trading, while platform fees, external agency fees, and other costs are subject to the fee schedule and order page.
Summary: WDC’s cash flow should be read together with revenue and gross margin. Q3 FY2026 free cash flow was close to $1 billion, showing that the current HDD upcycle has already translated into real cash rather than just accounting profit. You should continue to watch whether free cash flow remains strong in Q4 and future quarters, as well as how the company balances debt repayment, buybacks, dividends, and R&D investment. The more stable the cash flow, the easier it is for WDC to receive a higher-quality valuation discussion. But if working capital deteriorates or gross margin falls, cash flow leverage may also shrink.
How to Read Future Earnings: Q4 Guidance, Technology Roadmap, and Cycle Inflection Points
For WDC’s next earnings report, you should verify three things: whether Q4 guidance is delivered, whether the technology roadmap is progressing as planned, and whether the HDD cycle is still expanding or becoming over-anticipated. The company’s FY2026 Q4 guidance is revenue of $3.65 billion, plus or minus $100 million; non-GAAP gross margin of 51% to 52%; and non-GAAP EPS of $3.25, plus or minus $0.15. The key question is whether actual results continue to support a “high revenue, high margin, high cash flow” profile.
The Q4 guidance itself is strong, but the market cares more about whether growth can continue. You can use the following checklist for the next earnings release:
| Tracking Item | Positive Signal | Negative Signal |
|---|---|---|
| Revenue | Above guidance midpoint with strong Cloud demand | Revenue driven by lower-margin business |
| Gross margin | Remains above 51% | Guidance is cut or pricing pressure rises |
| Cloud demand | Hyperscaler orders continue to scale | AI capex slows |
| Technology roadmap | 40TB UltraSMR ePMR qualifications progress | HAMR ramp is delayed |
| Cash flow | Free cash flow remains strong | Inventory and receivables become a drag |
| Peer validation | Seagate is also strong | Improvement is isolated to WDC |
Peer comparison is also important. Seagate’s FY2026 third-quarter earnings also showed improvements in revenue, gross margin, and free cash flow, suggesting that HDD strength is not limited to WDC alone. When comparing WDC with Seagate, do not look only at which company has higher revenue growth. You should also compare nearline shipments, gross margin, HAMR / ePMR technology paths, customer agreements, debt structure, and shareholder return timing.
The technology roadmap will determine whether WDC can turn short-term supply-demand tightness into medium- and long-term competitiveness. At Investor Day 2025, WDC focused its future strategy on high capacity, low TCO, and data infrastructure value. Going forward, you should watch whether 40TB, 60TB, and 100TB+ plans move into customer production roadmaps rather than staying as presentation narratives.
Valuation also requires discipline. If WDC’s stock price has already reflected strong expectations around AI storage and HDD shortages, the next earnings report may still trigger volatility even if the reported numbers are strong. Investors may react to the slope of margin expansion, Q4 guidance, or management language. Earnings trading is better understood through an expectation-gap framework, rather than simply counting good news. Public market information, trading rules, and fee structures are only a basis for analysis and do not constitute investment advice.
Summary: In the next WDC earnings report, the focus should not be merely to confirm that “AI drives HDD demand.” The more important task is to verify three things: whether revenue continues to exceed guidance, whether gross margin stays around or above 51%, and whether free cash flow remains strong. If technology qualifications, long-term agreement visibility, and peer results all remain positive, the quality of WDC’s HDD cycle becomes more credible. If margin expansion slows, customer concentration risk rises, or market expectations become too high, stock volatility may also increase.
If you continue to track WDC, Seagate, Micron, SanDisk, and other U.S.-listed storage companies, you need to analyze earnings, industry cycles, order visibility, and trading costs within the same framework. You can use Biya to follow U.S. and Hong Kong stock opportunities, and use its U.S. stock information search to check tickers, company information, and related stocks. When it comes to actual trading, fees, order types, execution prices, and platform rules all affect the final result. Service availability depends on your location, identity verification result, platform rules, and applicable laws and regulations. Before trading, you should fully understand earnings volatility, order execution, and your own risk tolerance. If you want to manage watchlists and trading workflows on mobile, you can download the App and review the supported services.
FAQ
Is WDC Still a NAND Flash Company?
No. After the SanDisk separation, WDC is now better analyzed as an HDD-focused company. You can still follow the broader storage cycle, but you should not directly include NAND, SSD, or SanDisk earnings leverage in WDC’s continuing operations.
Why Is Cloud Revenue Important in WDC Earnings?
Cloud revenue is important because it represents hyperscaler, AI data center, and nearline HDD demand. WDC’s current revenue growth is mainly driven by high-capacity HDD purchases from cloud customers, so Cloud mix, exabyte shipments, and ASP better reflect core business trends.
Is WDC’s Gross Margin Above 50% Sustainable?
Its sustainability depends on product mix, ASP, UltraSMR / ePMR penetration, customer long-term agreements, and cost structure. A high one-quarter margin is a positive signal, but it should still be judged alongside Q4 guidance, customer purchasing patterns, and peer results.
Can WDC’s Long-Term Agreements Reduce HDD Cycle Risk?
Long-term agreements can reduce some cycle volatility because they improve visibility into future capacity and pricing. However, they cannot eliminate customer concentration, AI capex slowdowns, technology qualification delays, or price reset risks.
What Does WDC’s Free Cash Flow Improvement Mean?
Free cash flow improvement suggests higher earnings quality and can support deleveraging, buybacks, dividends, and R&D investment. But strong free cash flow does not guarantee stock price gains. The market will also consider valuation, expectation gaps, guidance, and macro risks.
How Should Investors Compare WDC and Seagate Earnings?
WDC and Seagate should be compared across Cloud / nearline growth, gross margin, free cash flow, debt, HAMR / ePMR roadmaps, and customer long-term agreements. If both companies improve at the same time, it usually provides stronger evidence that HDD industry conditions are improving.
*This article is provided for general information purposes and does not constitute legal, tax or other professional advice from BiyaPay or its subsidiaries and its affiliates, and it is not intended as a substitute for obtaining advice from a financial advisor or any other professional.
We make no representations, warranties or warranties, express or implied, as to the accuracy, completeness or timeliness of the contents of this publication.
Related Blogs of

US to Portugal Online Money Transfer Limits: Per-Transaction Caps Explained


Online Bank-to-Bank Transfers: Account Linking, Steps, and Limits


International Wire Transfer Time: What Affects Delivery?



Choose Country or Region to Read Local Blog
 Australia
 Austria
 Belgium
 Canada
 Cyprus
 Czech Republic
 Denmark
 Estonia
 Finland
 France
 Germany
 Greece
 Hong Kong
 India
 Indonesia
 Ireland
 Italy
 Japan
 Latvia
 Lithuania
 Luxembourg
 Malaysia
 Malta
 Morocco
 Nepal
 Netherlands
 New Zealand
 Norway
 Pakistan
 Philippines
 Poland
 Portugal
 Romania
 Singapore
 Slovakia
 Slovenia
 South Africa
 South Korea
 Spain
 Sweden
 Thailand
 United States
 Turkey
 United Arab Emirates
 United Kingdom
 Vietnam