The Story Behind the NYSE Average Volume Surge


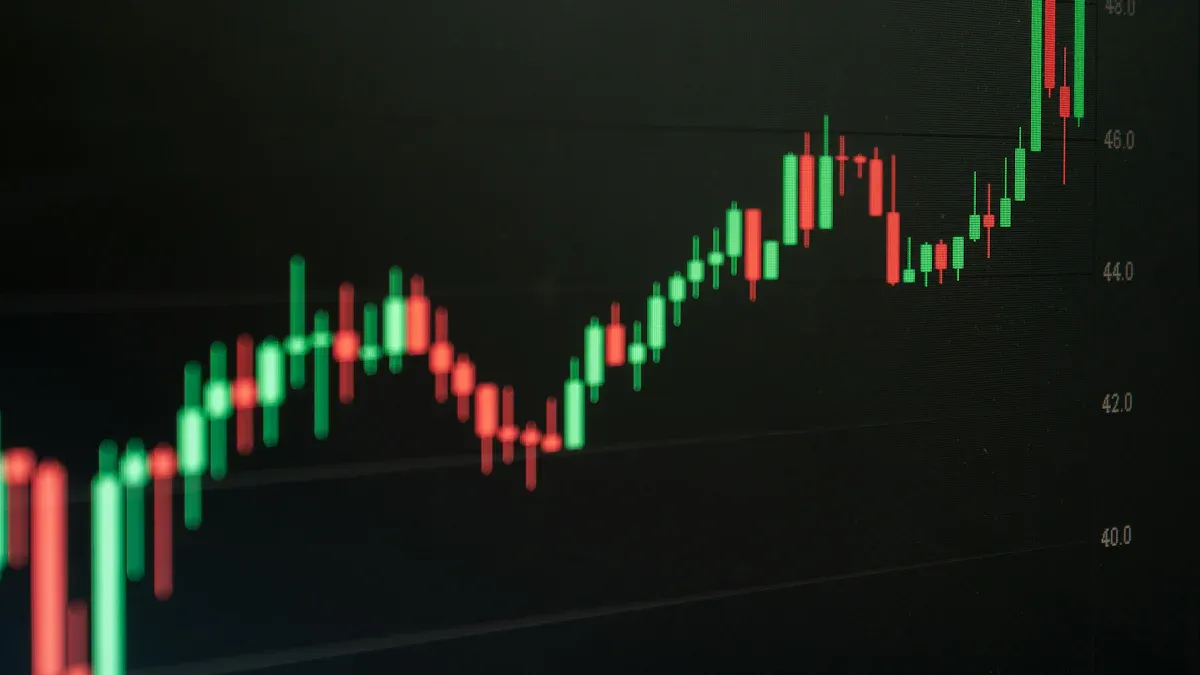
Image Source: unsplash
The 2026 NYSE average volume surge results from a convergence of three powerful forces. Pivotal macroeconomic shifts, the maturation of AI-driven trading technologies, and impactful regulatory reforms created a unique market environment. What happens when global economic uncertainty meets the most powerful trading technology in history? This confluence fueled record trading volumes. Easing monetary policy and massive AI investment provided the liquidity and catalysts for this unprecedented level of trading activity.
If you want to feel what “higher volume” means in practice, start by watching how fast the most active names move. Open BiyaPay’s U.S. stocks directory and pick a few widely traded tickers (for example, Apple / AAPL). Then compare their daily price swings during news-heavy weeks—high volume often shows up as quicker moves and sharper reversals.
Next, if you’re allocating funds across currencies before trading, use the FX converter to sanity-check your buying power in real time. For a broader overview of market entry points and tools, you can always start from the BiyaPay homepage and navigate to the stock section from there.
Key Takeaways
- Three main things caused the big increase in NYSE trading in 2026: big changes in the world economy, new AI trading tools, and new rules for the market.
- AI technology helped trading volume grow by making trades faster and smarter, letting people buy and sell more often.
- High trading volume means it is easier to buy and sell stocks, but it also means the market can change quickly and has more risks.
- Technology and AI stocks, along with energy and industrial companies, had the most trading activity due to new ideas and global changes.
Core Drivers of the 2026 Volume Surge
Image Source: pexels
The surge in U.S. stock market trades, projected to reach 90.83 billion by 2026, did not happen in a vacuum. It is the direct result of powerful, interconnected forces. These drivers provided both the reasons and the means for such a dramatic increase in trading activity, fundamentally reshaping market dynamics.
Macroeconomic Catalysts
A complex global economic environment set the stage for 2026’s high trading volumes. Geopolitical realignment and sharp policy shifts created widespread uncertainty, a key ingredient for market volatility and increased trading. Major global events fueled this environment:
- A new international order began to form as China established new strategic alliances, challenging the existing global structure.
- The United States responded by rebalancing its foreign policy, leading to new tariff structures and trade rules that disrupted established supply chains.
- This strategic trade policy saw the average U.S. tariff rate climb significantly, forcing corporations to diversify sourcing and embed new cost assumptions, which in turn created winners and losers in the stock market.
- Central banks navigated a difficult path. The Federal Reserve began a gradual easing of monetary policy to support growth, injecting liquidity into the market.
These supply-side shocks and policy shifts created distinct market trends. The following table outlines the divergent economic forecasts that traders actively responded to throughout the year.
| Economy | Inflation Forecast (2026) | GDP Growth Forecast (2026) |
|---|---|---|
| US | CPI at or above 3%; PCE average 2.7% | Rebound to 2.2% |
| UK | Slow to around 2.5% by end of year | 0.8% |
| Canada | N/A | 1.4% |
| Ireland | Average 2.2% | Domestic growth around 2.3% |
This economic divergence, combined with a slowing growth forecast for China, prompted constant portfolio reallocations as investors sought to shield themselves from risk and capitalize on regional strengths.
The Influence of AI and Algorithms
Technology provided the engine for the volume surge. The maturation of AI-driven trading platforms transformed market uncertainty into actionable trading opportunities at an unprecedented scale. Advanced financial technology platforms, exemplified by industry leaders like Biyapay, deployed a new generation of sophisticated tools. These tools empowered institutional and retail traders alike to execute strategies with incredible speed and precision.
Key AI-driven innovations that became prominent in 2026 include:
- Intelligent Execution Engines: These systems automatically select the best execution path for a trade by analyzing volatility, liquidity, and other real-time factors. This reduces costs and improves fill rates, encouraging more frequent trading.
- Predictive Analytics: Machine learning models identify early momentum shifts and potential market-moving events before they become obvious, giving traders a critical edge.
- Smart Portfolios: This disruptive technology uses AI to automatically rebalance assets, manage risk, and hedge against macroeconomic shocks, leading to more dynamic and continuous trading adjustments.
This technological leap democratized access to strategies once reserved for elite quantitative funds. The result was a market with more participants executing more trades, a primary factor behind the historic volume.
Analyzing the NYSE Average Volume
The macroeconomic and technological drivers converged to produce a remarkable outcome on the exchange floor. The nyse average volume became a daily headline, reflecting the intense level of market engagement. This was not merely noise; it was the tangible result of investors reacting to global trends and leveraging powerful new tools for trading.
The sustained increase in the nyse average volume throughout 2026 signifies a fundamental shift. It reflects a market that is more reactive, more technologically integrated, and more globally interconnected than ever before. The high volume is a direct measure of capital in motion.
This elevated trading volume indicates a highly liquid market, where buyers and sellers can transact efficiently. However, it also points to the heightened volatility and rapid shifts in sentiment that defined the year’s market trends.
Regulatory and Market Structure Reforms
Regulatory changes also played a crucial role in facilitating the 2026 volume surge. Policymakers and exchanges implemented reforms aimed at increasing market efficiency, transparency, and accessibility. These reforms lowered barriers to entry for many participants and streamlined the trading process.
Key reforms included measures to reduce transaction costs and enhance data dissemination, which directly benefits high-frequency trading strategies. Additionally, efforts to simplify the stock listing process encouraged more companies to go public, expanding the universe of tradable assets. On an international level, frameworks supporting smoother capital flows between financial hubs, such as those involving Hong Kong licensed banks and U.S. markets, ensured that global liquidity could readily find its way into NYSE-listed securities. These regulatory tailwinds created a more robust and fluid marketplace, capable of supporting historic trading volumes.
Sector-Specific Volume Analysis

Image Source: unsplash
The surge in trading volume was not uniform across the market; specific sectors became epicenters of intense trading activity. Analyzing these areas reveals the direct impact of 2026’s core drivers. The market saw clear trends emerge, with certain groups of stocks consistently appearing on lists of the most active stocks.
Tech and AI Stocks as Volume Leaders
The technology sector, particularly companies focused on artificial intelligence, dominated trading floors. Breakthroughs in AI were the primary catalyst. The democratization of foundation models through open-source initiatives allowed a new wave of companies to innovate, making them prime targets for investment and speculation. These companies were among the most active stocks. Advancements in agentic AI, which enabled systems to operate autonomously on complex goals, captured investor imagination. This created significant trading volume.
Key developments fueled the speculative trading:
- Apple’s anticipated launch of a foldable iPhone and its AI partnership with Google made it one of the most active stocks.
- The shift from building bigger AI models to smarter ones using reinforcement learning created new volume gainers.
- The concept of English becoming a new programming language through AI assistants sparked widespread interest, making related software companies some of the most active stocks.
This constant innovation made tech and AI companies the most active stocks and the biggest volume gainers, as traders positioned themselves for the next big breakthrough. The high volume of trading reflected the market’s excitement.
Energy and Industrials Amid Global Demand
Global shifts in policy and investment drove significant trading in the energy and industrials sectors. Geopolitical tensions and new trade barriers forced a reconfiguration of supply chains. This created uncertainty and opportunity, making industrial companies some of the most active stocks. Investment flowed into key areas, turning many of these companies into volume gainers.
The clean-energy transition was a powerful force. Massive cross-border investment in renewable generation, grid modernization, and critical minerals processing fueled constant trading. Digital infrastructure projects, including data centers and 5G networks, also attracted enormous capital.
This focus on domestic infrastructure and defense spending made related firms some of the most active stocks. Investors engaged in frequent trading to capitalize on government-backed initiatives and the growing demand for secure energy and technology backbones. This sector’s most actively traded stocks were those directly benefiting from these large-scale projects.
Consumer Staples and Discretionary Volatility
The consumer sectors experienced significant volatility, leading to high trading volume. Persistent inflation and shifting central bank policies created an uncertain outlook for household spending. This environment made consumer-focused companies some of the most active stocks. Traders reacted quickly to economic data, leading to sharp price swings and elevated trading. The divergence between essential goods (staples) and non-essential ones (discretionary) provided a clear basis for strategic stock trading. Investors frequently rebalanced portfolios between these groups, making them some of the most active stocks and occasional volume gainers.
Implications and Future Outlook
The historic rise in the nyse average volume carries significant consequences for market participants and shapes the investment landscape for the remainder of the year. Understanding these implications is crucial for navigating the opportunities and risks of this new high-activity environment.
What Higher Volume Means for Investors
The surge in trading volume directly impacts investors, primarily through market liquidity and transaction costs. Higher liquidity generally leads to narrower bid-ask spreads, which can lower the cost of trading. For retail investors, the cost of a trade is often about one-half of the median bid-ask spread. This means a more active market can make entering and exiting positions more efficient. However, this benefit has limits. The cost of a trade also depends on its size relative to the daily volume. A large order in an otherwise liquid stock can still incur significant costs if it represents a high percentage of that day’s activity.
Market Health vs. Systemic Risk
The high-volume environment presents a classic trade-off between market efficiency and systemic risk. On one hand, AI-driven trading enhances price discovery and provides constant liquidity. On the other, it amplifies volatility and introduces risks like flash crashes.
Historical market trends reveal a critical insight: periods of elevated trading volumes, particularly during market stress, often coincide with impaired liquidity. This paradox can amplify price movements and increase fragility.
The automation that drives this volume can intensify downturns. The International Monetary Fund has warned that automated systems in tokenized markets could amplify flash crashes, a risk that extends to any highly automated trading ecosystem.
A 2026 Stock Market Forecast
Looking ahead, the 2026 stock market forecast remains constructive, with specific sectors positioned to capitalize on current trends. Analysts project a favorable stock market forecast driven by strong performance in key areas.
- Technology: This sector is expected to continue its leadership, with semiconductor firms forecasting robust earnings growth.
- Financials: This group may benefit from AI adoption and a steepening yield curve.
- Healthcare: Poised for a potential reversal of recent underperformance, this sector shows signs of strong underlying value.
These sectors reflect the dominant market trends and are likely to attract continued trading activity as investors position their portfolios for the second half of the year.
The 2026 surge resulted from a confluence of macroeconomic events, advanced AI trading, and key regulatory changes. This environment presents investors with a dual reality: enhanced liquidity alongside significant volatility. The record nyse average volume suggests this high-activity market is not a temporary peak. Instead, this level of trading may establish a new, more dynamic baseline for market behavior extending into 2027.
FAQ
What were the main causes of the 2026 volume surge?
The surge resulted from three converging forces. Pivotal macroeconomic shifts created uncertainty. Advanced AI trading technologies provided the tools for rapid execution. Finally, regulatory reforms increased market efficiency and access, supporting higher activity levels across the NYSE.
How did AI technology increase trading volume?
AI-driven platforms empowered traders with sophisticated tools. Intelligent execution engines and predictive analytics allowed for faster, more frequent trading. AI also enabled smart portfolios that automatically rebalanced assets, leading to more dynamic and continuous trading adjustments.
Is high trading volume good for the stock market?
High volume presents a dual reality. It generally improves liquidity and can lower transaction costs for investors. However, it also signifies heightened volatility and increases systemic risks, such as the potential for automated systems to amplify market downturns.
Which sectors saw the most trading activity?
Technology and AI stocks were clear volume leaders due to constant innovation. Energy and industrials also saw heavy trading amid global supply chain reconfigurations. Consumer-focused sectors experienced significant volatility, which drove frequent portfolio rebalancing and high trade counts.
*This article is provided for general information purposes and does not constitute legal, tax or other professional advice from BiyaPay or its subsidiaries and its affiliates, and it is not intended as a substitute for obtaining advice from a financial advisor or any other professional.
We make no representations, warranties or warranties, express or implied, as to the accuracy, completeness or timeliness of the contents of this publication.
Related Blogs of

What Are NOR Flash, SLC NAND, and EEPROM? Why They Help Explain Hong Kong-Listed Memory-Related Stocks


Why Does AI Compute Growth Drive Storage Demand? The Difference Between Training, Inference, and Data Retention


What Is the Difference Between HBM3E and HBM4? What Do They Mean for Micron and AI Servers?


How Do AI Servers Drive Storage Demand? The Roles of HBM, Server DRAM, Enterprise SSDs, and HDDs

Choose Country or Region to Read Local Blog

Contact Us


BIYA GLOBAL LLC is registered with the Financial Crimes Enforcement Network (FinCEN), an agency under the U.S. Department of the Treasury, as a Money Services Business (MSB), with registration number 31000218637349, and regulated by the Financial Crimes Enforcement Network (FinCEN).
BIYA GLOBAL LIMITED is a registered Financial Service Provider (FSP) in New Zealand, with registration number FSP1007221, and is also a registered member of the Financial Services Complaints Limited (FSCL), an independent dispute resolution scheme in New Zealand.