
Scalping vs. Day Trading: Profit Potential, Trading Costs, and Risks




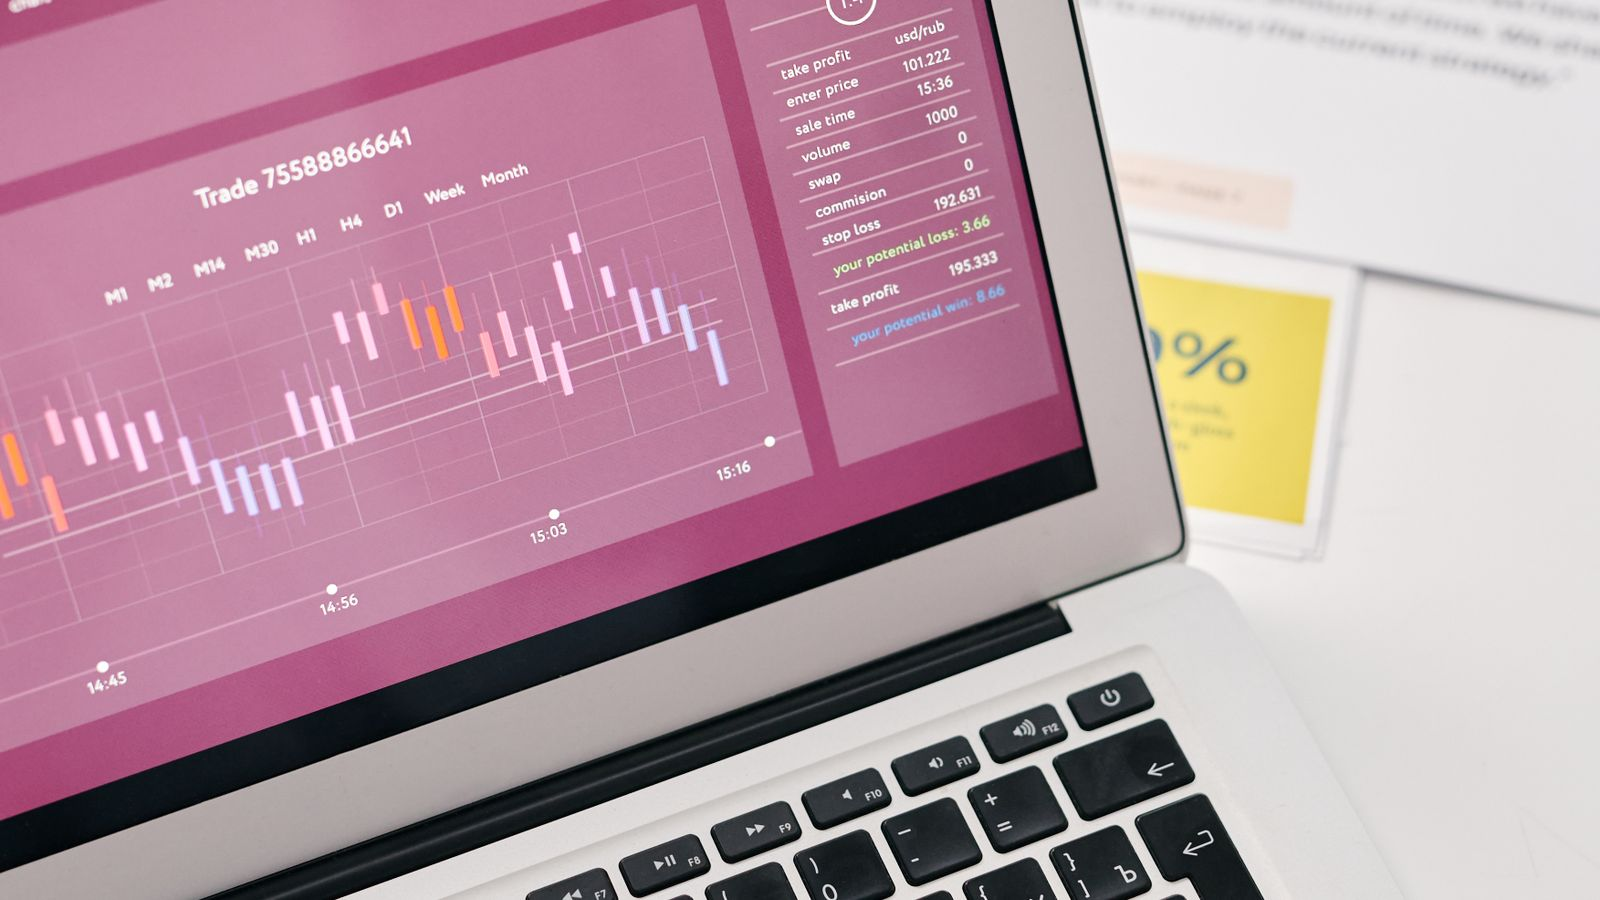
Scalping is usually a form of day trading, so the two are not mutually exclusive categories. The useful comparison is between very short positions lasting seconds to minutes and longer intraday positions lasting tens of minutes to hours. Both approaches aim to exit on the same day, but their target price moves, trading frequency, and execution demands differ. To assess profit potential, you need to examine average gains, average losses, and total costs together, rather than focusing only on win rates or assuming that more trades necessarily mean more profit.
Key Takeaways
- Scalping usually falls within day trading; the main differences concern holding periods and execution demands.
- Smaller profit targets are more vulnerable to fees, spreads, and slippage.
- Win rates need to be assessed alongside average gains, average losses, and total costs.
- More trades amplify existing results; they do not automatically create a profitable edge.
- Closing positions the same day reduces overnight exposure but does not eliminate intraday gaps or execution risk.
What Are You Comparing: Scalping or Longer Intraday Positions?

The main difference is how much of a price move you intend to capture and how many decisions you are willing to make along the way. Day trading and scalping can be understood as different paces within the same broad approach of holding positions within a trading day, with scalping generally at the faster end. Holding periods are descriptive ranges, not universal rules that every market must follow.
Very short positions may involve entering and exiting quickly around brief buying or selling pressure or small price movements. Longer intraday positions may allow time for a breakout, pullback, or trend to develop. The latter often involve larger profit targets per trade, but also longer waits and potentially greater price fluctuations while the position remains open. “Longer” here still means within the day, rather than swing positions held across multiple days.
| Comparison | Very short intraday positions | Longer intraday positions |
|---|---|---|
| Typical holding period | Seconds to minutes | Tens of minutes to hours |
| Main focus | Short-lived price changes and immediate execution conditions | Intraday price development and conditions that invalidate the trade |
| Trading pattern | Potentially repeated entries and exits, with more frequent execution | Usually fewer selected opportunities and longer waits |
| Main execution challenge | Covering costs with small targets and completing orders promptly | Managing price fluctuations while holding and exiting as planned |
A chart's timeframe is not the same as a position's holding period. Using a one-minute chart does not require you to exit within one minute; looking at longer chart intervals does not require an overnight position. Likewise, frequent manual trading is not equivalent to institutional high-frequency trading, which typically also involves automated systems and low-latency infrastructure. Trade count alone does not establish that equivalence.
Before choosing a pace, define your entry rationale, the conditions that invalidate it, and your exit plan. A strategy needs more substance than “get in and out quickly” or “wait a little longer.” If you decide to extend a position only after it starts losing, your execution has departed from the approach you originally intended to evaluate, making it harder to identify what produced the results.
How Do Fees, Spreads, and Slippage Affect a Trade?

Whether a trade produces a net profit depends on the complete round trip, not simply on whether the price moved in your favor after entry. The smaller the target move, the larger a given cost generally becomes relative to that target. You need a consistent accounting method before comparing different holding periods, so that you neither overlook closing costs nor deduct execution costs twice.
What Costs Belong in a Complete Round Trip?
A round-trip trade includes both opening and closing the position. Commissions, platform fees, and external charges may apply per order, share, or contract, and minimum charges may also apply. Check the relevant charges on both sides rather than treating the advertised cost of one order as the total.
The bid-ask spread is embedded in executable quotes. Suppose the bid is $99.99 and the ask is $100.01. If you buy 100 shares at the ask and immediately sell them at the bid while both quotes remain unchanged, the price difference costs you $2. Relative to the $100 midpoint, each side incurs half the spread; you do not deduct another full spread on each side.
Slippage also requires a clear benchmark. You can record the opposite-side quote visible when submitting an order and compare it with your actual average fill price, identifying any further unfavorable difference separately. If you measure execution differences directly against the midpoint, that measurement may already include the spread. Adding the entire difference to a full spread would overstate the cost.
Fixed expenses such as market data subscriptions and software can be recorded separately and assessed over your chosen period. Other charges may apply in particular markets, but you should not mix fee rules for stocks, futures, and other products. Nor should you assume that a short holding period exempts a trade from charges assessed on execution.
Why Do Zero Commissions or Limit Orders Not Guarantee Low Costs?
Zero commission means that one explicit charge is zero. It does not eliminate spreads, other applicable fees, or unfavorable execution differences. When a strategy targets a very small gross profit per trade, those remaining costs can still change the outcome even if commissions are low.
The difference between market orders and limit orders also affects the calculation. A market order does not guarantee its execution price. A limit order restricts the execution price but may remain unfilled or fill only partially. Waiting passively for a fill can also mean missing an opportunity, so an ideal limit price should not be treated as an actual fill available on every trade.
Keep two accounting methods distinct. If you calculate gross profit and loss using benchmark prices, estimate spread and slippage costs separately. If you calculate trading profit and loss using actual fills, deduct only the explicit charges not already included. Both methods have analytical uses, but mixing them in one result can lead to double counting.
With the Same Win Rate, How Do Frequency and Average Gains and Losses Change Net Results?

The same win rate can produce different net results because average gains, average losses, and costs determine the result per trade, while frequency accumulates those results. The following teaching example uses the same stock, priced at approximately $100, with 100 shares per trade. All trades involve buying first and selling later, with no overlapping positions, and both sets cover the same observation day.
Assume that account rules and available buying power permit these trades. This does not assume that cash-account sale proceeds can be reused immediately without limit, nor does it support calculating a return on a fixed amount of starting capital. Gross results in both sets use changes in the midpoint between the entry and exit decisions, before fees, spreads, and additional slippage.
Assume a uniform round-trip cost of $4: $1 in fees, $2 in combined spread costs across the purchase and sale, and $1 in total additional unfavorable slippage relative to the opposite-side quotes available at the time. Every amount, trade count, and win rate is hypothetical and illustrates the calculation rather than actual pricing or strategy performance.
| Comparison | Very short holding example | Longer intraday holding example |
|---|---|---|
| Round-trip trades | 20 | 5 |
| Winning / losing trades, classified by gross results | 12 / 8 | 3 / 2 |
| Sample win rate based on gross results | 60% | 60% |
| Average gross gain on winning trades | $12 | $60 |
| Average gross loss on losing trades | $10 | $50 |
| Total gross profit or loss | +$64 | +$80 |
| Total fees | $20 | $5 |
| Total spread costs | $40 | $10 |
| Total additional slippage | $20 | $5 |
| Total net profit or loss | −$16 | +$60 |
| Average net profit or loss per trade | −$0.80 | +$12 |
The very short holding example produces a gross result of 12 × $12 − 8 × $10 = $64. After 20 × $4 = $80 in costs, it has a net loss of $16. The longer intraday example produces 3 × $60 − 2 × $50 = $80 gross. After 5 × $4 = $20 in costs, it has a net profit of $60. “Winning trades” here are classified before costs, so that win rate cannot be directly compared with a net win rate in another record.
If the round-trip cost rises from $4 to $6 while everything else stays the same, the net results become −$56 and +$50, respectively. The shorter holding example incurs another $40 in costs, while the longer one incurs another $10. This shows how frequency magnifies changes in the cost per trade.
It does not establish that longer holding periods are better. The longer holding example has an average gross loss of $50, compared with $10 in the shorter one. Equal share counts do not mean equal risk, time in the market, capital commitment, or drawdowns. Different average gains and losses, execution conditions, and numbers of valid opportunities can change the outcome. A constructed profitable day cannot be extrapolated into reliable daily income.
How Can You Assess Profit Potential Beyond Win Rates and Trade Counts?
Start with the net result per trade and the distribution of those results. A high win rate can still produce continuing losses if gains are small and losses are large. Larger average gains do not establish high income if opportunities are scarce or difficult to execute. Recorded averages need to be read alongside the sample's scope, cost assumptions, and unusually large losses.
How Do Average Gains, Average Losses, and Costs Work Together?
For a simplified sample classified by gross profit and loss, with no breakeven trades, you can use:
Average net profit or loss per trade = win rate × average gross gain − loss rate × average gross loss − average round-trip cost.
For the shorter holding example, this is 60% × $12 − 40% × $10 − $4 = −$0.80. For the longer one, it is 60% × $60 − 40% × $50 − $4 = $12. If the sample includes breakeven trades, or costs differ materially between winning and losing trades, include those categories and actual expenses rather than omitting them to fit the formula.
Assuming average gross gains, average gross losses, and costs per trade remain fixed, the breakeven win rate equals the average gross loss plus the cost, divided by the sum of the average gross gain and average gross loss. For these examples, the calculations are ($10 + $4) ÷ ($12 + $10) ≈ 63.6% and ($50 + $4) ÷ ($60 + $50) ≈ 49.1%. These are calculated thresholds under specified assumptions, not achievable win rates guaranteed by the strategy and not investment returns.
A sample average is not a forecast. If a favorable win rate comes from a single day with a persistent directional move, average losses and execution quality may change in choppy conditions or during news-heavy sessions. Check whether a few large losses offset many small wins, rather than keeping only screenshots of profitable trades.
When Do More Opportunities Become More Costs and Drawdowns?
Additional trades are worth evaluating only if they still satisfy the strategy's conditions. A small set of carefully selected opportunities cannot be assumed to repeat dozens of times at the same quality. Relaxing the criteria to reach a trade count changes the strategy. Several consecutive trades may also depend on the same market move and should not be treated as completely independent evidence.
Alongside total profit and loss, review maximum drawdown, losing streaks, the worst individual trade, and unusual slippage. Two approaches that finish with the same profit may impose very different funding pressure and execution demands along the way. Increasing position size can also increase market impact, partial fills, and exit difficulty, so small-scale results should not be multiplied mechanically.
Which Trading Pace Fits Your Execution Skills and Risk Budget?
The appropriate pace depends on what you can execute consistently, not simply on whether you prefer quick decisions or patient waiting. Very short positions demand sustained attention and frequent order handling. Longer intraday positions require tolerating waiting periods and price retracements. Both need predefined invalidation conditions, position sizes, and circumstances in which you stop trading.
The funding and risk considerations for frequent intraday trading include trading costs, account funds, and margin arrangements. Cash and margin accounts have different rules for available funds, and displayed buying power does not mean every proposed trading arrangement is permitted. Check the latest rules for the specific market and broker rather than applying one market's fixed threshold to every product.
Exiting the same day can reduce the overnight exposure contemplated by the original plan, but trading halts, fast markets, and system outages may prevent an on-time exit. A shorter planned holding period does not guarantee a smaller actual loss. Leverage can also amplify losses, so an intention to exit quickly does not remove the need to assess your financial capacity.
To compare the approaches, use the same log to record entry and exit signals, reference quotes, actual fill prices, quantity, fees, holding time, and reasons for exiting. Group results by volatility, liquidity, and event periods to examine which differences come from the signals and which come from execution. Simulated records should also include reasonable costs and unfilled orders rather than assuming every trade completes at the most favorable price.
If you use Biya to manage relevant assets, you can check applicable charges through the Biya Cost Center and incorporate your order records into your own cost spreadsheet. Different instruments, orders, and account conditions can produce different results; low commissions alone do not establish whether a particular holding period is viable. For further reading, consider the characteristics and risks of scalping when checking execution requirements. Also confirm the specific products, trading hours, and permissions available to you, rather than treating general asset management functions as a profitability advantage for frequent trading. Service availability depends on your location, identity verification results, platform rules, and applicable laws and regulations.
Frequently Asked Questions
Is Scalping the Same as Institutional High-Frequency Trading?
No. Scalping mainly describes a trading pace involving short holding periods and potentially frequent entries and exits. Institutional high-frequency trading typically also involves automated strategies, low-latency systems, and specialized execution infrastructure. Making many trades in a day does not give an individual trader the same technical capabilities or cost structure.
Does a Zero-Commission Stock Account Make Scalping More Profitable?
Zero commissions can reduce one explicit expense, but they do not determine profitability on their own. You still need to include spreads, slippage, other applicable charges, and the strategy's average gains and losses. When target price moves are particularly small, the remaining execution costs may still exceed the available gross profit.
Can Using Only Limit Orders Eliminate Slippage and Losses?
There is no such guarantee. Limit orders restrict execution prices but do not guarantee a fill or a complete fill, and the share price can move against you after execution. Repeatedly changing a limit price to obtain a fill can also move the result away from the original plan. Record unfilled orders and price adjustments as well.
Does Closing Every Position Before the End of the Day Prevent Large Losses?
No. Sharp intraday moves, trading halts, or system problems can prevent you from exiting as planned. An intention to avoid overnight positions describes a holding objective, not a guaranteed loss limit. If you use leverage, you also need to assess the risks of insufficient funds and forced liquidation separately.
How Many Trades Are Enough to Compare Two Intraday Strategies?
There is no fixed number that suits every strategy. Cover different market conditions and check whether the sample is concentrated in one price trend, whether costs are realistic, and whether unusual losses are fully recorded. A small set of winning trades does not demonstrate lasting effectiveness, and more highly correlated trades do not necessarily provide proportionately stronger evidence.
Can You Immediately Reuse All Stock Sale Proceeds Repeatedly in a Cash Account?
Not necessarily. Check settled funds, the securities settlement cycle, and your broker's rules for using proceeds, so that you avoid improper use of unsettled funds. Displayed buying power, funds available to trade, and funds available to withdraw may differ. Your actual account conditions and the latest applicable rules determine what you can do.
*This article is provided for general information purposes and does not constitute legal, tax or other professional advice from BiyaPay or its subsidiaries and its affiliates, and it is not intended as a substitute for obtaining advice from a financial advisor or any other professional.
We make no representations, warranties or warranties, express or implied, as to the accuracy, completeness or timeliness of the contents of this publication.
Related Blogs of

Paying for Claude with USDT: Payment Options, Fees, and Limitations


Safest Ways to Send Money Internationally: Provider Checks, Scam Prevention, and Transfer Recovery



Choose Country or Region to Read Local Blog
 Australia
 Austria
 Belgium
 Canada
 Cyprus
 Czech Republic
 Denmark
 Estonia
 Finland
 France
 Germany
 Greece
 Hong Kong
 India
 Indonesia
 Ireland
 Italy
 Japan
 Latvia
 Lithuania
 Luxembourg
 Malaysia
 Malta
 Morocco
 Nepal
 Netherlands
 New Zealand
 Norway
 Pakistan
 Philippines
 Poland
 Portugal
 Romania
 Singapore
 Slovakia
 Slovenia
 South Africa
 South Korea
 Spain
 Sweden
 Thailand
 United States
 Turkey
 United Arab Emirates
 United Kingdom
 Vietnam