
Tencent Q2 2026 Earnings Preview: Can Games, Advertising, and AI Commercialization Drive Growth Together?





The key question for Tencent's Q2 earnings is not simply whether total revenue can grow, but whether games, advertising, and AI commercialization can contribute at the same time. In Q1, Tencent's revenue grew 9% year over year, marketing services grew 20%, and both China-market game revenue and international-market game revenue increased. Q2 needs to show whether these drivers can continue and whether AI investment is turning into stronger ad efficiency, cloud demand, and product monetization.
Key Takeaways
- Tencent's Q2 earnings call is scheduled for August 12, 2026 at 20:00 HKT.
- Q1 revenue was RMB196.458 billion, up 9% year over year, setting a relatively high comparison base for Q2.
- Games should be assessed through evergreen titles in the China market and the durability of international-market games.
- Advertising depends on AI recommendations, Video Accounts, and closed-loop marketing within WeChat.
- AI commercialization should be separated into ad monetization, cloud demand, and paid product adoption.
- Margins, free cash flow, and buybacks remain important supports for Tencent's valuation.
When Will Tencent Report Q2 Earnings, and What Does the Market Really Want to Verify?

Tencent will hold its Q2 2026 results announcement from 20:00 to 21:00 HKT on August 12, 2026. According to Tencent's investor calendar, the event is listed as the Tencent 2026 Second Quarter Results Announcement. As of August 11, 2026, the official Q2 figures have not yet been released, so the market will use Q1 results, management commentary, and business-line signals as the initial observation base.
What the market really wants to verify is whether the quality of Q1 growth can continue. In its Q1 2026 results release, Tencent reported total revenue of RMB196.458 billion, up 9% year over year; gross profit of RMB111.265 billion, up 11%; non-IFRS operating profit of RMB75.627 billion, up 9%; and non-IFRS profit attributable to equity holders of RMB67.905 billion, up 11%. These figures show that Tencent's core businesses still have meaningful earnings leverage.
| Item to Watch | Q1 Base | Q2 Focus | Stock Implication |
|---|---|---|---|
| Total revenue | RMB196.458 billion, +9% YoY | Whether high-single-digit growth continues | Measures multi-business resilience |
| Gross margin | 57%, up YoY | Whether it stays elevated | Reflects revenue quality and cost control |
| IFRS operating margin | 34.3%, up YoY | Whether AI investment weighs on it | Tests the balance between spending and efficiency |
| Non-IFRS profit attributable | RMB67.905 billion, +11% YoY | Whether profit keeps outgrowing revenue | Measures core earnings quality |
| Capital expenditure | RMB31.936 billion, +16% YoY | Whether AI and cloud investment continues rising | Affects free cash flow expectations |
| Free cash flow | RMB56.7 billion, +20% YoY | Whether it covers AI investment and buybacks | Affects confidence in capital returns |
Tencent's Q2 should not be judged by total revenue alone. The more important question is whether three business lines can improve together: games provide a strong cash-flow base, advertising offers margin-friendly growth, and AI could improve ad recommendation efficiency, cloud demand, and paid product conversion at the same time. If all three align, the market may be more willing to view Tencent as a multi-engine growth company rather than a single-business cycle story.
Summary: The core of Tencent's Q2 earnings is whether the quality of Q1 growth can continue. If games, advertising, and AI-related businesses improve at the same time, the market may accept Tencent's multi-business growth case more readily; if only one business line carries the quarter, valuation recovery will depend more on short-term sentiment.
Can Gaming Continue to Drive Tencent's Growth?

Games remain the cash-flow core of Tencent's Q2 earnings. Q1 value-added services revenue was RMB96.110 billion, up 4% year over year. Within that, China-market game revenue was RMB45.4 billion, up 6%, while international-market game revenue was RMB18.8 billion, up 13%, or 14% on a constant-currency basis. Q2 needs to show whether evergreen games, recently launched products, and international-market games can continue to form a stable portfolio.
Tencent disclosed in Q1 that China-market game revenue grew more slowly than gross receipts because the 2026 Chinese New Year arrived later, moving part of revenue recognition out of the quarter. In other words, Q1 revenue did not fully reflect gross-receipts strength. If deferred revenue is released in Q2, or if evergreen-game gross receipts remain strong, gaming could still provide support.
| Gaming Signal | Q1 Performance | Q2 Checkpoint | Risk |
|---|---|---|---|
| Honor of Kings | Evergreen title, quarterly gross receipts reached a new high | Whether active users and gross receipts continue | Slower growth on a high base |
| Peacekeeper Elite | Evergreen title, quarterly gross receipts reached a new high | Content updates and monetization pace | Competition for user time |
| Delta Force | Has reached Tencent's evergreen-game definition | Whether DAU and annualized gross receipts hold up | New-title heat may fade |
| VALORANT Mobile | Supports the recent product pipeline | Whether it expands the user base | Competition and launch pacing |
| International-market games | Revenue of RMB18.8 billion, +13% YoY | Whether growth remains faster than China-market games | FX and product-cycle risk |
| Social-network game items | Affected by holiday timing | Whether revenue recognition normalizes | Holiday timing mismatch |
Tencent also noted in Q1 that Roco Kingdom: World received strong user interest, while international-market game revenue was mainly driven by Clash Royale, Wuthering Waves, and VALORANT PC. If these products continue to contribute in Q2, Tencent's gaming growth structure will look more balanced and less dependent on a single hit title.
Gaming should also be viewed through the indirect impact of AI. AI may improve art production, narrative design, live operations, anti-cheat systems, customer service, and content generation, but these benefits may not immediately appear as standalone revenue. For investors, the more practical approach is to watch whether game development and operations become more efficient, whether content updates accelerate, and whether retention and monetization improve.
Summary: Tencent's Q2 gaming question is not whether one new title explodes, but whether evergreen products in the China market, newer games, and international-market titles can jointly sustain gross receipts and revenue recognition. If the China market stays stable and the international market keeps accelerating, games should remain Tencent's cash-flow core.
Can Advertising Keep Benefiting From WeChat and AI Recommendations?
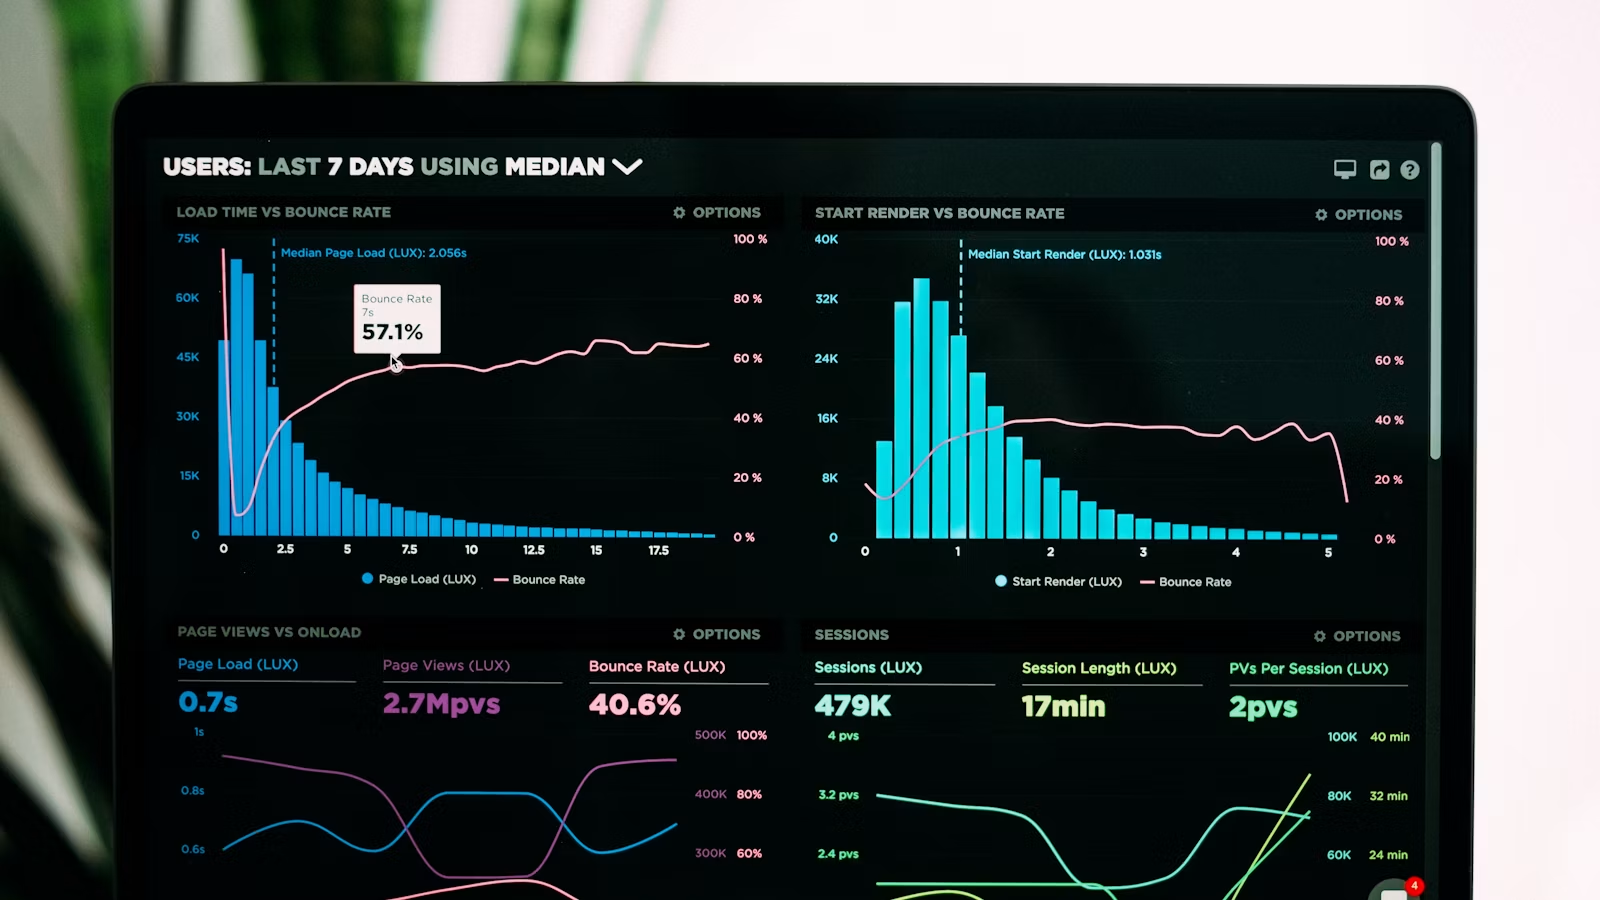
Advertising is one of the most important growth engines to watch in Tencent's Q2 report. Q1 marketing services revenue was RMB38.171 billion, up 20% year over year and above the 17% growth rate in Q4 2025. Tencent explained in its Q1 release that AI-powered upgrades to its ad recommendation models, along with expanded closed-loop marketing capabilities inside the WeChat ecosystem, improved ad performance and pricing.
This means Tencent's advertising growth is not only about a recovery in advertiser budgets. It may also come from higher ad-tech efficiency. If AI recommendation models can better match users, content, and advertiser objectives, click-through rates, conversion rates, and pricing may all improve. In its AI advertising article, Tencent said AIM+ helps advertisers simplify campaign operations and improve stability through automated targeting, bidding, placement, and creative optimization.
| Advertising Driver | Revenue Impact | Q2 Indicator |
|---|---|---|
| AI ad recommendation models | Improve matching efficiency and ad pricing | Whether ad revenue growth stays high |
| AIM+ automated buying | Lowers advertiser operating costs | Share of advertiser spending through AIM+ |
| Video Accounts recommendation model | Increases content distribution and inventory value | Video Accounts time spent and ad load |
| WeChat closed-loop marketing | Shortens the path from exposure to transaction | Mini Shops GMV and conversion |
| Advertiser industry mix | Determines budget resilience | Spending from internet services, e-commerce, games, and other categories |
| Pricing power | Reflects ad ROI and demand | Marketing services margin and growth |
Tencent disclosed in Q1 that AIM+ accounted for about 30% of total marketing services advertiser spending, total user time spent on Video Accounts grew by more than 20% year over year, and Mini Shops GMV continued to grow rapidly year over year. Taken together, these signals suggest Tencent advertising is moving from simple traffic monetization toward a combination of content distribution, transaction loops, and AI-driven campaign efficiency.
Q2 should focus on the quality of advertising growth. If marketing services continue growing near 20% and management again attributes the improvement to AI recommendations, Video Accounts, and WeChat transaction loops, the market may see it as technology-efficiency-driven growth rather than a short-term budget rebound. If ad growth slows, investors should distinguish between weaker advertiser budgets and a slowdown in the marginal impact of AI recommendations and closed-loop marketing.
Summary: The most important advertising question for Tencent's Q2 is whether AI recommendations and closed-loop marketing inside WeChat continue to lift conversion efficiency. If Video Accounts, Mini Shops, and AIM+ jointly improve advertiser ROI, marketing services may remain a margin-friendly growth engine.
What Matters More for AI Commercialization: Product Revenue or Efficiency Gains?
Tencent's AI commercialization should not be judged only by new model releases. The real question is whether AI is entering a revenue and efficiency loop. For Tencent, AI commercialization has at least three layers: ad recommendation efficiency, cloud and enterprise AI demand, and paid adoption of AI products and productivity tools. If Q2 only discusses model capabilities, the market may see the evidence as insufficient; if Tencent can provide revenue-related metrics for advertising, cloud, or product usage, the signal would be stronger.
The Q1 results release said Tencent made progress in new AI products after the start of 2026 and used AI to drive growth in core businesses. Hy3 preview ranked near the top by token usage on OpenRouter, while WorkBuddy became one of the leading productivity AI agent services in the China market by DAU. Tencent also disclosed that, excluding the revenue, costs, and expenses of new AI products such as Hy, Yuanbao, CodeBuddy, WorkBuddy, and QClaw, non-IFRS operating profit rose 17% year over year to RMB84.4 billion.
| AI Commercialization Path | Current Evidence | Q2 Checkpoint | Investment Implication |
|---|---|---|---|
| Advertising AI | Recommendation models and AIM+ improve ad performance | Whether ad growth and pricing hold up | Most direct impact on revenue and profit |
| Cloud AI services | AI-related demand supports enterprise services | Cloud revenue and pricing environment | Tests B2B commercialization |
| Gaming AI | Content production, operations, and development efficiency | Expense ratio, update speed, and retention | Supports long-term margin improvement |
| WorkBuddy/CodeBuddy | Productivity agents show early momentum | Usage, retention, and paid conversion | Product monetization signal |
| Hy3/TokenHub | Models and APIs enter products and platforms | Call volume and developer ecosystem | Tests model-infrastructure value |
| Yuanbao/ima and related products | User-facing and knowledge-management scenarios | Activity, retention, and payment path | Tests consumer AI product potential |
In its Hy3 release announcement, Tencent said Hy3 has been integrated into WorkBuddy, CodeBuddy, Yuanbao, Marvis, ima, and other products, with APIs available through Tencent Cloud TokenHub. This suggests Tencent wants to embed model capabilities into its product ecosystem rather than present them only as standalone models.
Tencent Cloud also stated in its efficiency-agent toolkit announcement that WorkBuddy Enterprise Edition, Tencent Cloud Agent Development Platform, and Qidian Marketing Cloud had been upgraded, with AI agent tools covering more than 20 vertical scenarios. If management discloses enterprise customers, retention, paid adoption, or revenue signals for these tools in Q2, the credibility of Tencent's AI commercialization story will improve.
Summary: Tencent's AI commercialization should not be assessed only by model releases. Investors should watch whether AI improves ad ROI, drives cloud demand, increases game and content efficiency, and gradually creates paid products. Q2 needs clearer usage and revenue-related signals.
Can FinTech, Business Services, and Margins Provide a Stable Base?
FinTech and business services are Tencent's growth stabilizer and an important window into whether AI commercialization can reach enterprise customers. Q1 FinTech and business services revenue was RMB59.885 billion, up 9% year over year. FinTech services growth mainly came from commercial payments and wealth-management services, while business services revenue grew 20% year over year, driven by cloud revenue growth, AI-related demand, an improved pricing environment, and e-commerce technology service fees from Mini Shops GMV growth.
This segment may have less upside volatility than advertising and games, but its stability matters. Commercial payments and wealth management reflect consumer and financial activity, while business services reflect cloud, AI, and merchant technology-service demand. If Q2 FinTech and business services maintain high-single-digit growth and business services continue to grow faster, Tencent's AI commercialization story will extend beyond advertising efficiency into enterprise and merchant scenarios.
| Business Line | Q1 Growth Logic | Q2 Focus | Risk |
|---|---|---|---|
| Commercial payments | Higher transaction volume and ticket size | Resilience in retail, dining, and related scenarios | Consumption volatility |
| Wealth-management services | Supports FinTech revenue | User assets and fee changes | Market volatility and regulatory rules |
| Cloud services | One of the main drivers of business services growth | AI-related demand and pricing environment | Enterprise IT budget changes |
| Mini Shops technology fees | Rapid GMV growth | Merchant activity and transaction conversion | Subsidies and traffic costs |
| AI agent products | Early momentum from WorkBuddy and related tools | Enterprise paid adoption and retention | Product cost and commercialization pace |
| Capital expenditure | +16% YoY to RMB31.936 billion in Q1 | Whether AI infrastructure investment continues | Affects free cash flow |
Margins are equally important. Tencent's Q1 gross margin was 57%, IFRS operating margin was 34.3%, and non-IFRS operating margin was 38.5%. Advertising and games usually have stronger margins, while the earnings quality of FinTech and business services depends on payment fees, cloud costs, AI investment, and merchant-service efficiency. If AI improves advertising and cloud-service efficiency while expense ratios stay disciplined, Tencent's margins may remain resilient.
Capital returns also affect valuation. Tencent's Q1 free cash flow was RMB56.7 billion, up 20% year over year; net cash was RMB146.86 billion, up 63%; and the company repurchased about 12.7 million shares in Q1 for a total consideration of about HKD7.6 billion. For Hong Kong stock investors, free cash flow and buybacks can help offset concerns about AI-related spending.
When observing Hong Kong-listed internet leaders such as Tencent Holdings, investors should not only look at revenue growth after earnings. Margins, free cash flow, buybacks, Hong Kong stock liquidity, bid-ask spreads, order types, and fees should also be part of the checklist. Users can use Biya to follow relevant available securities and check market categories through the Hong Kong stock list. On fees, Biya's pricing page shows that Hong Kong stock trading commission is 0.03% of transaction value, with a minimum of HKD7 per order, and the platform fee is 0.03% of transaction value, with a minimum of HKD8 per order. Trading fees, settlement transaction fees, transaction levies, stamp duty, FX rates, bid-ask spreads, and other applicable costs should be based on the Biya pricing page, the order page, and the platform's latest rules. Service availability depends on the user's location, identity verification results, platform rules, and applicable laws and regulations.
Summary: FinTech and business services are Tencent's growth stabilizer, while margins and free cash flow determine earnings quality. If cloud services, AI demand, and merchant services continue improving while expense ratios remain disciplined, Tencent's growth story will look more complete.
What Signals Should Investors Watch After Tencent Reports?
After Tencent reports, investors should judge growth quality by whether games, advertising, AI, margins, and capital returns form a multi-business growth pattern. A beat from one business line can help, but Tencent's valuation needs stronger proof that game cash flow is stable, advertising efficiency continues to improve, and AI is not only a spending item but is entering commercial loops across ads, cloud, products, and enterprise services.
| Scenario | Games | Advertising | AI Commercialization | Margins | Market Interpretation |
|---|---|---|---|---|---|
| Bullish | China market stable, international market continues faster growth | Marketing services maintain high growth | AI improves ads, cloud, and product payment | Gross margin and non-IFRS margin remain stable | Multi-business growth supports valuation recovery |
| Neutral | Game revenue meets expectations but new titles contribute moderately | Ads keep growing but below Q1 pace | AI remains mostly an efficiency narrative | Margins stable | Market waits for more quarterly evidence |
| Cautious | Deferred revenue or gross-receipts pressure emerges in games | Ad growth slows | AI spending rises without enough revenue signals | Expense ratio increases | Market reassesses AI investment returns |
The first group of metrics is gaming: value-added services revenue, China-market game revenue, international-market game revenue, evergreen-game gross receipts, and new-game performance. The second group is advertising: marketing services growth, AIM+ share, Video Accounts time spent, Mini Shops GMV, and advertiser industry mix. The third group is AI: whether Hy3, WorkBuddy, CodeBuddy, Yuanbao, TokenHub, and Tencent Cloud AI demand show clearer commercialization data.
The fourth group is earnings quality. Tencent already showed in Q1 that revenue growth can translate into earnings and free cash flow. Q2 needs to show whether that condition can continue. If AI investment keeps rising but gross margin, non-IFRS margins, and free cash flow remain resilient, the market may be more willing to accept Tencent's AI investment cycle. If AI product costs rise without enough revenue evidence, investors will ask for a clearer return path.
Summary: After Tencent's Q2 earnings, the most important question is whether growth is shifting from single-point recovery to multi-business momentum. Games provide cash flow, advertising provides high-quality growth, and AI could complete the valuation case if it enters a commercial loop.
FAQ
When Will Tencent Report Q2 2026 Earnings?
Tencent's Q2 2026 results announcement is scheduled from 20:00 to 21:00 HKT on August 12, 2026. As of August 11, 2026, the official Q2 figures have not yet been released, so the exact release timing and disclosure details should be checked against Tencent's investor relations page.
What Matters Most for Tencent's Q2 Gaming Business?
The key metrics are gross receipts and revenue recognition in the China market, international-market game growth, new-title performance, and whether evergreen games such as Honor of Kings, Peacekeeper Elite, and Delta Force continue to generate stable gross receipts.
Why Is Tencent's Advertising Business Related to AI?
Tencent's advertising growth is linked to AI recommendation models, Video Accounts content distribution, closed-loop marketing in the WeChat ecosystem, and AIM+ automated ad buying. If AI improves ad conversion and pricing, it directly affects marketing services revenue and margins.
Which Metrics Matter for Tencent's AI Commercialization?
Investors should watch whether AI drives ad ROI, cloud demand, enterprise AI product usage, paid conversion for productivity tools, and whether AI investment increases expense pressure. Releasing models alone does not mean commercialization is working.
What Is the Most Important Growth Signal After Tencent's Q2 Earnings?
The most important signals are whether game revenue remains stable, marketing services maintain strong growth, AI brings clear revenue or efficiency improvements, and non-IFRS net profit and margins remain resilient.
Why Should Investors Not Only Look at Tencent's Revenue Growth?
Tencent has a complex business structure. Beyond revenue growth, investors should also assess the revenue quality of games and advertising, the stability of FinTech and business services, AI investment returns, expense ratios, free cash flow, and shareholder returns.
*This article is provided for general information purposes and does not constitute legal, tax or other professional advice from BiyaPay or its subsidiaries and its affiliates, and it is not intended as a substitute for obtaining advice from a financial advisor or any other professional.
We make no representations, warranties or warranties, express or implied, as to the accuracy, completeness or timeliness of the contents of this publication.
Related Blogs of

Crypto-Related Stocks vs Digital Assets: What Investors Actually Own


DCA vs. Grid Trading in Crypto: Key Differences, Costs, and Risks



Choose Country or Region to Read Local Blog
 Australia
 Austria
 Belgium
 Canada
 Cyprus
 Czech Republic
 Denmark
 Estonia
 Finland
 France
 Germany
 Greece
 Hong Kong
 India
 Indonesia
 Ireland
 Italy
 Japan
 Latvia
 Lithuania
 Luxembourg
 Malaysia
 Malta
 Morocco
 Nepal
 Netherlands
 New Zealand
 Norway
 Pakistan
 Philippines
 Poland
 Portugal
 Romania
 Singapore
 Slovakia
 Slovenia
 South Africa
 South Korea
 Spain
 Sweden
 Thailand
 United States
 Turkey
 United Arab Emirates
 United Kingdom
 Vietnam