
JD.com Q2 2026 Earnings Preview: Can Retail Margins Stay Resilient as Food Delivery Competition Heats Up?





The core question for JD.com's Q2 earnings is not whether revenue can keep growing, but whether the retail business can support group profitability after competition in food delivery and instant retail heats up. In Q1, JD.com's revenue was RMB315.7 billion, up 4.9% year over year. JD Retail operating profit was RMB15.0 billion, with an operating margin of 5.6%, but group operating margin fell from 3.5% a year earlier to 1.2%. This shows that JD.com's core retail business remains resilient, while new-business investment has already flowed through the income statement. Q2 needs to show whether food delivery investment can bring user frequency and instant-retail synergies, rather than only subsidy, fulfillment, and marketing expense pressure.
Key Takeaways
- As of August 11, 2026, JD.com's investor relations homepage had not yet shown a specific Q2 earnings event time, so the official schedule should be checked against future JD IR updates.
- JD.com's Q1 revenue was RMB315.7 billion, up 4.9% year over year, while JD Retail operating margin reached 5.6%.
- Group operating margin fell to 1.2% in Q1, mainly affected by strategic investment in new businesses.
- Food delivery and instant retail affect margins through marketing expenses, fulfillment expenses, and R&D expenses.
- JD Retail margin is the most important cushion for Q2, especially after the 618 shopping festival.
- If the retail business stays stable, new-business losses remain controlled, and user frequency improves, the market may be more willing to accept food delivery investment.
What Is the Core Question for JD.com's Q2 Earnings?

As of August 11, 2026, JD.com's investor relations homepage showed "Upcoming Investor Events: More events are coming soon," so the Q2 earnings release timing still needs to be confirmed through later company announcements. For investors, the most important question is not whether Q2 revenue grows by a few percentage points, but whether retail margins can offset expense pressure from food delivery, instant retail, and other new-business investments.
In its Q1 2026 results announcement, JD.com disclosed revenue of RMB315.7 billion, up 4.9% year over year; non-GAAP net income attributable to ordinary shareholders of RMB7.4 billion; JD Retail operating profit of RMB15.0 billion, with an operating margin of 5.6%; and group operating profit of RMB3.8 billion, with an operating margin of 1.2%. Looking only at the retail segment, JD.com's margins were not weak. But at the group level, new-business investment has clearly compressed operating margin.
| Item to Watch | Q1 Performance | What Q2 Needs to Verify | Investment Implication |
|---|---|---|---|
| Total revenue | RMB315.7 billion, +4.9% YoY | Whether revenue continues growing after 618 | Measures demand resilience |
| JD Retail operating margin | 5.6% | Whether retail margins remain high | Measures core-business cushion |
| Group operating margin | 1.2% | Whether new-business investment keeps weighing on group profit | Measures expense pressure |
| Marketing expenses | RMB15.4 billion, +45.8% YoY | Whether food delivery user acquisition and subsidies keep pushing up expense ratio | Measures acquisition efficiency |
| Fulfillment expenses | RMB23.4 billion, +18.5% YoY | Whether instant delivery pushes fulfillment costs higher | Measures unit economics |
| R&D expenses | RMB6.9 billion, +48.6% YoY | Whether technology investment brings long-term efficiency | Measures investment return |
This is also where the market debate sits. On one hand, higher JD Retail margin shows that supply chain efficiency, category mix, and operating discipline remain supportive. On the other hand, food delivery and instant retail competition require subsidies, delivery capacity, and technology investment, making group margins look weaker in the short term. If Q2 retail margins stay stable and new-business losses do not continue expanding, the market may give JD.com's food delivery business a longer validation period.
Summary: The key to JD.com's Q2 earnings is not simply revenue growth. The question is whether retail margins can continue to provide support while food delivery, instant retail, and new-business investment remain controlled. If both conditions hold, margin resilience will be more convincing.
How Will Rising Food Delivery Competition Affect JD.com's Income Statement?
The impact of food delivery competition on JD.com's income statement is not limited to subsidies. User acquisition, merchant incentives, and consumer discounts push up marketing expenses. Riders, instant delivery, and order fulfillment push up fulfillment expenses. Platform construction, algorithms, dispatch systems, and risk control push up R&D expenses. Ultimately, these costs appear in new-business losses and group operating margin.
Q1 already showed this pressure. JD.com's marketing expenses were RMB15.4 billion, up 45.8% year over year; fulfillment expenses were RMB23.4 billion, up 18.5%; and R&D expenses were RMB6.9 billion, up 48.6%. At the same time, group operating margin fell from 3.5% a year earlier to 1.2%. JD.com said in its results announcement that the decline in operating margin was mainly affected by strategic investment in new businesses, with JD Food Delivery among the most watched initiatives.
| Cost Path | Where It Enters the Income Statement | What to Watch in Q2 |
|---|---|---|
| User subsidies and acquisition | Marketing expenses | Whether expense ratio keeps rising |
| Merchant incentives | Marketing expenses or revenue reduction | Merchant count and order quality |
| Riders and delivery | Fulfillment expenses | Whether per-order fulfillment cost improves |
| Platform and dispatch systems | R&D expenses | Whether technology investment improves efficiency |
| New-business losses | Group operating profit | Whether losses continue expanding |
| Higher order density | Expense absorption | Whether high-frequency orders lower unit cost |
Food delivery investment should be viewed in three layers. The first is absolute expenses: if Q2 expenses keep rising rapidly, the market will directly worry about margins. The second is expense efficiency: how many effective users and repeat orders each RMB of subsidy, marketing, and fulfillment spending can generate. The third is cross-business synergy: whether food delivery users increase their JD app visit frequency and convert into retail, fresh-food, supermarket, and instant-retail orders.
Summary: Food delivery competition affects JD.com's income statement through marketing, fulfillment, R&D, and new-business losses. If Q2 expense ratios continue rising, the market will not look only at order growth. It will focus more on investment efficiency, repeat-order quality, and the payback path.
Can JD Retail Margins Stay Resilient?
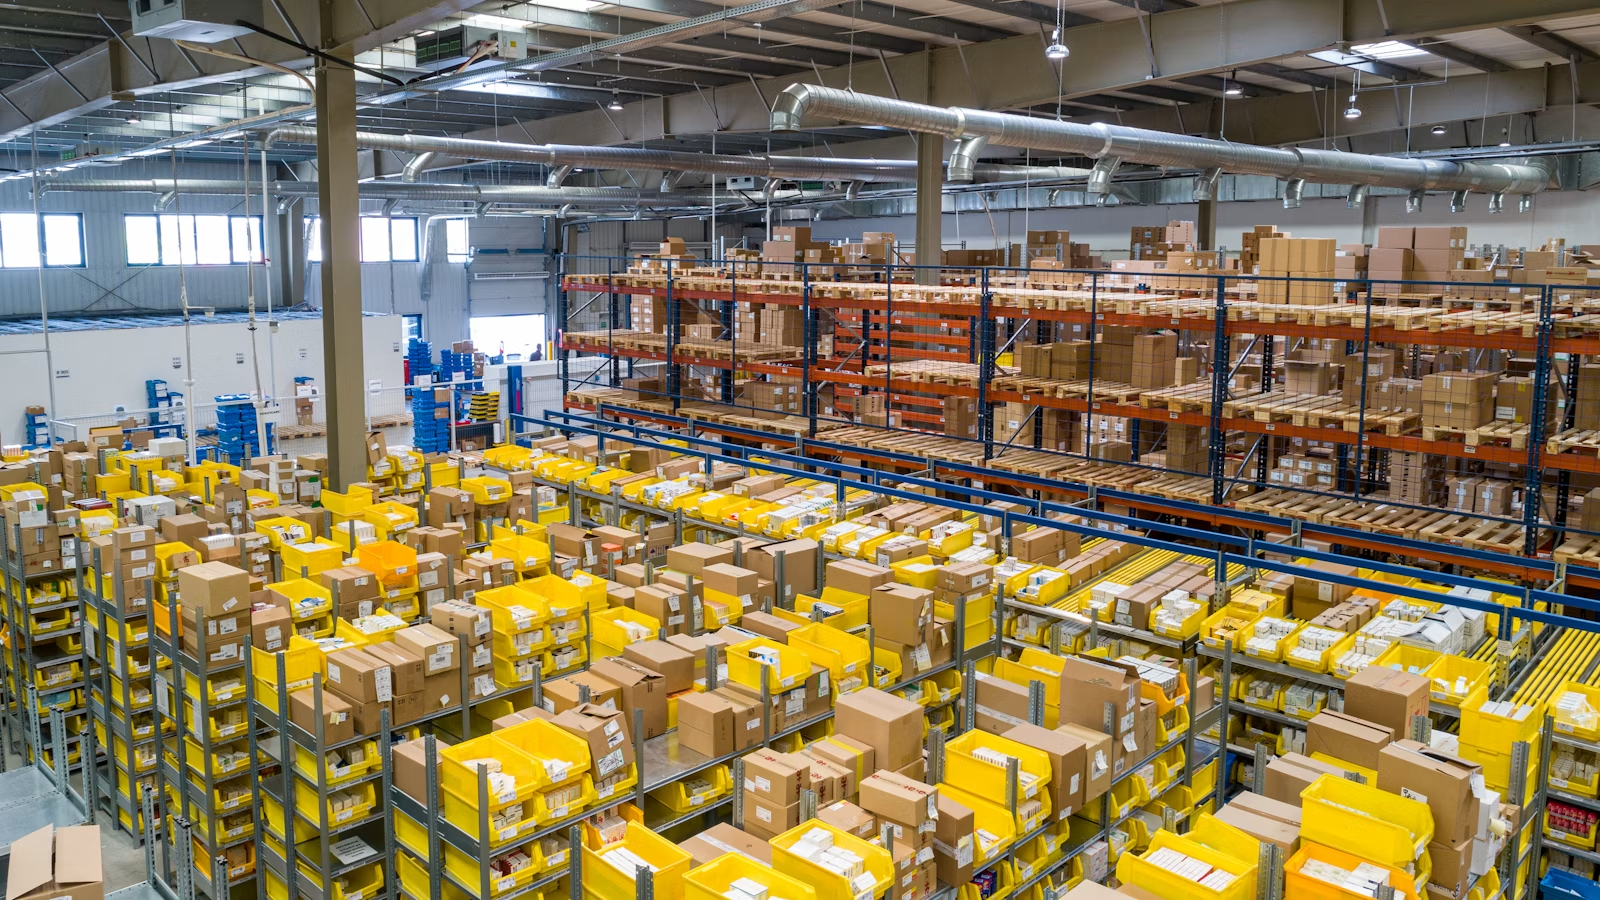
JD Retail margin is the most important cushion for JD.com's Q2 earnings. In Q1, JD Retail operating profit was RMB15.0 billion, with an operating margin of 5.6%, above 4.9% in the same period last year. This shows that even though group results were weighed down by new-business investment, the core retail business still maintained strong profitability through supply chain efficiency, category mix, and marketing-services revenue.
Q2 also includes the 618 shopping festival, making retail-margin analysis more difficult. Promotional seasons can support revenue and user activity, but they can also bring price discounts, marketing costs, and fulfillment pressure. If JD Retail still maintains a relatively high operating margin after 618, it will suggest that cost control and revenue quality remain healthy. If margins decline materially, the market may worry that food delivery investment and core-business promotions are pressuring profitability at the same time.
| JD Retail Signal | Q2 Focus | Margin Relevance |
|---|---|---|
| Home appliances and electronics | Whether demand stays stable on a high base | Affects revenue and gross margin |
| General merchandise | Whether revenue mix continues improving | Improves category structure |
| Marketplace | Merchant activity and commission revenue | Increases asset-light revenue |
| Marketing services | Advertising and merchant-tool demand | Supports margin |
| Supply chain efficiency | Inventory turnover and procurement ability | Lowers costs |
| 618 promotions | Discounts and traffic quality | Tests core-business earnings elasticity |
For JD.com, the retail business is not just product sales. It also includes first-party supply chains, third-party merchants, advertising and marketing, logistics synergies, and the membership system. If JD.com can turn 618 traffic into high-quality repeat purchases and encourage merchants to keep increasing marketing budgets, JD Retail margin will be more likely to remain resilient.
Summary: JD Retail margin is the most important cushion for JD.com's Q2 earnings. If the core retail business can maintain a relatively high operating margin after 618, the valuation impact from food delivery and instant-retail investment will be easier for the market to accept.
What Synergies Can Food Delivery and Instant Retail Bring to JD.com?
If food delivery investment is only about losing money for orders, the market will not reward it for long. JD.com needs to prove that food delivery and instant retail can bring higher user frequency, stronger app usage habits, and cross-category purchases. JD.com management already said in Q1 that JD Food Delivery created synergies with core retail in user growth, shopping frequency, and cross-category purchases. This remains one of the most important directions to track in Q2.
The commercial value of food delivery lies in frequency. Traditional e-commerce users may open an app once every few days or weeks, while food delivery and instant retail can turn user behavior into daily, or even multiple-times-daily, interactions. If these high-frequency users then buy fresh food, supermarket items, daily necessities, appliance accessories, or membership services, food delivery investment becomes more than a short-term subsidy. It becomes a traffic entry point for lower-frequency retail categories.
| Synergy Direction | Potential Value | Q2 Verification Point |
|---|---|---|
| User growth | Expands app active users | New-user and active-user trends |
| Shopping frequency | Increases app visit frequency | Whether food delivery users convert into retail users |
| Cross-category purchases | Drives fresh food, daily necessities, and supermarket orders | Whether user purchase categories expand |
| Instant retail | Shortens fulfillment time | Order density and service experience |
| Merchant ecosystem | Attracts restaurants and retailers | Merchant count and advertising demand |
| Logistics synergy | Spreads delivery network costs | Whether per-order fulfillment cost improves |
Industry competition remains intense. S&P Global Ratings' analysis of China on-demand delivery competition argues that competition in China on-demand delivery is likely to remain heated, with subsidies and platform investment potentially lasting longer. For JD.com, this means Q2 cannot be judged only by order growth. It also needs evidence on user quality and cost efficiency.
Summary: The value of JD.com's food delivery business should not be judged only by current-period profit or loss. The key is whether it can improve user frequency, cross-category purchases, and instant-retail conversion. If synergies work, food delivery investment looks more like a long-term traffic entry point. If synergies are weak, it looks more like expense pressure.
Will Fulfillment Costs and JD Logistics Weigh on Margins?
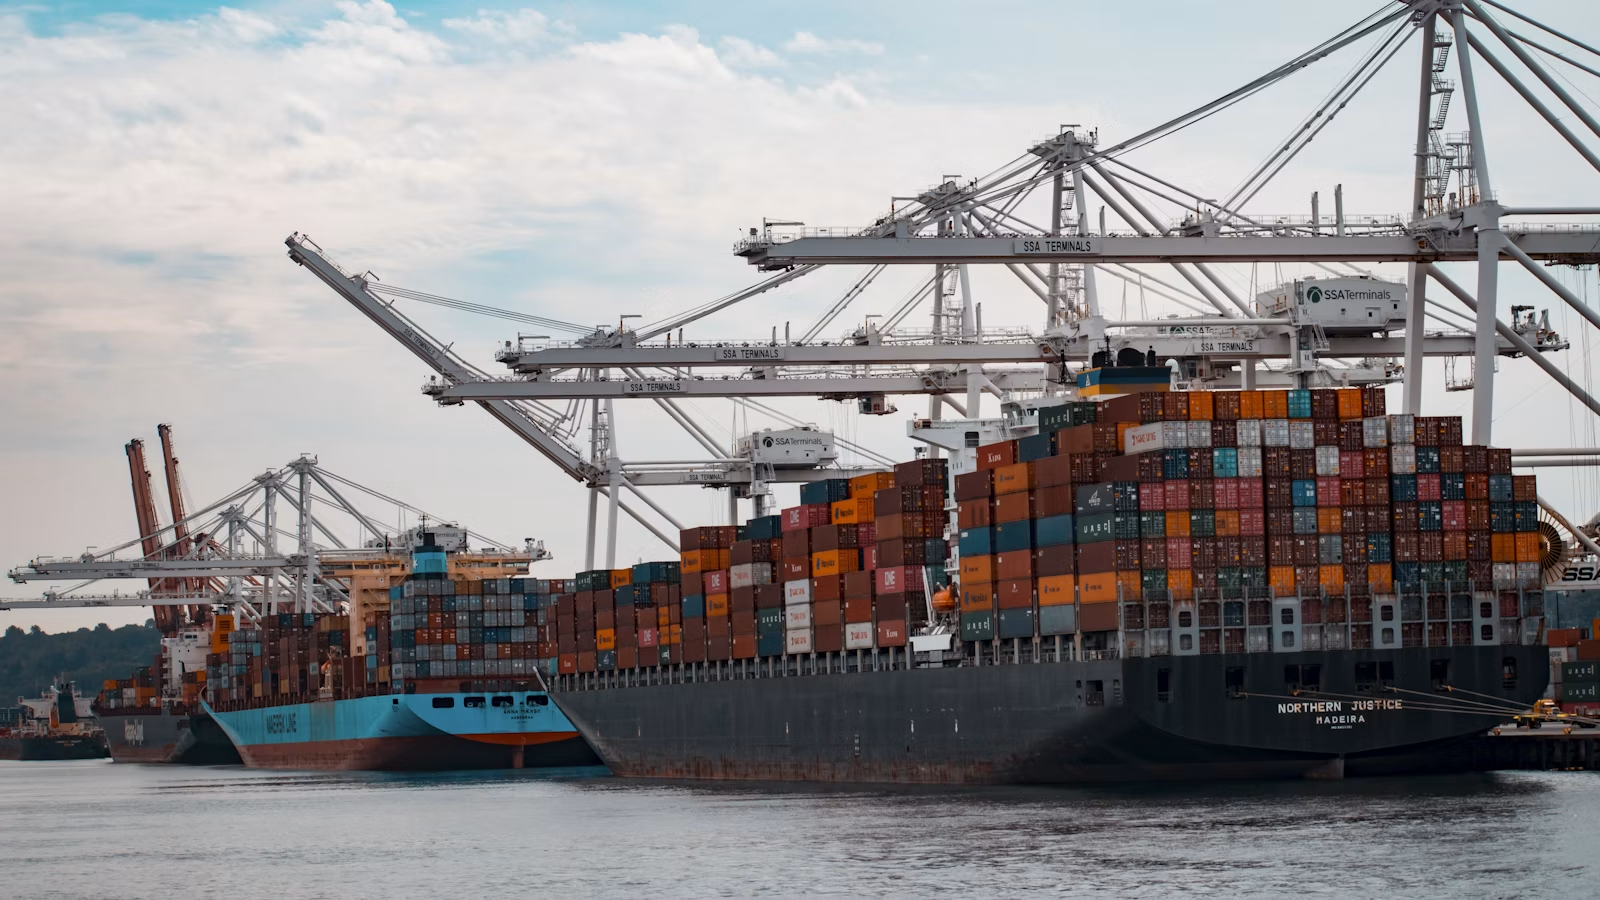
Fulfillment costs are a key indicator for judging the quality of JD.com's food delivery investment. In Q1, JD.com's fulfillment expenses were RMB23.4 billion, up 18.5% year over year, equal to about 7.4% of revenue, above roughly 6.6% a year earlier. This means fulfillment costs have already grown faster than revenue. If food delivery and instant-retail orders keep increasing in Q2, the market will focus more on whether unit fulfillment costs improve.
JD.com's advantage lies in logistics infrastructure and supply chain capability. If food delivery and instant retail increase order density, fixed costs in the delivery network can be spread across more orders. If orders are mainly subsidy-driven, repeat purchases are weak, and delivery density is insufficient, the fulfillment expense ratio may continue rising. For margins, order volume is not the only answer. Unit economics matter more.
| Fulfillment Indicator | Positive Signal | Risk Signal |
|---|---|---|
| Fulfillment expense ratio | Stabilizes as order density rises | Continues rising faster than revenue |
| Instant-delivery order density | Per-order cost declines | Dispersed orders keep costs high |
| JD Logistics external demand | Better cost absorption | External demand is insufficient |
| Service experience | Improves repeat purchases and retention | Subsidized users have low retention |
| Merchant coverage | Adds order sources | Merchant quality is unstable |
| Delivery network dispatch | Improves efficiency | Peak-hour costs fluctuate |
JD Logistics itself also needs to be watched. The JD Logistics investor relations page can be used to track later logistics-segment disclosures. If JD Logistics improves network utilization across instant delivery, supermarkets, fresh food, and third-party merchant services, fulfillment-cost pressure will be more controllable. If food delivery order growth does not bring enough density, the logistics advantage will be harder to turn into a margin advantage.
Summary: Fulfillment costs determine whether JD.com's food delivery investment is healthy. If order density rises, third-party merchant demand increases, and logistics network utilization improves, margin pressure will be easier for the market to accept. If the fulfillment expense ratio continues rising, investors will reassess the return on food delivery investment.
Can Buybacks, Cash Flow, and Valuation Cushion New-Business Pressure?
JD.com still has cash and buybacks as a cushion. In Q1, JD.com repurchased about 44.5 million Class A ordinary shares, equivalent to about 22.3 million ADSs, for a total of about $631 million. The $5.0 billion share repurchase program approved in August 2024 remains valid through August 2027, with about $1.4 billion remaining at the end of Q1. Cash, cash equivalents, restricted cash, and short-term investments totaled RMB215.7 billion at quarter-end.
Buybacks and cash cannot directly solve food delivery losses, but they can give the market more patience. If Q2 free cash flow stays stable and buybacks continue, investors may be more willing to accept that new businesses are still in an investment phase. If free cash flow weakens, buybacks slow, and food delivery losses widen, the market will treat new-business investment as a more visible valuation pressure.
| Capital Return Indicator | Q2 Focus | Investment Implication |
|---|---|---|
| Free cash flow | Whether it stays stable | Measures investment affordability |
| Cash and short-term investments | Whether they remain high | Measures shock absorption |
| Buyback execution | Whether buybacks continue | Measures shareholder returns |
| New-business losses | Whether losses widen or narrow | Measures food delivery investment pressure |
| JD Retail margin | Whether it remains stable | Measures core-business support |
| Management explanation | Whether it provides a payback path | Measures market patience |
When observing JD.com-related securities, investors should distinguish among the ADR, Hong Kong shares, and RMB counter in terms of liquidity, FX rates, price differences, and fees. Users can use Biya to follow available securities such as JD.com ADR and JD.com-SW, and check market categories through the U.S. stock list or Hong Kong stock list. Commissions, platform fees, external institution fees, FX costs, bid-ask spreads, stamp duty, and other applicable fees should be based on the Biya pricing page, the order page, and the platform's latest rules. Service availability depends on the user's location, identity verification results, platform rules, and applicable laws and regulations.
JD.com's later official disclosures can be checked through its quarterly results page, news releases page, and SEC filings page. For post-earnings trading decisions, the most important step is not reacting only to headline positives or negatives, but putting retail margins, new-business losses, expense ratios, and cash flow into the same table.
Summary: JD.com's cash and buybacks can cushion short-term volatility from new-business investment. If Q2 cash flow stays stable and buybacks continue, the market may have more tolerance for food delivery investment. If cash flow and margins weaken at the same time, valuation pressure will increase.
What Signals Should Investors Watch to Judge JD.com's Retail-Margin Resilience After Earnings?
After earnings, JD.com's retail-margin resilience should not be judged by JD Retail operating margin alone. A more complete approach is to look at the core retail business, new-business investment, expense ratios, and user quality together. Retail margins may remain stable while new-business losses still pressure group margin. New-business order growth may be fast, but if repeat purchases and user conversion are insufficient, it still does not prove the investment is effective.
| Scenario | JD Retail Margin | New-Business Losses | Expense Ratios | Users and Orders | Market Interpretation |
|---|---|---|---|---|---|
| Bullish | Remains high | Losses narrow or stay controlled | Marketing and fulfillment expense ratios stabilize | User frequency and cross-category purchases improve | Retail resilience is strong and food delivery synergies are recognized |
| Neutral | Fluctuates mildly | Investment continues | Expense ratios rise but are explainable | Order growth continues but conversion still needs proof | Market waits for more quarterly data |
| Cautious | Declines materially | Losses widen | Marketing and fulfillment expense ratios keep rising | Subsidy-driven orders are obvious and repeat purchases are weak | Margin resilience is questioned |
The nine most important indicators are JD Retail operating margin, group operating margin, marketing expense ratio, fulfillment expense ratio, new-business losses, JD Food Delivery order quality, user shopping frequency, post-618 performance in home appliances and general merchandise, and free cash flow plus buybacks. If most of these indicators improve in the same direction, JD.com's margin resilience will look stronger. If both the core retail business and new businesses come under pressure, post-earnings valuation recovery will be more difficult.
Summary: After JD.com's Q2 earnings, the most important question is whether retail margins, new-business losses, and expense ratios remain controlled at the same time. If the core retail business is stable, new-business investment is effective, and user frequency improves, JD.com's margin resilience will remain credible.
FAQ
When Will JD.com Report Q2 2026 Earnings?
As of August 11, 2026, JD.com's investor relations homepage had not yet shown a specific Q2 earnings event time. Investors should watch JD.com's IR homepage, quarterly results page, and news releases page, with the final release timing subject to the company's official announcement.
Why Does JD.com's Food Delivery Investment Affect Margins?
Food delivery investment affects margins through marketing expenses, fulfillment expenses, R&D expenses, and new-business losses. Subsidies and user acquisition push up marketing expenses, riders and instant delivery push up fulfillment costs, and platform technology investment adds to R&D spending.
Why Is JD Retail Operating Margin Important?
JD Retail operating margin is the core indicator of JD.com's main retail profitability. If the retail business maintains high margins, it can partly offset group profit pressure from food delivery and instant retail investment. If retail margins decline, group earnings volatility will become more visible.
What Synergies Exist Between JD.com's Food Delivery and Retail Businesses?
Food delivery can increase how often users open the JD app and drive instant-retail orders in fresh food, supermarkets, and daily necessities. If food delivery users convert into retail users, JD.com can turn a high-frequency scenario into an entry point for core-business growth.
What Does a Rising JD.com Fulfillment Expense Ratio Mean?
A rising fulfillment expense ratio means delivery, warehousing, and order-fulfillment costs are growing faster than revenue. In the short term, this may come from food delivery and instant-retail investment. Over the long term, the key is whether order density, logistics network utilization, and repeat-purchase quality can improve unit costs.
Which Indicators Matter Most After JD.com's Q2 Earnings?
The most important indicators are JD Retail operating margin, group operating margin, marketing expense ratio, fulfillment expense ratio, new-business losses, user shopping frequency, free cash flow, and buyback execution. Together, these metrics help judge whether JD.com's margins remain resilient.
*This article is provided for general information purposes and does not constitute legal, tax or other professional advice from BiyaPay or its subsidiaries and its affiliates, and it is not intended as a substitute for obtaining advice from a financial advisor or any other professional.
We make no representations, warranties or warranties, express or implied, as to the accuracy, completeness or timeliness of the contents of this publication.
Related Blogs of

International Money Transfer Limits: Per-Transfer, Daily, and Monthly Caps Explained


Crypto Off-Ramp Services vs. Exchanges: Fees, Payouts, and Trade-Offs


Buying US Stocks from Overseas: Broker Options, Funding, and Costs

Wire Transfer Requirements: Sender and Beneficiary Details Checklist

Choose Country or Region to Read Local Blog
 Australia
 Austria
 Belgium
 Canada
 Cyprus
 Czech Republic
 Denmark
 Estonia
 Finland
 France
 Germany
 Greece
 Hong Kong
 India
 Indonesia
 Ireland
 Italy
 Japan
 Latvia
 Lithuania
 Luxembourg
 Malaysia
 Malta
 Morocco
 Nepal
 Netherlands
 New Zealand
 Norway
 Pakistan
 Philippines
 Poland
 Portugal
 Romania
 Singapore
 Slovakia
 Slovenia
 South Africa
 South Korea
 Spain
 Sweden
 Thailand
 United States
 Turkey
 United Arab Emirates
 United Kingdom
 Vietnam