
Mid-to-Late August 2026 U.S. and Hong Kong Earnings Calendar: What to Watch in Tencent, SMCI, Xiaomi, Baidu and More





In mid-to-late August 2026, U.S. and Hong Kong equities will enter an earnings window where multiple investment themes overlap. Tencent, SMCI, CoreWeave, JD.com, SMIC, Xiaomi and Baidu each represent a different part of the AI, cloud, consumer internet, semiconductor and smart EV value chain. The key is not only to remember the dates, but also to separate confirmed company schedules from board meeting windows, then judge growth quality through orders, margins, capital expenditure and cash flow.
Key Takeaways
- The first important window runs from August 11 to 13, covering AI servers, AI cloud, Tencent and semiconductor equipment.
- Hong Kong board meeting dates are not always the same as earnings release or conference call times.
- SMCI and CoreWeave together test whether AI compute demand can become profit and cash flow.
- Tencent, JD.com and Baidu should be judged by whether AI adds value to existing businesses.
- Xiaomi earnings need to be read through smartphone costs, EV margins and R&D spending.
- During a dense earnings period, investors should align time zones, indicator definitions and risk budgets in advance.
How to Read the Mid-to-Late August Earnings Calendar: Which Dates Are Confirmed?

As of August 10, 2026, Tencent, SMCI, CoreWeave, Applied Materials and Walmart have company-level schedules or conference call times. Several Hong Kong-listed companies appear on the HKEX board meeting list. That list indicates when a board plans to review results, but the exact earnings release time, conference call and uploaded materials may still be announced separately. For that reason, not every date should be described as a fully confirmed earnings release time.
| Date | Company | Market | Current Wording | First Things to Watch |
|---|---|---|---|---|
| Aug. 11 | SMCI | U.S. | After U.S. market close, call at 5:00 p.m. ET | Revenue, gross margin, backlog, liquid cooling delivery |
| Aug. 11 | CoreWeave | U.S. | After U.S. market close, call at 5:00 p.m. ET | Backlog, capex, interest expense, cash flow |
| Aug. 12 | Tencent | Hong Kong | Investor calendar shows an 8:00 p.m. HKT call | Games, advertising, cloud, AI spending |
| Aug. 13 | JD.com | Hong Kong/U.S. ADR | HKEX board meeting list | Retail margin, food delivery investment, logistics revenue |
| Aug. 13 | SMIC | Hong Kong/A-share | HKEX board meeting list | Utilization, gross margin, capex |
| Aug. 13 | Applied Materials | U.S. | After U.S. market close, call at 4:30 p.m. ET | Advanced logic, DRAM, packaging equipment orders |
| Aug. 18 | Baidu | Hong Kong/U.S. ADR | HKEX board meeting list | AI cloud, AI search, ad migration, Apollo Go |
| Aug. 18 | Xiaomi | Hong Kong | HKEX board meeting list | Smartphone margin, EV deliveries, EV gross margin |
| Aug. 19 | HKEX | Hong Kong | Company financial calendar | Cash market turnover, derivatives, listings |
| Aug. 20 | Walmart | U.S. | Company calendar shows materials around 6:00 a.m. CT | Comparable sales, e-commerce profit, full-year guidance |
| Aug. 20 | Pop Mart | Hong Kong | HKEX board meeting list | Overseas growth, IP concentration, channel efficiency |
| Aug. 24 | XPeng | Hong Kong/U.S. ADR | HKEX board meeting list | Deliveries, vehicle margin, R&D, cash burn |
The first dates to mark are August 11 to 13. According to SMCI's preliminary business update, the company will discuss fiscal 2026 fourth-quarter and full-year results at 5:00 p.m. ET on August 11. CoreWeave has also scheduled its second-quarter call for the same time window. Then Tencent's investor calendar lists an 8:00 p.m. HKT second-quarter results call on August 12, while Applied Materials' earnings schedule falls after the U.S. market close on August 13.
For Hong Kong-listed companies, investors can use the HKEX board meeting list to check review windows. The list may keep changing, so company investor relations pages should be checked again before publication or trading decisions. For dual-listed companies, investors also need to distinguish Hong Kong dollar counters, renminbi counters and ADR tickers, so that trading sessions are not mixed up.
Summary: The first key earnings window is concentrated from August 11 to 13, while the second is concentrated from August 18 to 20. Company calendars provide the strongest basis for confirmed wording, while the HKEX board meeting list helps identify review windows. Exact release times, calls and pre-market or after-hours attributes should still follow final company announcements.
AI Compute Earnings Start with SMCI and CoreWeave: Can Order Momentum Become Profit?
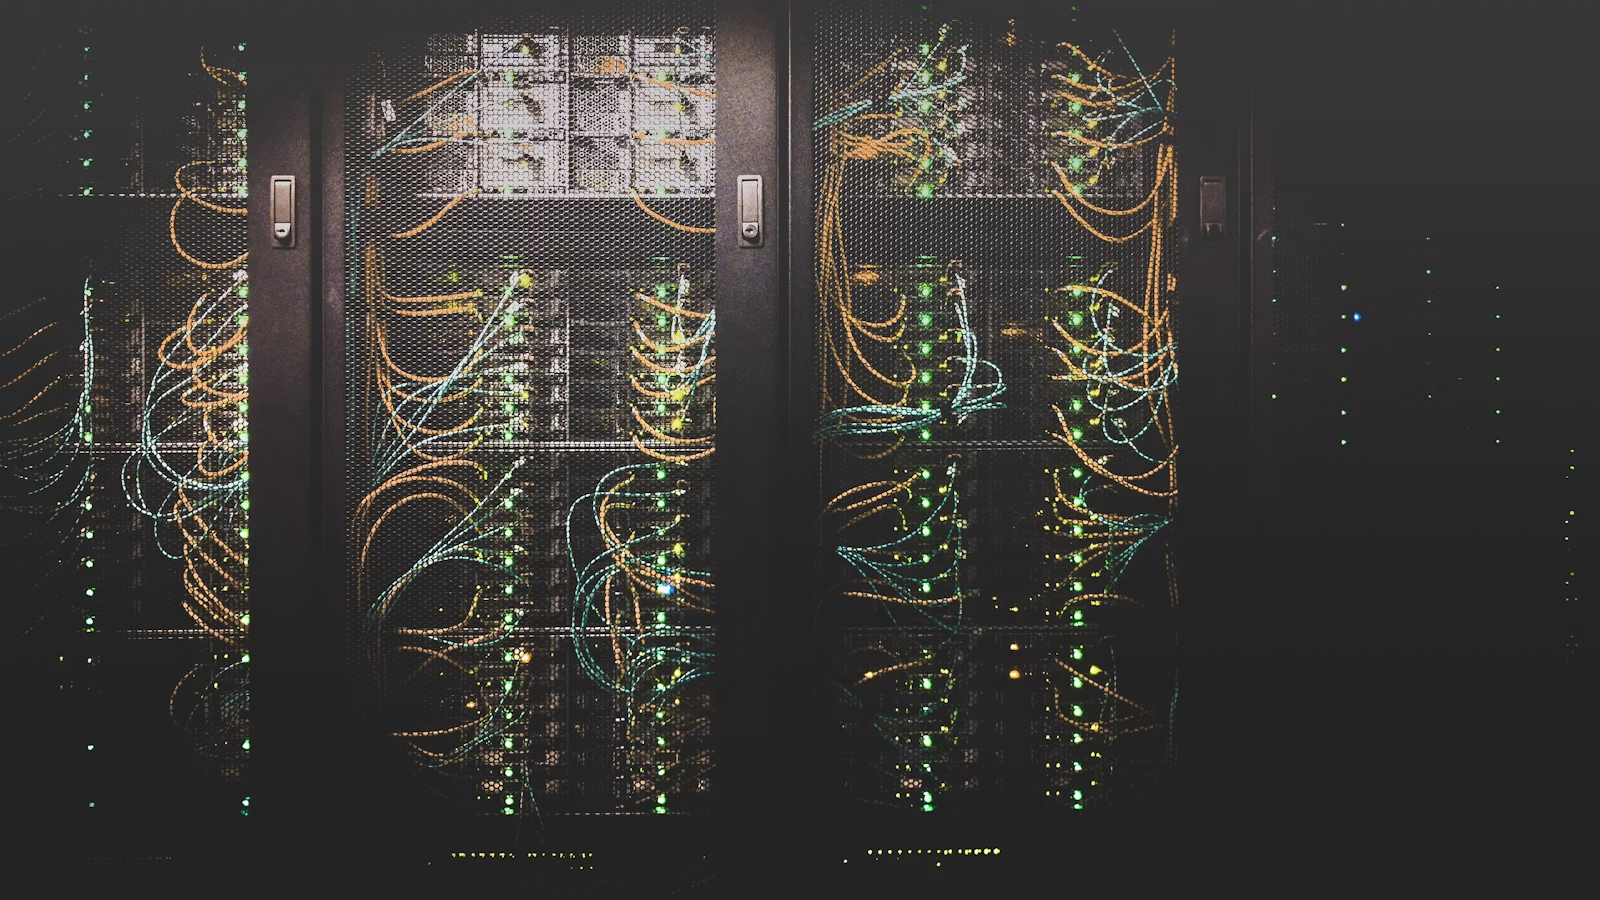
CoreWeave's second-quarter earnings schedule shows that the company will report after the U.S. market close on August 11 and hold its call at 5:00 p.m. ET, putting it in the same observation window as SMCI.
Both SMCI and CoreWeave benefit from AI compute demand, but they need to answer different questions. SMCI must prove that large server and liquid cooling orders can be delivered on schedule while margins hold up under changing customer and product mix. CoreWeave must show that fast-growing AI cloud revenue can cover depreciation, interest expense, data center construction and financing costs. Looking only at revenue growth can easily overstate the shareholder return from the AI compute boom.
| Company | Known Baseline | Core Earnings Question | Strong Signal | Risk Signal |
|---|---|---|---|---|
| SMCI | Preliminary Q4 revenue near the low end of $11.0 billion to $12.5 billion guidance | When will large orders convert into revenue? | Margin beats expectations and delivery cycles shorten | Revenue delays, inventory or receivables rise |
| SMCI | Preliminary gross margin of 15% to 17% | Can mix improvement continue? | Liquid cooling and rack-scale solutions lift value per system | A large customer presses down pricing |
| CoreWeave | Q1 revenue of $2.078 billion and revenue backlog of $99.4 billion | How fast does backlog convert? | New capacity comes online as planned | Power, GPU or construction delays |
| CoreWeave | Q1 net interest expense of $536 million | Can expansion generate free cash flow? | Compute utilization improves | Debt and interest grow faster than revenue |
SMCI's July preliminary update has already raised the information density of this earnings report. Revenue is expected near the low end of the previous guidance range, GAAP and non-GAAP gross margin are expected at 15% to 17%, well above the previous 8.2% to 8.4% guidance, and the company said new orders exceeded $60 billion in the fourth quarter, with record backlog at year-end. The numbers look strong, but the full report still needs to explain order mix, customer concentration, revenue recognition timing and whether the 15% to 17% margin included temporary mix benefits.
CoreWeave's tension is more about capital structure. Its first-quarter 2026 results showed revenue more than doubling year over year to $2.078 billion, revenue backlog of $99.4 billion and adjusted EBITDA margin of 56%. However, adjusted operating margin was only 1%, net loss was $740 million and net interest expense was $536 million. In other words, high demand visibility does not mean free cash flow has already matured.
After the reports, the two companies should be cross-checked across the same value chain. SMCI's rack-scale, liquid cooling and GPU system delivery pace can validate cloud providers' expansion progress. CoreWeave's capacity additions, utilization and financing arrangements can test whether server orders are supported by sustainable customer demand. If orders, delivery progress and margins all improve, the signal is more complete. If order value grows while cash consumption keeps expanding, the market may reassess the funding cost of growth.
Summary: SMCI and CoreWeave should not be read simply as two AI demand beneficiaries. SMCI is about order delivery, product mix and gross margin; CoreWeave is about backlog conversion, capex and interest burden. AI compute growth is more likely to become sustainable operating return only when demand, delivery, profit and cash flow improve together.
Tencent, JD.com and Baidu: Should Hong Kong Tech Earnings Be Judged by Growth Quality or Revenue Speed?

The shared question for Hong Kong technology companies is whether AI spending strengthens existing business models instead of only adding new costs. Tencent must show AI-driven efficiency in advertising, games and cloud. JD.com must explain the balance between instant retail investment and core retail profit. Baidu needs to prove that AI cloud and AI-native marketing growth can offset pressure from traditional search advertising adjustments.
| Company | First Priority | Second Priority | Cost Items Not to Ignore |
|---|---|---|---|
| Tencent | Domestic and international games, marketing services growth | Cloud, AI product usage and monetization | AI capex, new product operating costs |
| JD.com | JD Retail operating margin | Food delivery, instant retail, logistics revenue | Subsidies, fulfillment, customer acquisition and rider costs |
| Baidu | AI cloud infrastructure revenue | AI-native marketing, search transformation | Compute depreciation, R&D and autonomous driving spending |
Tencent's previous quarter set a strong comparison base. Tencent's first-quarter 2026 results showed total revenue rising 9% year over year to RMB196.458 billion, marketing services revenue growing 20% to RMB38.171 billion, domestic games revenue up 6% and international games revenue up 13%. Capital expenditure rose 16% year over year to RMB31.9 billion, but free cash flow also rose 20% to RMB56.7 billion. For the second quarter, the most important issue is not whether AI spending keeps rising, but whether ad pricing, game revenue, cloud growth and free cash flow continue to cover that spending.
JD.com's focus is closer to a profit reinvestment cycle. The HKEX list shows that its board plans to review interim results on August 13, while JD.com's investor relations news page is the direct place to confirm the final release time and call schedule. Investors should separate JD Retail, JD Logistics and new businesses, especially whether food delivery and instant retail investment push up sales and marketing expenses, and whether core retail profit remains resilient. If faster revenue growth mainly comes from subsidies while retention, order frequency and fulfillment efficiency do not improve, growth quality will be questioned.
Baidu is in the middle of a revenue mix transition. Baidu's first-quarter 2026 results showed AI cloud infrastructure revenue rising 79% year over year to RMB8.8 billion, GPU cloud revenue rising 184% and AI-native marketing services revenue growing 36% to RMB2.3 billion. In the second quarter, investors should keep watching AI cloud growth, AI application revenue, Baidu App engagement and changes in traditional marketing revenue, while also monitoring Apollo Go orders and unit economics. The market does not only need to see fast AI revenue growth; it needs to see that higher AI revenue share does not continuously dilute group margins and cash generation.
Summary: Tencent, JD.com and Baidu represent three different AI monetization paths. Tencent uses AI to improve advertising, gaming and cloud efficiency; JD.com invests in new scenarios around consumption; Baidu is shifting its revenue mix toward AI cloud and AI marketing. Earnings quality should be judged by growth, margin, capex and free cash flow together.
How to Read Xiaomi and Lenovo Earnings: Smartphone Costs, AI PCs or EV Margins?
Xiaomi and Lenovo are both exposed to component costs such as memory, processors and display panels, but Xiaomi also has a smart EV growth curve. Xiaomi's earnings are harder to read because investors need to evaluate smartphone share, average selling price, EV deliveries and new business losses at the same time. Lenovo needs to answer whether AI PC replacement demand can improve revenue mix and margin even as costs rise. Shipment growth matters much less if it lacks margin support.
| Dimension | Xiaomi | Lenovo | How to Judge |
|---|---|---|---|
| End demand | Smartphone shipments, ASP, overseas share | PC shipments, AI PC penetration | Separate channel stocking from real end demand |
| Cost pressure | Memory, SoC, subsidies, channel expenses | Memory, CPU, tariffs, supply chain | Compare sequential margin and management guidance |
| New growth | Smart EVs, IoT, internet services | AI servers, infrastructure solutions | Check whether revenue growth brings profit growth |
| Cash investment | EV R&D, plants and sales network | R&D, inventory and working capital | Compare operating cash flow and capex |
Xiaomi's first-quarter 2026 announcement provides the baseline for its interim results: smartphone revenue was RMB44.3 billion, smartphone gross margin was 10.1% and global shipments were 33.8 million units. Smart EVs, AI and other new initiatives generated RMB19.9 billion in revenue, with segment gross margin of 20.1% and operating loss of RMB3.1 billion. Orders and deliveries for the next-generation SU7 can improve scale, but purchase tax subsidies, key component inflation and model mix may also affect margin. EV volume should therefore be read together with vehicle revenue, gross margin and expenses.
For smartphones, the key is whether average selling price can offset memory price increases. Xiaomi's first-quarter smartphone ASP rose 8.2% year over year to RMB1,310, but smartphone gross margin was still affected by key component prices and competition. If the high-end mix rises in the second quarter, inventory stays healthy and gross margin improves sequentially, it would suggest that product mix is absorbing cost pressure. If shipment growth depends on promotions, profit improvement may be weaker.
Lenovo's earnings date also appears on the August 13 HKEX board meeting list. For AI PCs, investors should watch three questions: the share of products with local AI capabilities, whether ASP is rising, and whether software and services revenue can lift customer lifetime value. Its infrastructure solutions business can be compared with signals from SMCI, CoreWeave and Applied Materials to judge whether AI server demand is spreading from a few hyperscale customers to the enterprise market.
Summary: Xiaomi's priorities are EV deliveries and segment margin, smartphone margin and new business losses. Lenovo's priorities are AI PC penetration, ASP and infrastructure profitability. Component price inflation does not automatically reduce overall margin; the key is whether premium mix, price pass-through, inventory and expense efficiency improve together.
SMIC and Applied Materials: How Do Semiconductor Earnings Verify AI Expansion?
SMIC and Applied Materials sit in different parts of the semiconductor capex chain. SMIC reflects local wafer manufacturing demand, utilization and expansion pace. Applied Materials covers advanced logic, DRAM, NAND and advanced packaging equipment. Reading the two together helps investors distinguish whether AI expansion is concentrated in a few leading-edge nodes or spreading into memory, mature nodes and packaging.
| Indicator | What to Watch at SMIC | What to Watch at Applied Materials | Industry Meaning |
|---|---|---|---|
| Revenue and guidance | Wafer shipments, ASP, sequential growth | Total revenue and next-quarter guidance | Whether customer expansion continues |
| Gross margin | Utilization, depreciation, product mix | Systems and services margins | Whether scale can cover costs |
| Capex | New capacity construction and tool arrivals | Logic, DRAM and packaging orders | Where AI investment is spreading |
| Risk | Mature-node pricing, external restrictions | Export rules, customer concentration, supply chain | Whether orders can convert as planned |
SMIC's first-quarter 2026 results showed revenue of $2.5055 billion, a slight sequential increase, and gross margin of 20.1%, above 19.2% in the previous quarter but below 22.5% in the same period last year. In the second quarter, investors should watch whether utilization remains high, how wafer ASP changes and whether depreciation from heavy capital expenditure continues to limit gross margin. Revenue growth accompanied by higher utilization and stable margins is usually higher quality than growth driven only by low-price capacity filling.
Applied Materials has a stronger baseline. Its fiscal 2026 second-quarter results showed record revenue of $7.91 billion, up 11% year over year, and third-quarter revenue guidance of $8.95 billion, plus or minus $0.5 billion. Within semiconductor systems revenue, DRAM share rose from 27% to 29%, while flash share fell from 7% to 4%. That means this report is not only about whether total revenue meets guidance, but also whether advanced logic, HBM-related DRAM and advanced packaging equipment continue to drive orders.
The two companies should also be checked against end-market companies. If cloud providers, server makers and internet platforms keep raising AI capex, but equipment orders or foundry utilization do not strengthen at the same time, it may imply project delays, supply chain bottlenecks or spending concentrated in specific links. Conversely, if Applied Materials raises equipment demand and SMIC maintains high utilization, semiconductor strength may be broadening.
Summary: SMIC provides signals on wafer manufacturing utilization, pricing and depreciation, while Applied Materials provides order signals across advanced logic, DRAM and packaging equipment. When both improve, the case for AI capex spreading into manufacturing becomes stronger. If they diverge, investors should keep tracking node mix, customer concentration and project delay risks.
What Else Matters Around August 20, and How Should Investors Build an Earnings Watchlist?
The late-August window is not only about technology stocks. Walmart can verify consumer demand and e-commerce profit. HKEX reflects market turnover and listing activity. Pop Mart tests overseas IP commercialization, while XPeng continues to validate EV deliveries, vehicle margin and cash consumption. During a dense earnings period, the most effective approach is to build a checklist by industry signal and release time instead of chasing price moves after every report.
| Company | Date Wording | Core Indicators | Cross-Check Theme |
|---|---|---|---|
| Walmart | August 20, confirmed by company calendar | Comparable sales, e-commerce profit, inventory, full-year guidance | U.S. consumption and retail media |
| HKEX | August 19, confirmed by company financial calendar | Cash market turnover, derivatives, IPOs, investment income | Hong Kong market liquidity and new listings |
| Pop Mart | August 20, board meeting list | Overseas revenue, store efficiency, IP concentration | Chinese consumer brands overseas |
| XPeng | August 24, board meeting list | Deliveries, vehicle margin, R&D, cash | Smart driving and price competition |
Walmart's earnings calendar shows that materials are expected around 6:00 a.m. CT on August 20, with the call beginning at 7:00 a.m. CT. Comparable sales, inventory and e-commerce operating profit can help investors judge consumer resilience, and also provide cross-market reference for JD.com's retail and fulfillment investment. HKEX's financial calendar lists interim results on August 19, with attention on market turnover, new listings and investment income contribution to profit.
Pop Mart and XPeng can currently be found on the HKEX board meeting list, but conference call arrangements should still wait for company updates. For Pop Mart, investors need to separate overseas revenue growth driven by store expansion, same-store sales and a single hot IP. For XPeng, deliveries should be read together with vehicle margin, R&D spending and operating cash flow. The more growth depends on store openings, price cuts or subsidies, the more important it is to examine payback periods.
Before earnings are released, the checklist can be compressed into four layers:
- Date layer: Align Beijing time, Hong Kong time and U.S. Eastern time, and mark pre-market, after-hours and conference call windows.
- Expectation layer: Record consensus expectations, company guidance and the two or three indicators that matter most.
- Quality layer: Check margin, free cash flow, capex, inventory and receivables together.
- Risk layer: Predefine acceptable volatility, and watch after-hours liquidity, bid-ask spreads and order type differences.
If you need to organize Tencent, Xiaomi and other Hong Kong stocks together with SMCI, CoreWeave and other U.S. stocks, you can use biya to view relevant available securities, and check market classification through the U.S. stock list and Hong Kong stock list. Fees should also be included in post-earnings decisions: the biya pricing page currently shows U.S. stock commission at $0, while platform fees, external institution fees, exchange rates, bid-ask spreads and other applicable charges are subject to the pricing page, order page and latest platform rules. Service availability depends on the user's location, identity verification result, platform rules and applicable laws and regulations.
Summary: Earnings around August 20 add four important signals: consumption, market liquidity, consumer brand globalization and smart EVs. A more useful approach is to align time zones, record original guidance, filter key indicators and include margin, cash flow and trading costs in one checklist, instead of judging earnings quality only by pre-market or after-hours price moves.
FAQ
Which mid-to-late August 2026 earnings reports deserve the most attention?
Tencent, SMCI, CoreWeave, Xiaomi, Baidu, SMIC and Applied Materials deserve priority. Together they cover AI applications, servers, AI cloud, smart EVs, search monetization, wafer manufacturing and semiconductor equipment, forming a relatively complete verification chain for AI capital expenditure and commercialization.
Why should Hong Kong earnings dates still say "subject to final company announcements"?
The HKEX board meeting list mainly indicates that a company plans to review results on a given date. It does not always include the exact upload time, conference call or management communication schedule. The list can also be updated, so company announcements and investor relations pages should still be checked before publication.
Why are SMCI and CoreWeave useful to watch together?
SMCI reflects orders and delivery for AI servers, rack-scale systems and liquid cooling. CoreWeave reflects AI cloud capacity utilization, financing and cash recovery. Together, they help investors judge whether compute demand is moving from contracts and backlog into revenue, profit and cash flow.
What are the most important metrics in Tencent's second-quarter 2026 earnings?
The priorities are domestic and international game revenue, marketing services growth, cloud growth, capital expenditure and free cash flow. If AI continues to improve advertising efficiency and cloud demand while free cash flow covers investment, the commercialization signal will be more persuasive than rising capex alone.
Why should Xiaomi's interim results not be judged only by EV deliveries?
EV deliveries represent scale, but investors also need to look at EV segment gross margin, operating loss, R&D and channel expenses. Smartphones remain an important revenue source, and memory price increases, average selling price and premium model mix all affect group profit.
What risks matter when watching U.S. and Hong Kong stocks during a dense earnings period?
Investors should pay attention to changes in forecast dates, pre-market and after-hours liquidity, bid-ask spreads, order types, exchange rates and fees. Earnings data should also be compared with company guidance and cash flow, avoiding decisions based only on a single growth rate or short-term price move. Public information does not constitute investment advice.
*This article is provided for general information purposes and does not constitute legal, tax or other professional advice from BiyaPay or its subsidiaries and its affiliates, and it is not intended as a substitute for obtaining advice from a financial advisor or any other professional.
We make no representations, warranties or warranties, express or implied, as to the accuracy, completeness or timeliness of the contents of this publication.
Related Blogs of

Online Bank-to-Bank Transfers: Account Linking, Steps, and Limits


Cheapest Way to Transfer Money Internationally: Small vs. Large Transfers





Choose Country or Region to Read Local Blog
 Australia
 Austria
 Belgium
 Canada
 Cyprus
 Czech Republic
 Denmark
 Estonia
 Finland
 France
 Germany
 Greece
 Hong Kong
 India
 Indonesia
 Ireland
 Italy
 Japan
 Latvia
 Lithuania
 Luxembourg
 Malaysia
 Malta
 Morocco
 Nepal
 Netherlands
 New Zealand
 Norway
 Pakistan
 Philippines
 Poland
 Portugal
 Romania
 Singapore
 Slovakia
 Slovenia
 South Africa
 South Korea
 Spain
 Sweden
 Thailand
 United States
 Turkey
 United Arab Emirates
 United Kingdom
 Vietnam