
Dell, HPE, Micron, Arista, and NVIDIA: Which Is Most Sensitive to AI Hardware Budgets?




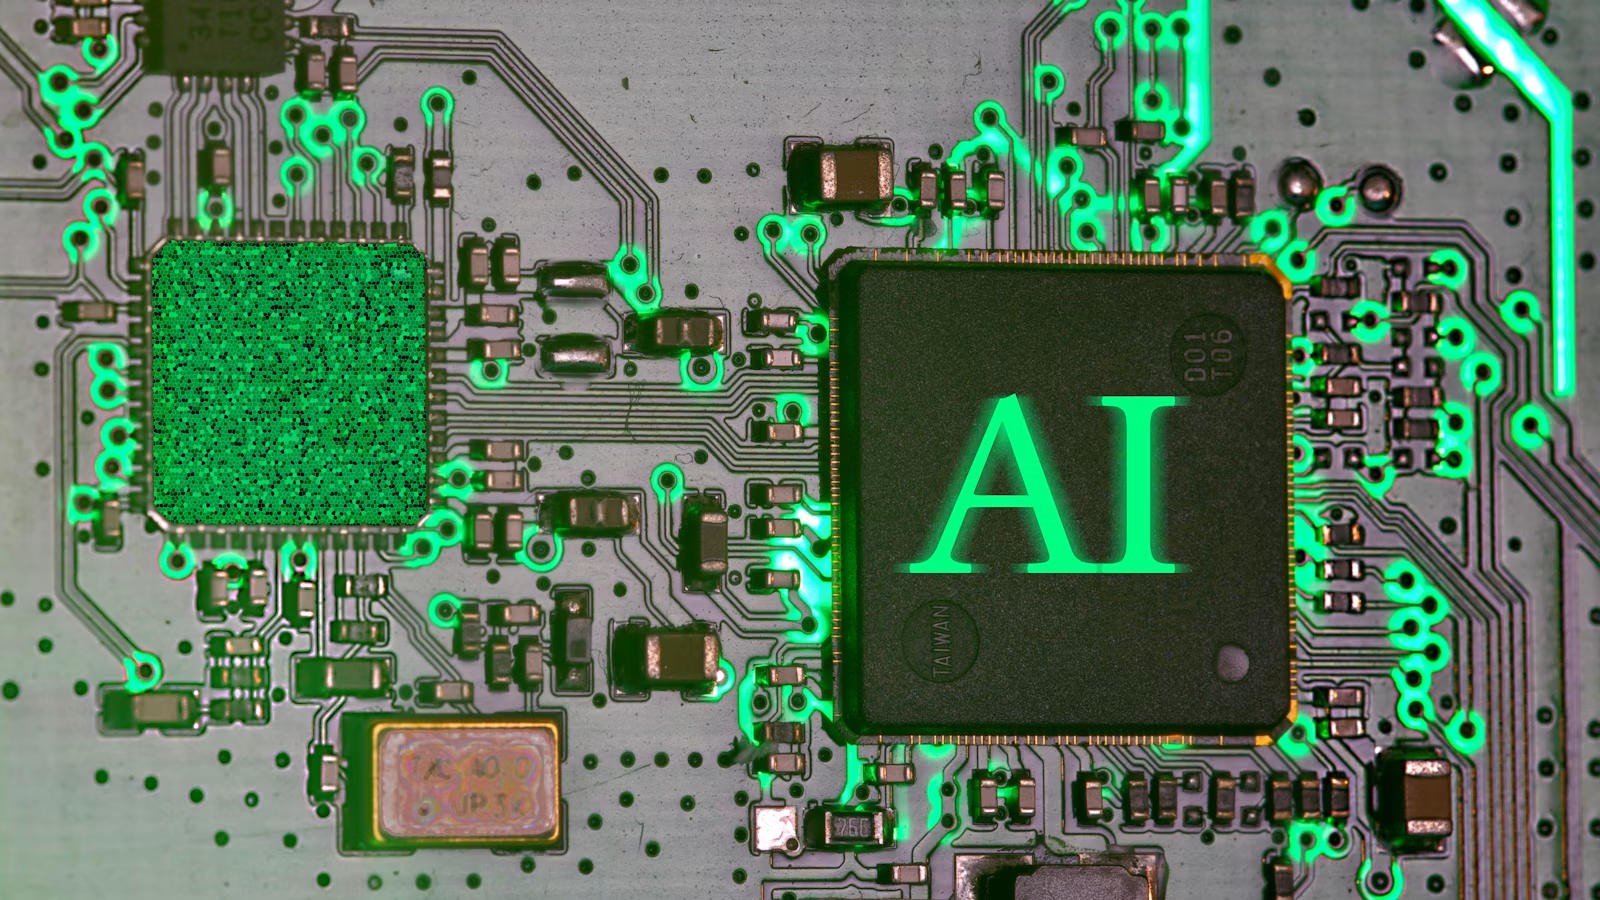
If you look only at direct revenue exposure to AI hardware budgets, NVIDIA is the most sensitive. If you focus on marginal changes driven by supply tightness, price increases, and gross-margin expansion, Micron may be more sensitive. Dell and HPE are more exposed to AI server orders, rack-level delivery, and enterprise deployment cycles, but their systems businesses carry higher component costs. Arista usually benefits later, yet it may show higher-quality profit leverage when AI clusters expand and high-speed networking upgrades accelerate.
Key Takeaways
- NVIDIA is the most direct beneficiary of AI compute budgets, but its high revenue base may limit marginal growth rates.
- Micron is more sensitive to HBM, DRAM, and SSD supply-demand changes, giving it stronger profit leverage.
- Dell is more of a direct proxy for AI server orders, with revenue sensitivity higher than profit sensitivity.
- HPE has a more balanced mix across servers, private cloud, and networking, but lower AI purity.
- Arista benefits later, yet its networking moat and operating margin profile are more attractive.
- “Budget sensitivity” does not automatically mean stronger stock performance; valuation and expectations still matter.
How Should AI Hardware Budget Sensitivity Be Defined?
To identify which company is most sensitive to AI hardware budgets, you cannot simply look at the share of AI revenue. A better approach is to compare revenue directness, value per system, pricing power, order conversion speed, gross margin, customer concentration, and valuation expectations. Using this framework, NVIDIA is closest to AI compute budgets, Micron is closest to the memory supply-demand cycle, Dell and HPE are closest to system delivery, and Arista is more exposed to networking spending after cluster expansion.
“AI hardware budget sensitivity” has at least three layers. The first is revenue sensitivity: when an enterprise spends one additional dollar of capital expenditure, can the company’s revenue increase quickly? The second is profit sensitivity: can incremental revenue translate into higher gross margin and operating profit? The third is stock-price sensitivity: has the market already priced in strong growth? If expectations are too high, even solid business growth may fail to push the stock higher.
NVIDIA has strong revenue and profit sensitivity because AI data-center projects typically begin with GPU, NVLink, networking, and rack-scale platform decisions before servers, memory, storage, and networking configurations are finalized. Micron follows a different logic. It may not capture the largest absolute revenue pool, but supply-demand shifts in HBM, server DRAM, and data-center SSDs can directly affect pricing and gross margin. Dell and HPE can recognize server revenue quickly, but they also absorb high GPU, memory, network-card, and liquid-cooling costs. Arista’s demand is usually released after servers are deployed, but its switching architecture, networking operating system, and customer qualifications create higher added value.
| Company | Main Budget Entry Point | Revenue Sensitivity | Profit Sensitivity | Demand Conversion Sequence | Key Limitation |
|---|---|---|---|---|---|
| NVIDIA | GPUs, networking, AI platforms | Very high | Very high | Earliest | High base, export restrictions |
| Micron | HBM, DRAM, SSDs | High | Very high | Early | Memory cycle and capacity expansion |
| Dell | AI servers, rack-scale systems | Very high | Medium | Early | Server-system margins |
| HPE | Servers, storage, networking | Medium-high | Medium | Early to mid-cycle | Complex business mix |
| Arista | Switches, AI networking software | Medium-high | High | Mid-cycle | Customer concentration, delayed procurement |
Why not rank companies directly by AI revenue growth? Because revenue quality differs significantly across these businesses. A server vendor may report very high revenue growth, but a large share of that value may come from externally sourced GPUs and memory. A memory supplier may grow shipments more slowly than a server vendor, but price increases can drive a much larger gross-margin change. Networking orders may lag GPU orders, yet they may last longer during the cluster-expansion phase.
Summary: To compare the sensitivity of these five companies to AI hardware budgets, revenue leverage, profit leverage, and stock-price leverage must first be separated. NVIDIA is the most direct beneficiary of AI compute budgets. Micron is most exposed to HBM and DRAM pricing effects. Dell and HPE are more sensitive to server orders and rack-level delivery. Arista is more sensitive to cluster scale, port counts, and bandwidth upgrades. A sound comparison framework should include orders, revenue, gross margin, customer mix, and valuation expectations rather than relying only on AI revenue share or one quarter of growth.
NVIDIA vs. Micron: Who Benefits More Directly From AI Compute and Memory Budgets?

NVIDIA has the highest absolute revenue sensitivity to AI hardware budgets because GPUs, NVLink, networking, and full AI platforms sit at the center of capital expenditure. Micron may have stronger marginal profit sensitivity because HBM, server DRAM, and data-center SSDs all benefit from capacity upgrades, supply constraints, and pricing changes. When budgets continue expanding, both companies benefit. If budget growth slows, Micron usually faces greater cyclical volatility.
NVIDIA’s advantage is its role as the “platform entry point.” AI data-center projects usually begin by selecting an accelerator platform, after which servers, memory, networking, racks, power, and cooling systems are configured around the GPU. In the first quarter of fiscal 2027, NVIDIA reported that data-center revenue reached $75.2 billion, up 92% year over year; data-center networking revenue reached $14.8 billion, up 199% year over year. This shows that NVIDIA is no longer just a GPU supplier. It has become a core hardware platform company spanning compute, networking, and system-level architecture.
From a product-roadmap perspective, NVIDIA GB300 NVL72 uses a fully liquid-cooled, rack-scale architecture that integrates 72 Blackwell Ultra GPUs and 36 Grace CPUs in a single platform. This kind of architecture raises the value per system and pulls through demand for server vendors, memory suppliers, and networking equipment providers. In other words, NVIDIA not only absorbs AI budgets; it also helps determine how budgets are allocated across the upstream and downstream supply chain.
Micron’s advantage lies in “supply-demand amplification.” In the third quarter of fiscal 2026, Micron reported that revenue reached $41.46 billion, compared with $23.86 billion in the previous quarter and $9.30 billion in the year-ago period. In the AI era, memory demand is not limited to HBM. It also includes server DRAM, SOCAMM, enterprise SSDs, and data-center NAND. Micron has also announced that HBM4, SOCAMM2, and PCIe Gen6 data-center SSDs have entered volume production, showing that memory and storage are becoming part of AI platform upgrades.
| Comparison Dimension | NVIDIA | Micron |
|---|---|---|
| Main Budget Entry Point | GPUs, networking, AI platforms | HBM, DRAM, SSDs |
| Sensitivity to Server Count | Very high | High |
| Sensitivity to Per-System Configuration Upgrades | Very high | Very high |
| Sensitivity to Pricing Changes | Medium-high | Very high |
| Gross-Margin Stability | Relatively stronger | More cyclical |
| Main Risks | High base, export rules, custom ASICs | Capacity expansion, inventory, price reversal |
When AI budgets grow rapidly, NVIDIA benefits most directly because customers first need to define the GPU and platform. If HBM, DRAM, and NAND remain tight, Micron’s earnings upgrades may be more pronounced. If GPU shipments continue to grow but memory supply improves, Micron’s pricing leverage may weaken. If cloud providers increase custom ASIC development, NVIDIA may face share pressure, while Micron may still supply memory to multiple accelerator platforms.
Summary: NVIDIA is the most direct beneficiary of AI compute budgets among the five companies, and its platform strategy allows it to influence server, memory, and networking spending at the same time. Micron is a more typical profit-leverage beneficiary: HBM, server DRAM, and data-center SSDs can all benefit from capacity upgrades and price increases. If you focus on the absolute scale of AI capital expenditure, NVIDIA is more sensitive. If you focus on earnings revisions driven by supply tightness, Micron may show larger marginal changes. However, Micron is also more exposed to capacity expansion, inventory shifts, and price reversals, so short-term high margins should not be extrapolated in a straight line.
Dell vs. HPE: Who Is More Sensitive to Enterprise AI Server Orders?
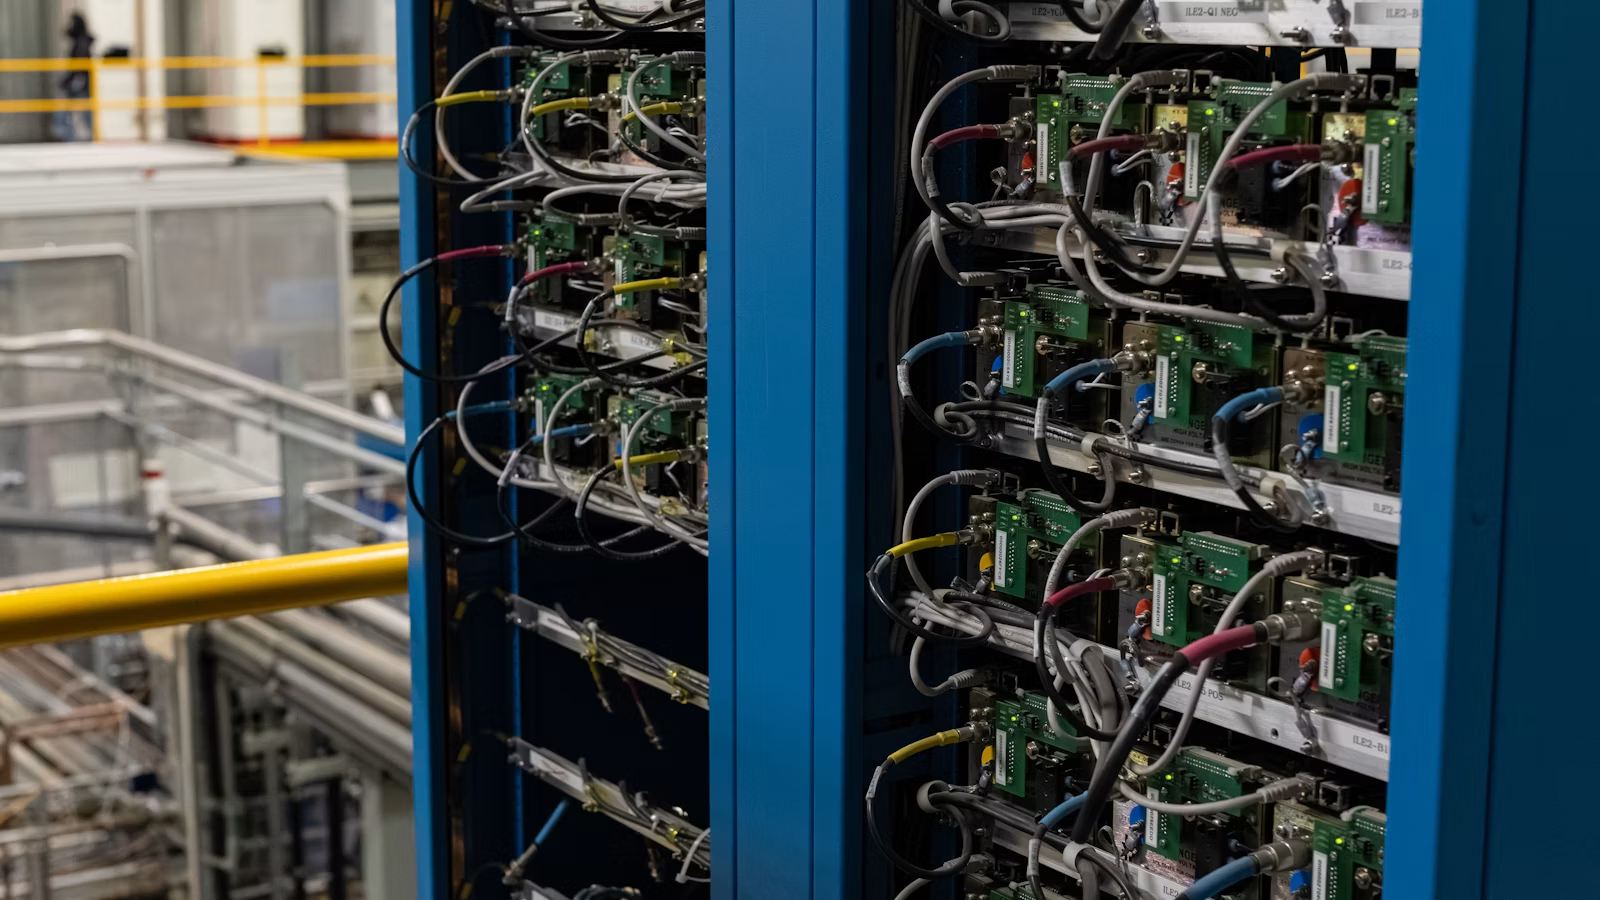
Dell has higher revenue sensitivity to AI server orders, as its AI orders, server revenue, and full-year guidance more directly reflect enterprise purchasing strength. HPE has slightly lower pure server sensitivity, but its combination of servers, storage, private cloud, and networking is more balanced. Put simply, Dell is closer to a proxy for AI server shipment volumes, while HPE is closer to a diversified exposure to enterprise infrastructure upgrades.
In the first quarter of fiscal 2027, Dell reported that AI orders reached $24.4 billion, AI-optimized server revenue reached $16.1 billion, and the company raised its full-year AI server revenue outlook to roughly $60 billion. Revenue in its Infrastructure Solutions Group reached $29 billion, up 181% year over year. These figures show that when enterprise AI budgets rise, Dell can often recognize revenue relatively quickly through servers and rack-scale systems.
Dell’s value is not limited to server assembly. Enterprise customers can purchase servers, storage, networking, power systems, liquid cooling, financing, and operations services through Dell. Dell AI Factory with NVIDIA already includes liquid-cooled PowerRack systems, PowerEdge servers, and NVIDIA GB200 NVL72 architecture, showing that server vendors are moving from individual server delivery toward rack-scale and cluster-scale delivery.
HPE follows a more “portfolio-based” path. In the second quarter of fiscal 2026, HPE reported that Cloud & AI revenue was $7.7 billion, up 22.9% year over year. Server revenue was $5.5 billion, up 32.7%, and Cloud & AI operating margin was 12.4%. HPE covers servers, storage, private cloud, and networking. After closing its acquisition of Juniper Networks, its combined networking and AI data-center capabilities became stronger.
| Comparison Dimension | Dell | HPE |
|---|---|---|
| AI Budget Entry Point | AI servers, racks, storage | Servers, private cloud, storage, networking |
| AI Server Purity | Higher | Medium |
| Enterprise Channel | Strong | Strong |
| Networking Synergy | Present, but less prominent than HPE | Stronger after Juniper integration |
| Revenue Recognition Sensitivity | Very high | Medium-high |
| Main Risks | Component costs, low-margin large orders | Integration execution, complex business mix |
The shared challenge for systems vendors is that revenue sensitivity is usually higher than profit sensitivity. GPUs, HBM, CPUs, high-speed network cards, and liquid-cooling systems account for a large share of bill-of-material costs, while large customers often have stronger bargaining power. After orders increase, vendors still need to procure components in advance, manage inventory, and wait for installation and acceptance. Backlog therefore does not necessarily convert into profit immediately. You should watch ISG or Cloud & AI operating margin, inventory, receivables, liquid-cooling attachment rates, and service revenue mix.
Summary: Dell is the more sensitive company to enterprise AI server orders, as its orders and server revenue can reflect customer purchasing strength relatively quickly. HPE has slightly lower pure server leverage, but its combination of servers, private cloud, storage, and networking makes it better positioned to capture broader enterprise AI infrastructure upgrades. Neither company is a simple “AI chip stock”; both are system-delivery businesses. Comparisons should not rely only on AI server revenue. Operating margin, order conversion, component costs, service attachment rates, and whether customers have sufficient power, data-center space, and cooling capacity are equally important.
Why Does Arista Benefit Later but Potentially Show Higher-Quality Budget Sensitivity?
Arista’s sensitivity to AI hardware budgets usually appears later than that of NVIDIA, Micron, and server vendors because customers first determine GPU, server, and rack scale before configuring switches, ports, and optical interconnects. But when AI systems expand from a single rack to large clusters, network bandwidth, congestion control, and automated operations become key bottlenecks. That is where Arista’s profit quality becomes more visible.
AI networking budgets are typically released in phases. During small-scale trials, customers may buy only a limited number of servers and basic switching equipment. In single-rack deployments, switches and network interface cards begin to follow server orders. In multi-rack clusters, 400G, 800G, and even 1.6T port counts can rise rapidly. In large AI factories, network software, telemetry, automation, and fault management become significantly more important.
In the first quarter of 2026, Arista reported that revenue reached $2.709 billion, up 35.1% year over year, while non-GAAP operating margin was 47.8%. Compared with server-system vendors, Arista’s network operating system, switching architecture, and customer qualifications create higher added value. Its 1.6T AI Fabric portfolio is designed for rack-scale AI infrastructure, supports air-cooled, liquid-cooled, and hybrid cooling environments, and addresses both scale-up and scale-out networking requirements.
| AI Deployment Stage | Main Purchases | Arista Benefit Level | Key Validation Metric |
|---|---|---|---|
| Small-scale trial | A small number of GPU servers | Low | Number of enterprise pilots |
| Single-rack deployment | Servers and basic switches | Medium | Switching-port orders |
| Multi-rack cluster | High-speed switching and optical interconnects | High | 800G and 1.6T shipments |
| Large AI factory | Network software and automation | Very high | Software attachment rate, cloud-customer revenue |
Arista’s risks are also clear. First, revenue may be concentrated among a small number of large cloud customers, making it more volatile if cloud capital expenditure slows. Second, cloud providers may develop in-house networking architectures or adopt alternative technical routes. Third, rising GPU orders do not guarantee synchronized network orders, because data-center power, liquid cooling, and construction schedules may delay delivery. Fourth, the market may already have priced in long-term growth in high-speed networking.
Summary: Arista is not the most direct beneficiary at the start of an AI budget cycle. Its value is released after server purchases move into scaled networking deployment. Its revenue sensitivity is lower than NVIDIA’s or Dell’s, but its network software, switching architecture, and high operating margin make its profit quality more attractive. You should closely track cloud-customer spending, data-center switching orders, 800G and 1.6T product mix, customer concentration, and network-software attachment rates. If AI clusters continue expanding, Arista’s demand cycle may last longer. If data-center construction is delayed, order conversion may also be pushed back.
How Should the Five Companies Be Ranked Under Different AI Budget Scenarios?
There is no fixed ranking that applies across all AI budget scenarios. When AI budgets accelerate broadly, NVIDIA and Dell are the most direct beneficiaries. When HBM and DRAM remain tight, Micron has stronger profit leverage. When enterprise private AI expands, HPE’s portfolio benefits more. When large clusters enter the networking-upgrade phase, Arista’s relative advantage rises. The final assessment must also incorporate valuation, free cash flow, and market expectations.
In a base-case scenario where AI capital expenditure continues to grow but the growth rate gradually normalizes, the companies can be ranked by industry sensitivity, not as investment recommendations:
- NVIDIA: Highest absolute AI revenue exposure;
- Micron: Strongest supply-demand and pricing leverage;
- Dell: Clearest server-order conversion;
- Arista: Later conversion, but higher margin profile;
- HPE: More diversified, more balanced exposure.
| Budget Scenario | Most Sensitive Companies | Secondary Beneficiaries | Main Pressure Points |
|---|---|---|---|
| AI budgets accelerate broadly | NVIDIA, Dell | Micron, HPE | No single obvious weak link |
| HBM and DRAM remain tight | Micron | NVIDIA | Dell and HPE margins face pressure |
| Enterprise private AI expands | Dell, HPE | Micron, Arista | Companies overly dependent on one cloud customer |
| Large clusters enter networking phase | Arista, NVIDIA networking | HPE | Pure server assembly |
| Cloud capital expenditure is cut | NVIDIA, Micron face larger volatility | Dell, Arista | Entire AI hardware chain |
| Memory supply recovers quickly | Dell, HPE benefit from lower costs | NVIDIA | Micron’s pricing leverage reverses |
Trading Observation Should Also Include Real Costs
If you track Dell, HPE, Micron, Arista, and NVIDIA, you should monitor not only earnings dates, AI revenue, orders, and margins, but also actual trading costs. U.S. stock trading costs are not limited to commissions; they may also include platform fees, external institutional fees, trading-activity fees, and other costs displayed during order placement. You can use Biya’s U.S. stock search to build a watchlist first, then decide whether to trade based on earnings changes, valuation, and risk tolerance.
Biya charges zero commission on U.S. equity trades. The platform fee is $0.005 per share, with a minimum of $0.99 per order and a maximum of 1% of transaction value. External institutional and trading-activity fees total $0.00396 per share. For fractional-share orders involving less than one full share, the platform charges 1% of the transaction value as the platform fee, capped at $1. Actual fees, order eligibility, and possible adjustments should be confirmed through the latest U.S. stock trading fee schedule and the amount shown on the order page.
To determine whether the ranking needs to be adjusted, track the following indicators:
- NVIDIA: data-center compute revenue, networking revenue, gross margin, platform transition speed;
- Micron: HBM share, DRAM and NAND pricing, data-center revenue, capital expenditure;
- Dell: AI orders, backlog, AI server revenue, ISG operating margin;
- HPE: Cloud & AI revenue, server margins, Juniper integration, networking revenue;
- Arista: cloud-customer spending, AI networking revenue, port speeds, customer concentration;
- Shared metrics across all five: free cash flow, inventory, receivables, and forward guidance.
Summary: From a supply-chain positioning perspective, NVIDIA is most sensitive to AI compute budgets, Micron is most sensitive to supply-demand and pricing changes, Dell is most sensitive to server orders and delivery, HPE is more sensitive to enterprise infrastructure portfolio spending, and Arista is most sensitive to cluster scale and network-bandwidth upgrades. Industry sensitivity should not be treated as an investment conclusion. High sensitivity means stronger upside leverage, but also greater downside volatility if budgets slow. A more disciplined approach is to first identify whether AI budgets are flowing into compute, memory, systems, or networking, then evaluate whether order conversion, margins, and valuation have already been fully priced in.
When comparing these five AI hardware companies, the key is to track budget flow rather than a single “AI concept” label. Biya can be used to monitor related U.S. stock prices, organize earnings windows, and build a hardware-chain watchlist. Users who meet applicable regional service requirements can also download the app to manage multi-asset market data and trading. Service availability depends on the user’s location, identity-verification status, platform rules, and applicable laws and regulations. The information above only discusses publicly available market information, industry logic, and fee structures. It does not constitute investment advice or a guarantee of returns.
FAQ
When AI Capital Expenditure Grows, Which Has Higher Revenue Leverage: NVIDIA or Dell?
NVIDIA usually has higher platform value and profit leverage, while Dell’s server revenue is more sensitive to shipment volume. NVIDIA more directly captures GPU, networking, and system-platform budgets. Dell mainly reflects the scale of AI server and rack delivery, but component costs can limit margin expansion.
Does Micron’s HBM Demand Growth Mean Commodity Memory Prices Will Keep Rising?
Not necessarily. HBM, server DRAM, and NAND have different capacity profiles, customers, and supply-demand structures. HBM is more directly affected by AI accelerator platform upgrades, while commodity DRAM and NAND are still influenced by inventory, capacity expansion, PC and smartphone demand, and enterprise purchasing cycles.
Will HPE’s Acquisition of Juniper Increase Its Sensitivity to AI Hardware Budgets?
It should increase HPE’s exposure to networking and enterprise AI infrastructure portfolios, but the actual impact depends on integration quality. If HPE can bundle servers, private cloud, and Juniper networking effectively, its sensitivity to AI data-center budgets should improve. If cross-selling is weak, revenue leverage may fall short of expectations.
Why Does Arista’s AI Networking Demand Lag GPU Server Demand?
Customers usually determine GPU count, server scale, and rack layout first, then design the network topology, port speeds, and optical interconnects. If data-center power, liquid cooling, or facility construction is delayed, switch and networking-software orders may also move later.
Which Profit Metrics Matter Most When AI Hardware Revenue Grows?
Gross margin, operating margin, free cash flow, inventory, and receivables should be reviewed first. Server-system vendors should be assessed through operating margin and order conversion, while chip and memory companies require more focus on gross margin, capacity expansion, and pricing cycles. A single comparison standard is not enough.
How Can Beginners Compare These Five AI Hardware Stocks Without Looking Only at P/E Ratios?
They should combine revenue growth, free cash flow, cycle position, customer concentration, and market expectations. A low P/E does not necessarily mean a stock is cheap, and a high P/E does not necessarily mean it is too expensive. The key question is whether future growth has already been fully priced in. Trading fees and service eligibility should also be checked against platform rules and local regulatory requirements.
*This article is provided for general information purposes and does not constitute legal, tax or other professional advice from BiyaPay or its subsidiaries and its affiliates, and it is not intended as a substitute for obtaining advice from a financial advisor or any other professional.
We make no representations, warranties or warranties, express or implied, as to the accuracy, completeness or timeliness of the contents of this publication.
Related Blogs of

DCA vs. Grid Trading in Crypto: Key Differences, Costs, and Risks


Chase Wire Transfer Routing Number: Domestic Wires and International SWIFT Codes




Choose Country or Region to Read Local Blog
 Australia
 Austria
 Belgium
 Canada
 Cyprus
 Czech Republic
 Denmark
 Estonia
 Finland
 France
 Germany
 Greece
 Hong Kong
 India
 Indonesia
 Ireland
 Italy
 Japan
 Latvia
 Lithuania
 Luxembourg
 Malaysia
 Malta
 Morocco
 Nepal
 Netherlands
 New Zealand
 Norway
 Pakistan
 Philippines
 Poland
 Portugal
 Romania
 Singapore
 Slovakia
 Slovenia
 South Africa
 South Korea
 Spain
 Sweden
 Thailand
 United States
 Turkey
 United Arab Emirates
 United Kingdom
 Vietnam