
How Should You Read U.S. Stocks After CPI? A Checklist for Yields, the Dollar, and Sector Rotation




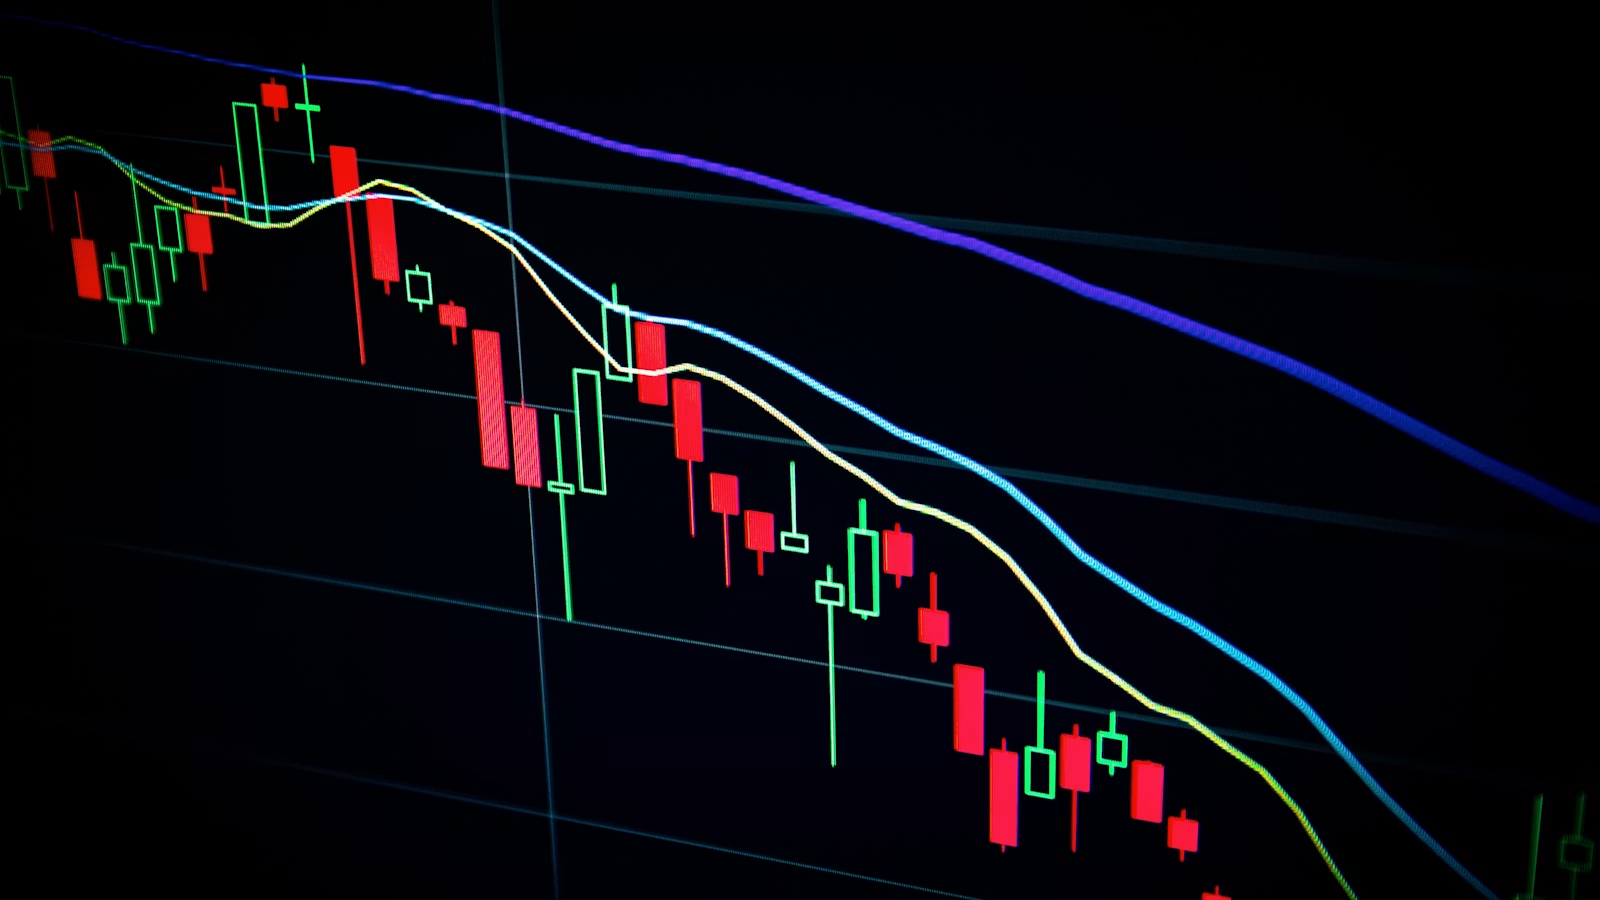
After CPI is released, you should not focus only on whether inflation is “high” or “low.” The first step is to compare the data against expectations, then watch 2-year and 10-year Treasury yields, the U.S. Dollar Index, oil prices, and sector strength. What really moves stocks is not one headline CPI number, but whether markets reprice the Federal Reserve path, real rates, and earnings expectations. If you follow the Nasdaq, S&P 500, Russell 2000, bank stocks, technology stocks, consumer stocks, and defensive sectors, a better framework is: CPI details, rates, dollar, sector rotation, and trading checklist.
Key Takeaways
- After CPI, first compare actual data with expectations, not just year-over-year inflation.
- The 2-year yield reflects rate-cut expectations, while the 10-year yield affects valuations.
- A stronger dollar often weighs on multinational earnings and risk-asset sentiment.
- Technology, small caps, banks, energy, and consumer stocks react through different channels.
- Sector rotation should be read together with real rates, oil prices, and earnings expectations.
- Before trading, check fees, liquidity, bid-ask spreads, and event-driven volatility risk.
What CPI Details Should You Check First After the Release?
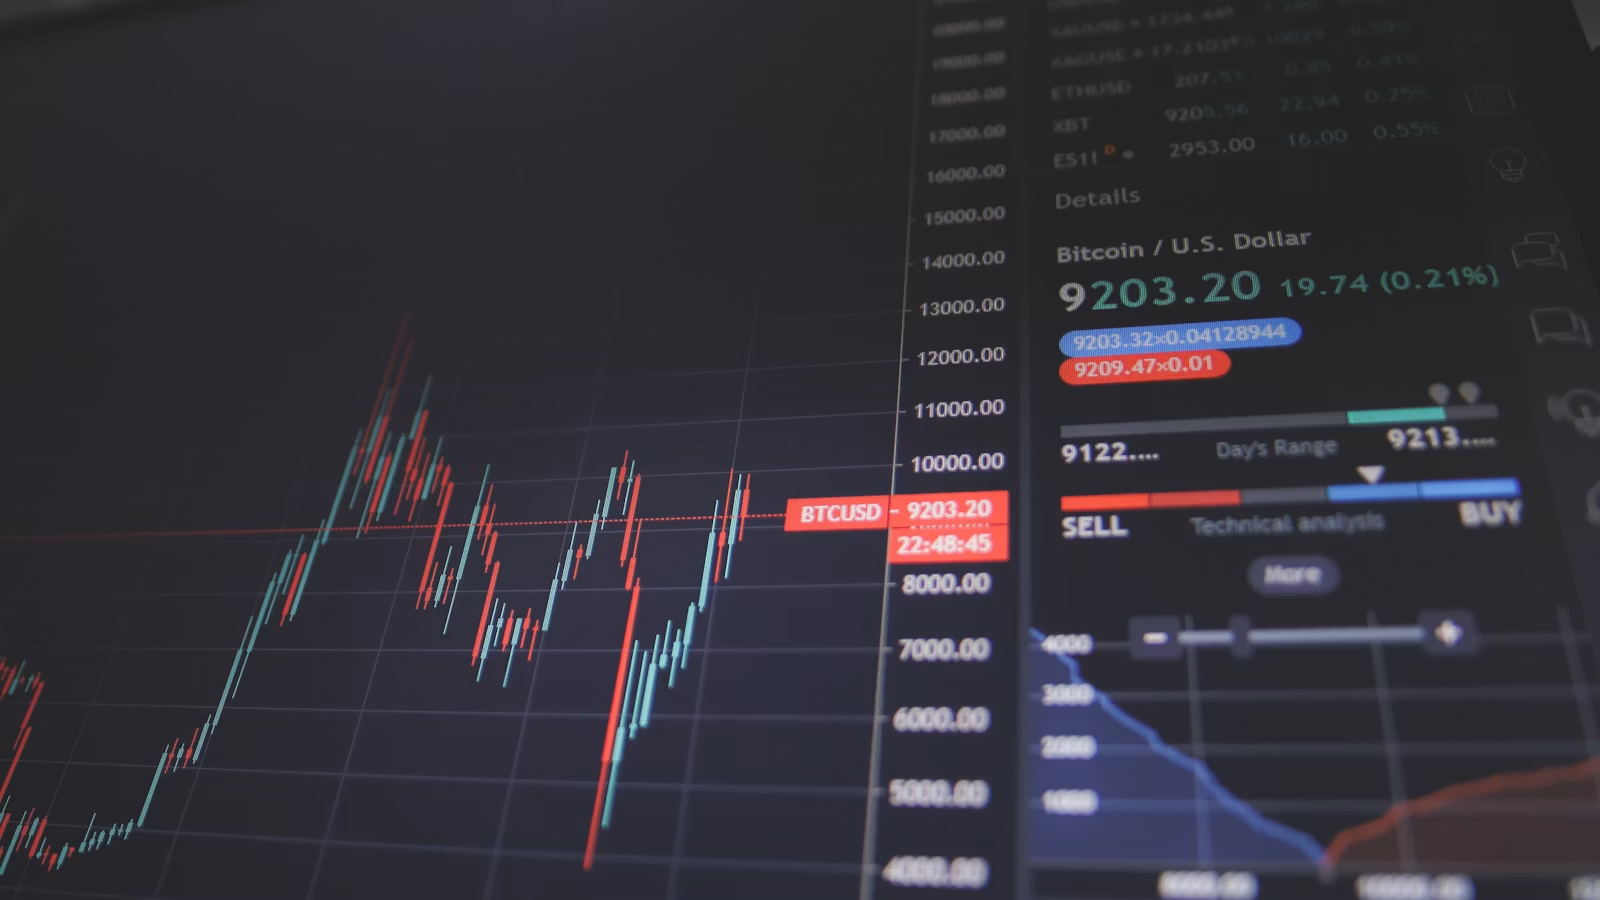
After CPI is released, the first step is not to immediately decide whether U.S. stocks should rise or fall. You should break down headline CPI, core CPI, month-over-month change, year-over-year change, shelter, energy, services inflation, and goods inflation. Only after identifying where inflation pressure is coming from can you judge the likely direction of Treasury yields, Fed expectations, and sector rotation. If CPI is above expectations mainly because of oil prices, the market reaction will differ from a renewed acceleration in core services inflation. If CPI is below expectations because demand is weakening, stocks may not keep rising.
The U.S. Bureau of Labor Statistics’ June 2026 CPI-U showed that the Consumer Price Index rose 3.5% year over year, with energy prices up 15.7% and gasoline still an important contributor. This type of data shows why markets cannot look only at headline CPI. Investors also need to judge whether the energy shock is sustainable and whether core inflation is truly cooling.
Headline CPI reflects broad consumer price pressure and includes food and energy, so it is more easily affected by oil prices, food prices, and geopolitical risks. Core CPI excludes food and energy and better reflects inflation stickiness, especially in shelter, core services, medical care, insurance, and related categories. Equity traders usually pay closer attention to core CPI because it is more likely to influence the Fed’s judgment on whether inflation is sufficiently under control.
| Item to Watch | What It Represents | Common Impact on U.S. Stocks |
|---|---|---|
| CPI YoY | Broad inflation direction | Shapes the long-term inflation narrative |
| CPI MoM | Current monthly price momentum | More important for short-term price reactions |
| Core CPI | Inflation stickiness | Affects Fed policy expectations |
| Shelter inflation | Services-inflation inertia | Influences rate-cut timing expectations |
| Energy inflation | Oil and supply shocks | Affects consumption, airlines, and transportation |
| Actual vs. expected | Market surprise or disappointment | Drives the first wave of volatility |
It is also important to remember that “below expectations” does not automatically mean bullish. If CPI comes in lower because energy prices fall while core services remain sticky, the market may only briefly trade the rate-cut narrative. If inflation cools because consumer demand is weakening, cyclical stocks, small caps, and discretionary consumer names may come under pressure. Conversely, if CPI is slightly above expectations but shelter and services components are moving lower, the bond market may not deliver a strongly hawkish reaction.
For short-term trading, month-over-month data is more sensitive than year-over-year data. Year-over-year readings can be influenced by base effects from the prior year, while month-over-month readings show current price momentum more directly. If monthly inflation keeps weakening, markets are more likely to believe the inflation trend is improving. If year-over-year inflation falls but monthly momentum rises again, yields may still move higher. The Bureau of Labor Statistics’ CPI measure covers a basket of goods and services purchased by urban consumers, which is why it feeds into rate expectations, consumer-stock earnings, corporate cost assumptions, and real-income analysis.
Summary: After CPI is released, you should not rely only on the headline number. You need to identify the source of inflation, its stickiness, and the gap versus expectations before discussing U.S. stock direction. Headline CPI matters more for market sentiment, core CPI matters more for policy expectations, monthly data matters more for short-term trading, and shelter and services inflation matter more for the medium-term rate path. If energy drives headline CPI higher, energy, airlines, transportation, and consumer sectors may diverge. If core services inflation rebounds, high-valuation growth stocks face more pressure. Breaking down CPI details first helps you avoid misreading yields, the dollar, and sector rotation later.
How Do Treasury Yields Shape the Stock-Market Reaction After CPI?
CPI usually affects U.S. stocks first through Treasury yields. The 2-year yield is more sensitive to Fed policy expectations, while the 10-year yield has a greater impact on equity valuation discount rates and risk appetite. If CPI beats expectations and pushes yields higher, growth stocks and high-valuation sectors are more likely to face pressure. If CPI comes in below expectations and pulls yields lower, the Nasdaq, small caps, and long-duration assets are more likely to rebound.
The 2-year Treasury yield can be understood as the market’s quick vote on the future policy-rate path. In its June statement, the Fed kept the federal funds target range at 3.50%–3.75%, showing that policy was still in a wait-and-see phase around inflation and labor-market data. Once CPI deviates from expectations, the 2-year yield often reacts first: a move higher means rate-cut expectations are being reduced, while a move lower means rate-cut expectations are rising.
The 10-year yield has a broader impact. It includes not only policy-rate expectations, but also inflation expectations, term premium, fiscal supply, global capital demand, and growth expectations. MarketWatch noted that on July 20, 2026, the 10-year Treasury yield rose to around 4.6%, putting pressure on U.S. stocks. The higher the long-end yield, the lower the present value of future cash flows, which tends to hurt high-valuation technology stocks, software stocks, REITs, and utilities.
| Yield Move | What It Usually Means | Impact on U.S. Stocks | More Sensitive Sectors |
|---|---|---|---|
| 2-year yield rises quickly | Policy-rate expectations become more hawkish | Growth valuations are pressured | Technology, software, small caps |
| 2-year yield falls | Rate-cut expectations rise | Risk appetite improves | Nasdaq, Russell 2000 |
| 10-year yield rises | Discount rates and real rates increase | Index valuations come under pressure | Technology, REITs, utilities |
| 10-year yield falls | Pressure on long-duration assets eases | Growth stocks may rebound | Semiconductors, cloud, AI |
| Long-end yields rise while short-end yields are stable | Term premium rises | Banks may benefit relatively | Banks, insurers |
The yield curve can also help you understand sector rotation. If the 2-year and 10-year yields rise together, it usually means the market is worried again about inflation or hawkish policy, which puts broader pressure on equities. If the short end rises while the long end stays stable, the market is mostly cutting rate-cut expectations, which hurts small caps and growth stocks. If the long end rises while the short end barely moves, fiscal concerns, oil prices, or term premium may be driving the move, bringing banks and insurers into focus. If both the short and long ends fall while the dollar weakens, growth stocks, small caps, and consumer discretionary names are more likely to recover.
You can track FRED’s 2-year Treasury yield and 10-year Treasury yield, then compare the relative strength of the Nasdaq, S&P 500, and Russell 2000 to judge capital preference. If CPI is below expectations but the 10-year yield does not fall, the bond market may not fully accept the inflation-cooling narrative. If CPI is slightly high but yields decline, markets may be focusing more on growth concerns or future disinflation.
Summary: After CPI, yields are closer to the core of market trading than the headline CPI number itself. The 2-year yield tells you whether markets are repricing the Fed path, while the 10-year yield tells you whether valuation discount rates are changing. If yields rise because inflation remains sticky, technology stocks, small caps, and high-valuation sectors are more likely to come under pressure. If yields fall because inflation is cooling, growth stocks and long-duration assets may benefit. If yields fall because of growth concerns, defensive sectors may outperform instead. The first wave of the stock-market reaction after CPI usually needs confirmation from the bond market.
How Do the U.S. Dollar Index and Oil Prices Affect Risk Appetite After CPI?

After CPI is released, the U.S. Dollar Index and oil prices help you judge whether the market is trading “cooling inflation” or “inflation persistence plus safe-haven demand.” A stronger dollar usually means weaker global risk appetite and may weigh on multinational earnings, commodities, and emerging-market assets. Higher oil prices can make the disinflation story less stable and increase divergence among energy, airlines, consumer, and transportation stocks.
A stronger dollar usually has three common causes. First, CPI comes in above expectations, rate-cut expectations cool, and U.S. interest rates look more attractive relative to other economies. Second, geopolitical risk rises and the dollar receives safe-haven demand. Third, global growth concerns intensify and capital flows back into dollar assets. Reuters reported that on July 21, 2026, the Dollar Index approached a one-week high, as markets digested Middle East tensions, oil prices, and interest-rate expectations. That is a typical case of why the dollar matters after CPI.
A stronger dollar affects U.S. stocks in several ways. Multinational technology and consumer companies face translation pressure on overseas revenue. Commodities and resource assets may weaken because they are priced in dollars. Emerging markets and higher-risk assets often see lower sentiment. Companies with mostly dollar-denominated revenue and more domestic cost structures may be relatively stable. In other words, the dollar is not simply a “bearish for U.S. stocks” indicator. It is a key signal for risk appetite, earnings translation, and capital flows.
Oil prices affect the sustainability of CPI trends. If CPI cools mainly because energy prices fell, but oil prices then rebound, markets may not fully believe the disinflation trend. Reuters’ market coverage noted that swings between Middle East tensions and ceasefire expectations kept Brent crude prices important for yields and the dollar. Higher oil prices typically support energy stocks, but they also raise cost pressure for airlines, transportation, chemicals, and some consumer companies, while potentially reducing consumers’ disposable income.
| Combined Signal | Market Meaning | Likely U.S. Stock Style Bias |
|---|---|---|
| Dollar down + yields down | Inflation pressure eases, risk appetite improves | Growth stocks and small caps benefit more |
| Dollar up + yields up | Inflation or policy pressure rises | High-valuation sectors face pressure |
| Dollar up + oil up | Safe-haven demand and inflation risk coexist | Energy and defensives may outperform |
| Dollar down + oil stable | Rate-cut trade becomes smoother | Technology and consumer discretionary benefit |
| Yields down + dollar up | Growth concerns or safe-haven demand | Defensives may outperform |
When the dollar, oil, and yields all point in the same direction, the market signal is clearer. For example, a weaker dollar, lower yields, and stable oil prices usually suggest easing inflation pressure and improving risk appetite. A stronger dollar, higher yields, and rising oil prices can create both valuation pressure and cost pressure. If the three signals conflict, sector rotation becomes more important than index direction, and the risk of chasing short-term moves increases significantly.
Summary: After CPI, the U.S. stock-market reaction should not be read only through the bond market. You also need to see whether the dollar and oil prices confirm the same narrative. A weaker dollar, lower yields, and stable oil prices are usually more supportive for risk assets. A stronger dollar, higher yields, and rising oil prices tend to pressure high-valuation growth stocks and increase cost concerns. If the dollar strengthens while yields fall, the market may be trading safe-haven demand or growth concerns. If oil rises while core CPI falls, sector divergence may matter more than index direction. The role of the dollar and oil is to help you judge whether risk appetite has truly improved after CPI.
CPI Sector-Rotation Checklist: How Should You Watch Technology, Small Caps, Financials, Consumer Stocks, and Defensives?
The key to sector rotation after CPI is identifying whether the market is trading “higher rate-cut expectations,” “sticky inflation,” or “growth concerns.” When yields fall and the dollar weakens, technology, semiconductors, small caps, and consumer discretionary stocks are more likely to benefit. When yields rise and the dollar strengthens, banks, energy, and defensive sectors may hold up better. If CPI cools but growth weakens, defensive stocks may outperform cyclicals.
Technology stocks and semiconductors start with real rates. AI, cloud computing, software, and semiconductor stocks usually depend more on future cash flows. When the 10-year yield and real rates rise, valuation discount pressure increases. When CPI comes in below expectations and pushes yields lower, long-duration assets are more likely to enjoy valuation repair. Useful instruments and groups to watch include the Nasdaq 100, XLK, SMH, software ETFs, and core AI supply-chain companies.
Small caps and cyclical stocks depend more on the financing environment. The Russell 2000 is more sensitive to rates and credit conditions because small and mid-sized companies are more affected by borrowing costs, profit margins, and debt refinancing pressure. If CPI cools, the 2-year yield falls, the dollar weakens, and credit spreads remain stable, small caps usually have greater upside elasticity. But if CPI cools because demand is weakening, cyclical stocks and small caps may only experience a short-term rebound, with weaker sustainability.
Banks and insurers should be read through the yield curve. A rising long-end yield and a steeper curve may improve net interest margin expectations. But if yields rise because inflation is sticky and policy pressure is building, credit risk may also increase. Energy stocks depend on oil prices and supply risks. They may outperform when oil rises, but they do not necessarily lift overall risk appetite. Consumer staples, utilities, and healthcare tend to outperform in growth-scare and safe-haven environments, but rising long-end yields can pressure high-dividend valuations.
| Post-CPI Market Combination | More Likely to Outperform | More Likely to Lag | Core Interpretation |
|---|---|---|---|
| CPI below expectations + yields down | Technology, semiconductors, small caps | Defensives relatively lag | Rate-cut expectations trade |
| CPI above expectations + yields up | Energy, financials, defensives | Technology, REITs, small caps | Sticky inflation trade |
| CPI cooling + weaker dollar | Consumer discretionary, growth stocks | Dollar defensive assets | Risk appetite improves |
| CPI cooling + weak data | Consumer staples, utilities | Cyclicals, small caps | Growth-concern trade |
| Energy pushes CPI higher | Energy relatively strong | Airlines, transportation, consumer stocks | Cost-pressure trade |
| Core services inflation rebounds | Financials relatively resilient | Long-duration growth stocks | Rate path repricing |
Consumer sectors also need to be separated. Consumer discretionary depends more on real income, credit conditions, and consumer confidence. It benefits more when CPI cools, oil is stable, and the dollar weakens. Consumer staples are more defensive and tend to hold up better when growth concerns rise. Airlines, transportation, retail, restaurants, and travel are more sensitive to energy prices and wage costs, so they cannot be judged only by the phrase “inflation is cooling.”
Index weights matter as well. The S&P 500 and Nasdaq are heavily concentrated in large technology stocks. If large-cap tech rebounds after CPI, the index may rise even if small caps, regional banks, or consumer sectors do not improve at the same pace. Conversely, if equal-weight indexes and the Russell 2000 outperform the Nasdaq, risk appetite may be broadening. After CPI, sector analysis should not stop at whether the index is green or red; you also need to judge whether participation is expanding.
Summary: After CPI, the most valuable task is not guessing the index direction, but identifying which macro combination the market is trading. If yields and the dollar fall together, technology, small caps, and consumer discretionary stocks are more likely to receive valuation support. If yields and the dollar rise together, high-valuation growth stocks face pressure, while energy, financials, and defensives may outperform. If CPI cools but economic data weakens, defensive sectors may lead. The purpose of a sector-rotation checklist is to translate CPI results into observable asset-price signals, not to mechanically buy or sell one group of stocks.
How Should You Build a Trading Watchlist After CPI Is Released?
After CPI is released, you can build a watchlist through six steps: data surprise, yield reaction, dollar reaction, index structure, sector rotation, and fees plus risk. First, judge whether CPI truly changes the Fed path. Then check whether Treasuries and the dollar confirm the signal. Finally, observe whether capital is flowing into technology, small caps, financials, energy, consumer stocks, or defensive sectors. If several signals conflict, reduce position size or wait for confirmation on the next trading day.
An effective workflow starts with macro data and then moves toward tradable assets. First, compare headline CPI, core CPI, month-over-month inflation, and market expectations. Second, confirm shelter, services, energy, and goods components. Third, watch 2-year and 10-year Treasury yields. Fourth, watch the Dollar Index, oil prices, and gold. Fifth, compare the relative strength of QQQ, SPY, and IWM. Sixth, check sector ETFs, industry leaders, and volume confirmation.
| Step | What to Watch | Key Question | Possible Action |
|---|---|---|---|
| Data | Headline CPI, core CPI, MoM | Did inflation materially deviate from expectations? | Set the macro direction |
| Rates | 2-year and 10-year yields | Is policy repricing confirmed? | Judge growth vs. value style |
| Dollar | DXY and major currencies | Is risk appetite improving? | Assess pressure on multinational earnings |
| Commodities | Oil and gold | Is inflation or safe-haven demand dominant? | Judge energy and defensives |
| Indexes | QQQ, SPY, IWM | Which one breaks out or rolls over first? | Identify capital preference |
| Sectors | XLK, XLF, XLE, XLY, XLU | Which assets show relative strength? | Build the sector list |
On CPI day, the first move can be misleading. Equity-index futures may spike or fall immediately after the data, only to be revised by yields, the dollar, and Fed speakers later. If CPI is below expectations but the 2-year yield does not fall, the rate-cut trade is not very solid. If CPI is above expectations but the dollar does not rise and yields do not move higher, the market may have already priced it in. Looking only at the first candle can easily lead you into event-driven noise.
If you are watching U.S. stock opportunities after CPI, you also need to look at real trading costs, not just index and sector direction. U.S. stock trading costs may include commissions, platform fees, external institutional fees, transaction activity fees, bid-ask spreads, and FX costs. Biya charges $0 commission for U.S. stock trading, while platform fees, external institutional fees, and other costs are subject to Biya U.S. stock trading fees and the order display. In a high-volatility event such as CPI day, spreads, slippage, and frequent rebalancing costs can directly affect realized returns.
For risk control, you can set three limits. First, avoid chasing orders immediately at the data-release moment; wait for confirmation from yields and the dollar. Second, do not use one CPI print to overturn your entire existing position logic. Third, if you use options, leveraged ETFs, or inverse products, separately evaluate volatility, time decay, tracking error, and liquidation risk. Being right on the macro direction does not mean your execution price is reasonable. Being right on sector direction also does not mean every individual stock will move in sync.
Summary: A post-CPI trading watchlist should follow a fixed process instead of chasing the first candle. You need to first judge whether the data changes policy expectations, then check whether yields, the dollar, and oil confirm the signal, and finally use index and sector strength to identify capital direction. If signals align, the trend is more likely to continue. If signals conflict, short-term volatility tends to rise. Before trading, include fees, spreads, slippage, and product risks in your cost assessment, so macro judgment does not hide execution risk.
If you follow U.S. stock opportunities after CPI, it is better to put data, rates, the dollar, oil prices, and sector strength into one watchlist instead of focusing only on index moves. Biya is a global multi-asset trading wallet that supports U.S. stocks, Hong Kong stocks, and digital asset trading. Subject to local laws and regulations, identity verification results, and platform rules, you can use Biya to monitor multi-asset market moves and track related tickers through Biya U.S. stock search. If multiple currencies are involved, you can also use Biya real-time exchange rates to check FX costs. This content only introduces publicly available market information, trading rules, and fee structures. It does not constitute investment advice. Service availability depends on the user’s location, verification status, platform rules, and applicable laws and regulations.
FAQ
Why Do U.S. Stocks Sometimes Rise First and Then Fall After CPI?
Because the first wave of trading reacts to the data surprise, while the second wave reacts to yields, the dollar, and earnings expectations. A lower-than-expected CPI print is not always sustainably bullish. If markets later worry about slowing growth, an oil rebound, or hawkish Fed commentary, stocks may give back gains.
Does a Higher-Than-Expected CPI Always Make the Nasdaq Fall?
No. Whether the Nasdaq falls depends on core CPI, the 10-year yield, real rates, and technology earnings expectations. If inflation beats expectations but yields do not rise meaningfully, or if the market has already priced in the surprise, the Nasdaq reaction may be limited.
Why Can Small Caps Outperform When CPI Comes in Below Expectations?
Small caps are usually more sensitive to financing costs and rate-cut expectations. If cooling CPI pushes the 2-year yield lower, weakens the dollar, and improves credit conditions, the Russell 2000 may have more upside elasticity. But if disinflation comes from weakening demand, the move needs further confirmation.
What Does a Stronger Dollar After CPI Mean for U.S. Stocks?
A stronger dollar usually weighs on risk appetite and the translation of multinational earnings. The specific impact depends on why the dollar is rising. If it is driven by safe-haven demand or more hawkish rate expectations, pressure on growth stocks, commodity assets, and emerging-market-linked assets tends to be more visible.
How Can Ordinary Investors Avoid Chasing CPI-Day Moves?
They can wait for confirmation from yields, the dollar, and sector strength before adjusting positions. In execution, they can use limit orders, scale in or out, control position size, avoid excessive leverage, and check trading fees, bid-ask spreads, and platform rules.
Which Matters More to the Fed: CPI or PCE Inflation?
The Fed pays more attention to PCE, while markets tend to trade CPI more aggressively in the short term. CPI is released earlier and attracts high market attention, so it can quickly affect yields and equity futures. PCE is closer to the Fed’s preferred inflation gauge and has more influence on the medium-term rate path.
*This article is provided for general information purposes and does not constitute legal, tax or other professional advice from BiyaPay or its subsidiaries and its affiliates, and it is not intended as a substitute for obtaining advice from a financial advisor or any other professional.
We make no representations, warranties or warranties, express or implied, as to the accuracy, completeness or timeliness of the contents of this publication.
Related Blogs of

Crypto Trading Bots: Types, Costs, and Security Risks


Choosing a Stock Trading App: Beginner Checklist



Choose Country or Region to Read Local Blog
 Australia
 Austria
 Belgium
 Canada
 Cyprus
 Czech Republic
 Denmark
 Estonia
 Finland
 France
 Germany
 Greece
 Hong Kong
 India
 Indonesia
 Ireland
 Italy
 Japan
 Latvia
 Lithuania
 Luxembourg
 Malaysia
 Malta
 Morocco
 Nepal
 Netherlands
 New Zealand
 Norway
 Pakistan
 Philippines
 Poland
 Portugal
 Romania
 Singapore
 Slovakia
 Slovenia
 South Africa
 South Korea
 Spain
 Sweden
 Thailand
 United States
 Turkey
 United Arab Emirates
 United Kingdom
 Vietnam