
After BlueBird Deployment Delivers, How Much Valuation Upside Does ASTS Still Have? Commercialization and Cash Burn Risks





After BlueBird deployment delivers, ASTS’s valuation upside no longer depends only on whether satellites can be launched successfully. It depends on whether those satellites can enter operation, whether carriers can launch formal services, and whether revenue can shift from gateways and government projects toward repeatable SpaceMobile service revenue. ASTS still has a strong growth narrative, but its current stock price already reflects expectations for continuous coverage, carrier conversion, and global market expansion. For you, judging ASTS’s remaining upside requires tracking commercial revenue, cash burn, financing dilution, and deployment timelines together, rather than focusing only on single launch announcements.
Key Takeaways
- BlueBird deployment reduces technical risk, but it does not remove valuation pressure.
- ASTS’s current valuation is mainly betting on future service revenue, not current profit.
- Carrier partnerships cover a large user base, but paid conversion still needs financial validation.
- Cash reserves are strong, but satellite manufacturing, launches, and spectrum costs remain heavy.
- Future upside depends on whether revenue growth can outpace dilution and cash burn.
How Much Expectation Has ASTS Stock Already Priced In After BlueBird Deployment?
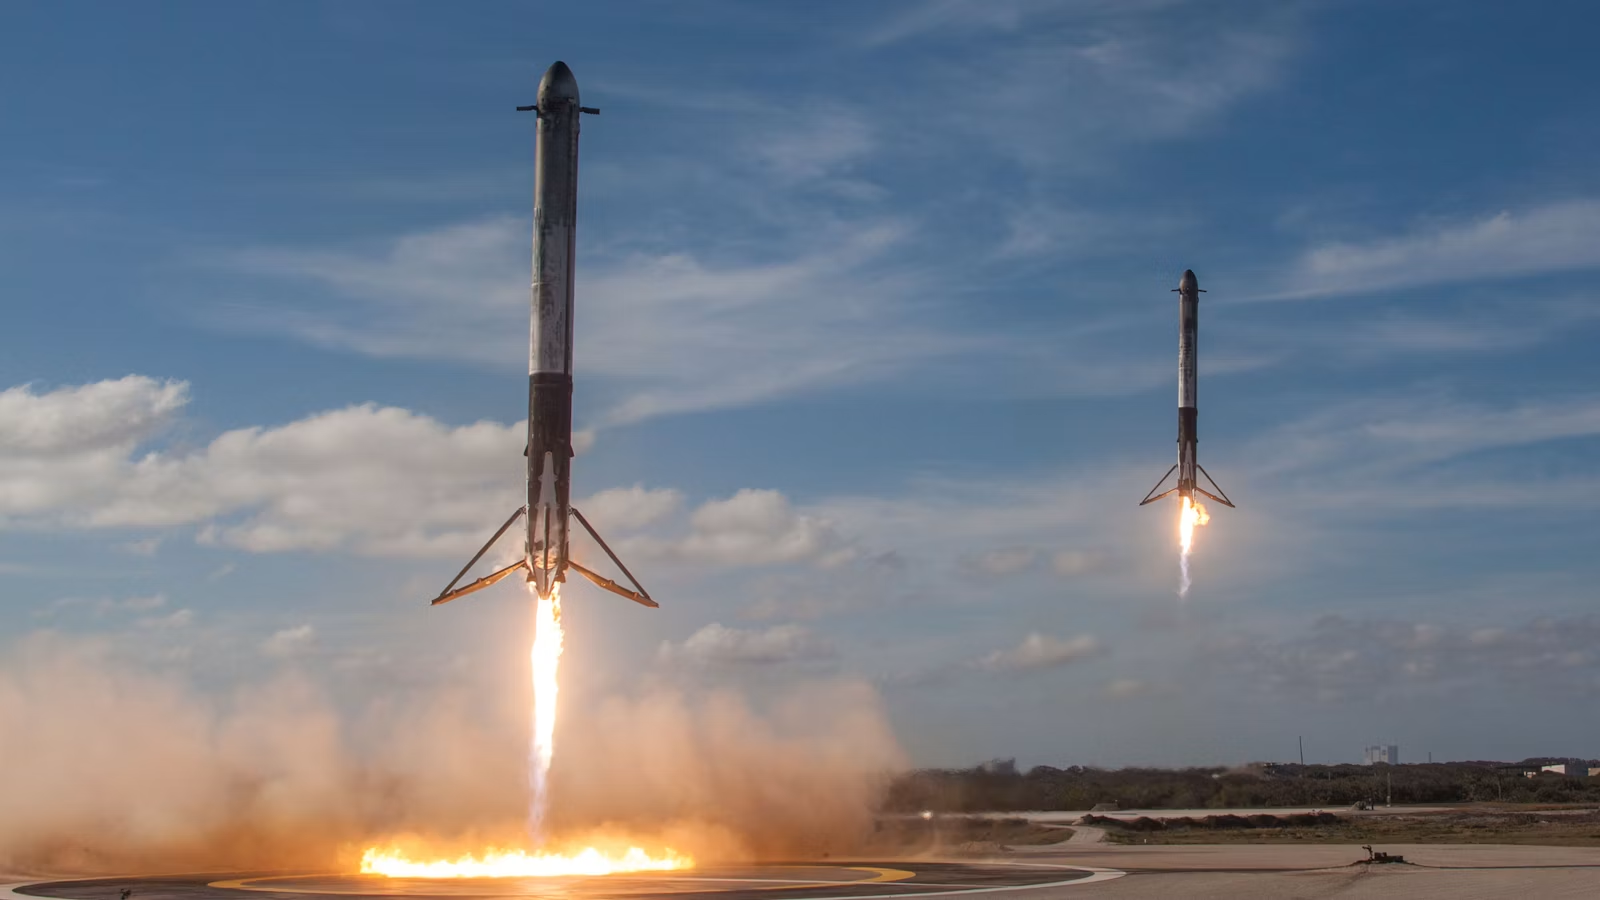
After BlueBird deployment delivers, ASTS stock is no longer simply reflecting whether the technology can work. It is already pricing in more demanding commercial assumptions: whether roughly 45 satellites can provide continuous coverage in key markets, whether partner carriers such as AT&T and Verizon can bring the service to real users, and whether revenue can shift from early-stage projects toward repeatable service revenue. You need to recognize that as ASTS’s stock price and market capitalization rise, the market’s expectations for each launch also change. Early launch success may drive a technology re-rating, while later launch success becomes more of an execution check.
AST SpaceMobile’s goal is to let ordinary, unmodified mobile phones connect directly to low-Earth-orbit satellites. The company describes its network as serving standard, unmodified mobile devices, which makes the ASTS story different from traditional satellite phones and satellite broadband services designed only for fixed terminals. BlueBird deployment first reduces the question of whether large communications arrays can be launched and operated in space, but it does not automatically solve commercial coverage, user experience, carrier billing, or cash flow.
“Deployment delivery” should be divided into at least four layers:
| Stage | What It Means | Impact on Valuation |
|---|---|---|
| Successful launch | Satellite is delivered to low Earth orbit | Reduces launch-event risk |
| In-orbit operation | Satellite completes basic checks | Reduces asset-loss risk |
| Array deployment and testing | Large phased array becomes usable | Reduces technical-execution risk |
| Commercial service launch | Carrier charges users for service | Starts validating long-term valuation |
In June 2026, AST SpaceMobile announced that BlueBird 8, 9, and 10 had successfully completed orbital launch, and stated that those satellites use commercial communications arrays of about 2,400 square feet. The company later announced that BlueBird 11, 12, and 13 were planned for launch in the first half of August, showing that it is trying to turn individual launches into a continuous deployment cadence.
But the market’s real focus is not “how many more satellites were launched.” It is “how far the company is from a chargeable network.” ASTS closed at $57.80 on July 17, and some market-data sources show the company’s market capitalization already in the tens-of-billions-of-dollars range. Market-cap figures may differ depending on ordinary shares, Class A shares, fully diluted share count, and data-provider methodology. For investors, the more important point is that compared with the company’s 2026 revenue guidance, the market has already priced in substantial commercialization expectations.
The assumptions already partly priced into the stock can be grouped as follows:
| Partly Priced-In Expectation | Required Conditions | Still-Unverified Link |
|---|---|---|
| Continuous coverage in key markets | Satellite count, orbital distribution, and gateway systems align | Roughly 45-satellite target still needs execution |
| U.S. commercial service launch | FCC authorization, carrier systems, and user plans | Real paid-user scale still unconfirmed |
| Carrier user conversion | Partners include the service in paid plans | Potential users do not equal paying users |
| High-speed data service | Capacity, concurrency, and coverage duration remain stable | Peak speeds do not equal sustained experience |
| Global market expansion | Spectrum and approvals in each jurisdiction | Regional rollout may vary significantly |
Later launch success may not drive the same level of upside because the market’s attention has moved downstream. Early launches answered the question of technical feasibility and therefore carried higher re-rating potential. Later launches need to answer questions about cost, speed, repeatability, and revenue efficiency, making investors more selective. Especially after the stock has already risen, investors often shift from launch news to financial statements, cash balances, convertible-note terms, and revenue mix.
Summary: BlueBird deployment only reduces part of ASTS’s technical risk. It does not directly prove that the current valuation is justified. ASTS’s future re-rating potential depends on how quickly satellites move from “launched assets” to “operating assets.” If the number of BlueBird satellites keeps increasing but carrier services, user plans, and SpaceMobile service revenue do not appear at the same time, the valuation will remain driven more by expectations than fundamentals. Conversely, if the company can prove quarter by quarter that coverage duration is improving, commercial service is launching, and revenue quality is upgrading, the market may continue to grant a high-growth premium.
Can AST SpaceMobile’s Commercial Revenue Support Its Current Valuation?

At this stage, ASTS’s valuation cannot be directly supported by current revenue. The company generated only $14.7 million in revenue in the first quarter of 2026, while full-year revenue guidance is $150 million to $200 million. Compared with a market capitalization in the tens of billions of dollars, the price-to-sales ratio remains very high. More importantly, not all of that revenue comes from repeatable satellite communications services for ordinary users. It also includes gateway delivery, government projects, and partner-related revenue. Therefore, the core valuation question for ASTS is not whether this year’s revenue is enough, but whether future service revenue can scale quickly.
In its first-quarter 2026 business update, AST SpaceMobile disclosed revenue of $14.7 million and maintained full-year 2026 revenue guidance of $150 million to $200 million. This guidance is important because it shows commercialization has entered the financial statements, but it has not yet reached the mature service-revenue stage.
ASTS’s revenue should be separated into several categories:
| Revenue Type | Current Status | Repeatability | Valuation Significance |
|---|---|---|---|
| Gateway equipment revenue | Already recognized | Depends on delivery schedule | Shows partnership progress, but is not subscription revenue |
| Government project revenue | Already contributing | Depends on contracts and milestones | Provides early validation and cash flow |
| Carrier prepayments | Related to partnership agreements | Depends on contract terms | Reduces some buildout pressure |
| SpaceMobile service revenue | Not yet at scale | Potentially more repeatable | Determines long-term valuation support |
| International joint-venture revenue | Still uncertain | Depends on regional execution | May add long-term optionality |
What can truly support a high valuation is not one-off gateway delivery or a single government milestone, but repeatable network service revenue. Future investors will care more about whether carriers launch formal plans, whether users actually pay, whether AST’s revenue share with carriers is clear, whether service revenue grows quarter by quarter, and whether service margins improve as scale expands.
AST SpaceMobile’s carrier partnerships do provide a large potential channel. The company has disclosed a partner ecosystem of nearly 60 mobile network operators covering more than 3 billion subscribers. In the United States, AT&T’s commercial agreement with AST SpaceMobile and Verizon’s U.S. service partnership with AST SpaceMobile are the two most closely watched anchor relationships. The issue is that potential reach is distribution capacity, not revenue outcome.
The path from partnership to revenue requires at least these steps:
- Obtain satellite, spectrum, and ground-gateway approvals;
- Complete carrier core-network and billing-system integration;
- Define service areas, plan structures, and pricing methods;
- Expand from test users to real paying users;
- Clarify revenue-sharing arrangements between AST and carriers;
- Improve coverage duration, capacity, and concurrency;
- Build sustainable service gross margin and operating cash flow.
The regulatory barrier in the U.S. market has already declined. AST SpaceMobile announced that it had received FCC authorization for commercial SpaceMobile service in the United States, allowing it to provide Supplemental Coverage from Space service through up to 248 low-Earth-orbit satellites. But regulatory authorization is only a market-access condition. It does not confirm user adoption, ARPU, revenue sharing, or profit margins.
To judge whether the current valuation is being supported by fundamentals, focus on these commercial indicators:
- Whether SpaceMobile service revenue begins to scale separately;
- Whether revenue growth becomes less dependent on gateway delivery;
- Whether carriers publish formal plans, prices, and coverage areas;
- Whether contract liabilities and prepayments gradually convert into revenue;
- Whether revenue per satellite and capacity utilization improve;
- Whether service gross margin improves as user scale expands;
- Whether annual revenue growth clearly outpaces share-count expansion.
Summary: ASTS’s current valuation is based on the future scale of commercial service, not on current revenue. The company has revenue guidance and carrier partnerships, but revenue quality still needs to upgrade from gateways, government projects, and prepayments toward repeatable SpaceMobile user services. Only when real paid services begin to scale and revenue growth outpaces cash burn and potential dilution will the high valuation be more firmly supported by fundamentals. Otherwise, ASTS will remain a high-expectation, high-volatility, catalyst-driven trade.
Is AST SpaceMobile’s Cash Burn Under Control?

AST SpaceMobile does not face tight short-term liquidity, but cash burn remains a core valuation constraint. The company had about $3.459 billion in cash, cash equivalents, and restricted cash at the end of March 2026, suggesting sufficient near-term buildout capital. However, first-quarter operating activities used $48.1 million in cash, and investing activities used $379.3 million, including satellite materials, launch prepayments, spectrum-related payments, and capital expenditures. When analyzing ASTS, you should not only look at cash balance. You also need to assess whether cash spent can translate into satellites, coverage, and revenue.
AST SpaceMobile’s first-quarter 2026 report shows that the company held about $3.4589 billion in cash, cash equivalents, and restricted cash as of March 31, including about $429.3 million of restricted cash. The company also stated that existing cash would be sufficient to meet working-capital needs, planned operating expenses, and capital-expenditure requirements for the next 12 months. This means short-term cash shortage is not the main issue. The real issue is capital efficiency.
ASTS’s cash is mainly spent in these areas:
| Cash Use | Main Content | Valuation Impact |
|---|---|---|
| Satellite manufacturing | Materials, phased arrays, assembly, and testing | Determines deployment speed |
| Launch costs | Launch contracts and prepayments | Depends on third-party launch capacity |
| Ground network | Gateways, antennas, carrier integration | Determines whether commercial service can launch |
| Spectrum assets | Ligado and other spectrum-related transactions | Strengthens long-term capability but consumes cash |
| R&D and staff | Chips, software, engineering teams | Supports performance improvement but raises expenses |
| Strategic investment | Launch resources or vertical integration | May reduce long-term dependency but increases near-term spending |
The first-quarter cash-flow statement shows operating cash outflow of $48.1 million, property and equipment purchases of about $261.6 million, an additional $100 million Ligado-related capital prepayment, and $17.66 million of spectrum intangible-asset purchases. Since satellite-constellation buildout is inherently capital-intensive, cash outflow does not equal all current-period loss, but it does affect future financing needs and per-share value.
Cash burn should not be judged simply by “cash balance divided by net loss.” A more reasonable breakdown is:
- Operating cash flow: reflects daily operations, personnel, engineering, and administrative expenses;
- Capital expenditure: creates satellites, ground equipment, and long-term network assets;
- Spectrum payments: may improve long-term network capacity, but consume near-term cash;
- Restricted cash: cannot all be freely used for daily operations;
- Financing inflows: increase cash balance, but may add debt or dilution;
- Revenue collections: determine whether the buildout phase can gradually become self-funding.
Convertible notes are an unavoidable part of ASTS valuation. In July 2026, the company priced $1.0 billion of 1.625% convertible senior notes, due in 2034, with an initial conversion price of about $79.57 and a capped-call structure setting an initial cap price of $149.20. The benefit of this structure is a low coupon and meaningful near-term capital support. The risk is that if the stock rises in the future, conversion may create dilution, while debt still adds complexity to the capital structure.
Different financing methods affect shareholder value differently:
| Financing Method | Advantage | Risk |
|---|---|---|
| Common-stock issuance | No fixed interest or maturity pressure | Immediate dilution to per-share value |
| Convertible notes | Lower coupon and quick cash support | Potential conversion dilution if stock rises |
| Capped call | Reduces dilution within a certain price range | Has a cap and requires upfront cost |
| Carrier prepayments | Tied to commercial partnerships | May include delivery obligations |
| Government or joint-venture funding | Shares capital burden | Depends on approvals and partner execution |
Cash sufficiency does not equal valuation safety. For a company like ASTS, the more cash it has, the more the market asks: can this cash deliver faster launches, lower per-satellite costs, and higher service revenue? If financing only extends the buildout period without producing a commercial revenue inflection point, the stock may still face pressure.
If you are trading around ASTS events, you need to consider real trading costs in addition to price volatility. U.S. stock trading costs usually include more than commissions. They may also include platform fees, external agency fees, trading activity fees, bid-ask spreads, and slippage. Biya charges $0 commission for U.S. stock trading, while platform fees, external agency fees, and other costs are subject to the U.S. stock trading fees and the order page. High-volatility stocks require extra attention to order type and risk tolerance around earnings, launches, and financing announcements.
Summary: AST SpaceMobile’s cash risk is not simply whether it has money in the short term. The real issue is whether the speed of spending can translate into the speed of revenue creation. The company has strong cash reserves, but satellite manufacturing, launches, gateways, spectrum, and strategic investments all require sustained funding. Convertible notes strengthen execution capacity, but they also add long-term dilution risk and capital-structure complexity. When evaluating ASTS, cash balance, operating cash flow, capital expenditure, debt scale, and commercial revenue should be considered together. Valuation upside becomes more credible only when cash burn gradually converts into broader coverage, faster service launches, and stronger revenue.
How Much Valuation Upside Does ASTS Still Have? How to Build Three Scenarios
ASTS’s valuation upside cannot be assessed only with a traditional P/E ratio because the company is still loss-making and building out its network. A more reasonable approach is to first clarify current market capitalization and capital structure, then build scenarios based on future service revenue, gross margin, capital expenditure, and diluted share count. The current valuation already requires future revenue to far exceed 2026 guidance, so further upside depends on commercialization beating expectations. If only satellite count increases while revenue progresses slowly, valuation upside will be constrained by cash burn and financing dilution.
A traditional P/E ratio has limited usefulness for ASTS because the company has not yet generated stable profit. A single-year price-to-sales ratio is also insufficient because 2026 revenue includes gateways, government projects, and partner-related revenue, and does not fully represent mature satellite service revenue. For this type of capital-intensive network company, valuation is closer to a balance between future infrastructure-platform value and current execution risk.
You can use a four-layer valuation framework:
- Current market capitalization, enterprise value, cash, and debt;
- 2026–2028 revenue scale and revenue mix;
- Mature-stage service gross margin and free-cash-flow potential;
- Fully diluted share count from convertible notes, stock-based compensation, and equity issuance.
ASTS’s valuation upside can be divided into three scenarios:
| Scenario | BlueBird Deployment | Commercial Revenue | Cash Burn | Valuation View |
|---|---|---|---|---|
| Bull case | Roughly 45 satellites reached by early 2027, followed by stable launches | Multiple key markets launch quickly, and service revenue grows significantly | Per-satellite cost declines, financing need decreases | High-growth premium can be maintained or expand |
| Base case | Deployment broadly follows the updated timeline | Revenue grows quarter by quarter, but service revenue mix improves slowly | Continued capital investment remains necessary | Stock moves with milestones and financial results |
| Bear case | Launch, manufacturing, or regulatory delays continue | User launch and revenue recognition fall short | Cash burn accelerates and another financing round is needed | Price-to-sales ratio and growth premium compress |
The bull case requires several conditions to happen at the same time: subsequent BlueBird batches launch on schedule, satellites deploy properly and enter service, the United States and key overseas markets roll out service quickly, carriers are willing to include satellite connectivity in paid plans, and user usage is strong enough to support service revenue. Only if these conditions materialize together can ASTS shift from a launch-driven valuation to a revenue-driven valuation.
The base case is more likely to unfold in phases. BlueBird deployment continues, but commercial service first opens gradually in key markets such as the United States, Canada, Japan, Europe, or Saudi Arabia. Revenue begins to grow, but gateways and government projects still account for a meaningful share. Cash burn remains elevated, and the market reassesses valuation each quarter. In this scenario, ASTS may still have upside, but it will remain tied to execution milestones.
The bear case is the valuation-compression path investors need to watch closely: launch windows are repeatedly adjusted, some satellites experience in-orbit issues, continuous coverage is delayed, carrier plans are not released, service revenue falls below market expectations, and the company continues to raise capital through convertible notes or equity financing. In that case, the market may no longer be willing to assign ASTS a very high future-revenue multiple.
Key variables affecting fair valuation include:
- Timing of the first scaled commercial service launch;
- Number of operational satellites by the end of 2027;
- Capacity and revenue each satellite can support;
- Carrier revenue-share ratio;
- SpaceMobile service gross margin;
- Annual capital expenditure and launch costs;
- New debt and fully diluted share count;
- Market valuation multiple for high-growth satellite communications companies.
A simplified sensitivity table can help:
| Valuation Variable | Lower Assumption | Base Assumption | Higher Assumption |
|---|---|---|---|
| Commercial service launch speed | Delayed | Phased launch | Rapid expansion |
| Medium-term revenue growth | Slower | Steady improvement | Meaningful upside surprise |
| Service gross margin | Pressured by depreciation and costs | Improves with scale | Driven higher by capacity utilization |
| Fully diluted share count | Higher | Moderate | Dilution controlled |
| Applicable valuation multiple | Compresses | Holds | Expands |
Competition will also affect valuation multiples. Direct-to-Device and 3GPP NTN are both advancing satellite-terrestrial network convergence. Related research notes that D2C and 3GPP NTN represent different technology paths: the former emphasizes rapid coverage using existing phones and carrier spectrum, while the latter focuses more on long-term standardization and deeper network integration. AST SpaceMobile’s advantages are large arrays, higher speed targets, and carrier partnerships. Competitors may have advantages in launch resources, existing constellation scale, capital strength, and device ecosystems.
Summary: Whether ASTS still has valuation upside depends on whether future commercial revenue can grow enough to dilute its current high price-to-sales ratio. The bull case requires satellite deployment, carrier rollout, user usage, and cost reduction to materialize together. In the base case, the stock will continue to fluctuate around launches, earnings, and financing events. In the bear case, even if the number of BlueBird satellites increases, slow revenue progress, high cash burn, and convertible-note dilution pressure may compress valuation multiples. ASTS’s upside is not determined by successful satellite launches alone; it is jointly determined by commercialization speed and capital efficiency.
What Catalysts and Downside Risks Should Investors Track?
To judge ASTS’s future stock performance, you should not focus only on launch dates. You need a monitoring framework covering satellite operations, commercial revenue, cash burn, and capital structure. The most important positive catalysts are satellites entering service on schedule, carriers officially launching service, and SpaceMobile service revenue beating expectations. The main downside risks are another deployment delay, no improvement in revenue mix, higher-than-expected cash burn, and continued financing under heavy capital-expenditure pressure.
Over the next 12 months, ASTS’s key catalysts include:
- Whether BlueBird 11–13 and later batches launch as planned;
- Whether launched satellites deploy successfully and enter the network;
- Whether the roughly 45-satellite target can be reached around early 2027;
- Whether AT&T, Verizon, and overseas carriers launch formal service;
- Whether SpaceMobile service revenue begins to form a separate scale;
- Whether Japan-related projects or government funding materialize;
- Whether per-satellite manufacturing and launch costs decline;
- Whether new financing secures more reliable launch resources.
Japan is also worth watching. Reuters reported that a Rakuten-related satellite project may receive up to 148 billion yen in Japanese government subsidies. If AST SpaceMobile can enter more government-supported low-Earth-orbit communications projects through partners, its commercialization path may become broader. But subsidies, joint ventures, and revenue sharing still need to be implemented and should not be treated as confirmed revenue in advance.
Downside risks can be monitored as follows:
| Risk | Warning Signal | Impact on Valuation |
|---|---|---|
| Launch delay | Target dates are repeatedly adjusted | Revenue and cash-flow timelines move back |
| In-orbit loss | Orbital anomaly or array deployment failure | Asset impairment and replacement costs rise |
| Weak commercial conversion | Carriers delay paid-service launch | High price-to-sales ratio lacks support |
| Capex overrun | Per-satellite cost does not decline | Cash runway shortens |
| Convertible-note dilution | Stock approaches conversion range | Fully diluted share count increases |
| Stronger competition | Competitors build coverage faster | Pricing and market-share pressure rises |
| Overextended valuation | Stock rises faster than revenue | Any delay becomes more damaging |
You can update five indicator groups each quarter:
| Indicator Group | What to Track | Why It Matters |
|---|---|---|
| Satellites | Launches, deployments, and in-orbit operating count | Measures network buildout speed |
| Commercial | Countries launched, carrier plans, real users | Measures revenue sustainability |
| Financials | Revenue mix, operating cash flow, capital expenditure | Measures fundamental improvement |
| Funding | Cash, restricted cash, debt, diluted share count | Measures financing pressure |
| Valuation | Market cap, enterprise value, revenue multiples | Measures whether expectations are too high |
ASTS’s risks are not only internal. External launch availability, regulatory approvals, spectrum coordination, competitor progress, and capital-market conditions can all affect valuation. MarketWatch’s discussion of AST SpaceMobile’s convertible notes and deployment-target changes also shows that investors often reprice financing pressure and launch timelines together.
Summary: ASTS could still earn a higher valuation if commercial service delivers, but the current price already requires the company to transform from a technology-validation company into a satellite communications network platform. You need to validate three dimensions at the same time: satellites, revenue, and cash flow. Satellite count determines the coverage foundation, commercial service determines revenue quality, and cash burn determines capital efficiency. If any one of these links falls clearly behind, valuation may shift from growth premium to execution discount. For a high-volatility growth stock, the biggest danger is not one isolated negative event, but multiple execution milestones falling short of market expectations at the same time.
If you follow high-volatility U.S. stocks such as ASTS, you should not only track BlueBird launches, FCC authorization, carrier announcements, and quarterly earnings. You also need to clarify your own capital allocation and order costs. When using Biya to monitor U.S. stocks, Hong Kong stocks, crypto, and other multi-asset markets, you can evaluate ASTS by combining price action, company information, related news, and trading fees in one framework. If you need to screen other U.S. stocks, you can also use U.S. stock search to compare company information. Service availability depends on the user’s location, identity-verification result, platform rules, and applicable laws and regulations; before trading, you should fully understand fee structure, order types, and price-volatility risk. For mobile tracking of quotes and order information, you can use Download App. The information above only discusses publicly available market information, trading rules, and fee structures, and does not constitute investment advice.
FAQ
How Would a BlueBird Deployment Delay to Early 2027 Affect ASTS Valuation?
A BlueBird deployment delay to early 2027 could postpone continuous coverage and commercial revenue recognition. The actual impact depends on the length of the delay, the density of later launches, whether satellites enter operation smoothly, and whether carrier services move forward at the same time. If revenue is delayed while cash burn remains high, valuation pressure may increase.
Can ASTS’s 2026 Revenue Guidance Support Its Current Market Value?
ASTS’s 2026 revenue guidance is difficult to use as standalone support for the current market value. The $150 million to $200 million revenue guidance remains early-stage, and not all revenue comes from repeatable user services. The current valuation relies more on rapid SpaceMobile service revenue growth after 2027.
How Should Investors Assess AST SpaceMobile’s Cash Runway From Its Financial Reports?
AST SpaceMobile’s cash runway should not be assessed only by dividing cash balance by net loss. You also need to review operating cash flow, satellite capital expenditure, launch prepayments, restricted cash, spectrum spending, new financing, debt maturities, and future revenue collections.
Will ASTS Convertible Notes Definitely Dilute Common Shareholders?
ASTS convertible notes do not necessarily dilute common shareholders immediately, but if the stock reaches conversion conditions, the number of common shares may increase. Capped calls can reduce dilution within a certain price range, but they cannot fully eliminate debt, interest, or long-term conversion risk.
What Data Would Prove AST SpaceMobile Has Entered Scaled Commercialization?
Scaled commercialization for AST SpaceMobile would require formal paid plans, continuous coverage areas, real user growth, separately expanding SpaceMobile service revenue, improving service gross margin, and operating cash flow gradually moving closer to breakeven.
Can Retail Investors Use Price-to-Sales Ratio to Value ASTS Stock?
Retail investors can use price-to-sales ratio as one reference point, but not as the only valuation tool. ASTS’s revenue mix is still changing, so commercial service revenue, capital expenditure, cash balance, debt, diluted share count, and BlueBird deployment progress should all be evaluated together.
*This article is provided for general information purposes and does not constitute legal, tax or other professional advice from BiyaPay or its subsidiaries and its affiliates, and it is not intended as a substitute for obtaining advice from a financial advisor or any other professional.
We make no representations, warranties or warranties, express or implied, as to the accuracy, completeness or timeliness of the contents of this publication.
Related Blogs of

DCA vs. Grid Trading in Crypto: Key Differences, Costs, and Risks


International Money Transfer Limits: Per-Transfer, Daily, and Monthly Caps Explained


Crypto Off-Ramp Services vs. Exchanges: Fees, Payouts, and Trade-Offs


Choose Country or Region to Read Local Blog
 Australia
 Austria
 Belgium
 Canada
 Cyprus
 Czech Republic
 Denmark
 Estonia
 Finland
 France
 Germany
 Greece
 Hong Kong
 India
 Indonesia
 Ireland
 Italy
 Japan
 Latvia
 Lithuania
 Luxembourg
 Malaysia
 Malta
 Morocco
 Nepal
 Netherlands
 New Zealand
 Norway
 Pakistan
 Philippines
 Poland
 Portugal
 Romania
 Singapore
 Slovakia
 Slovenia
 South Africa
 South Korea
 Spain
 Sweden
 Thailand
 United States
 Turkey
 United Arab Emirates
 United Kingdom
 Vietnam