A Guide to Analyzing Stock Futures Data in 2026


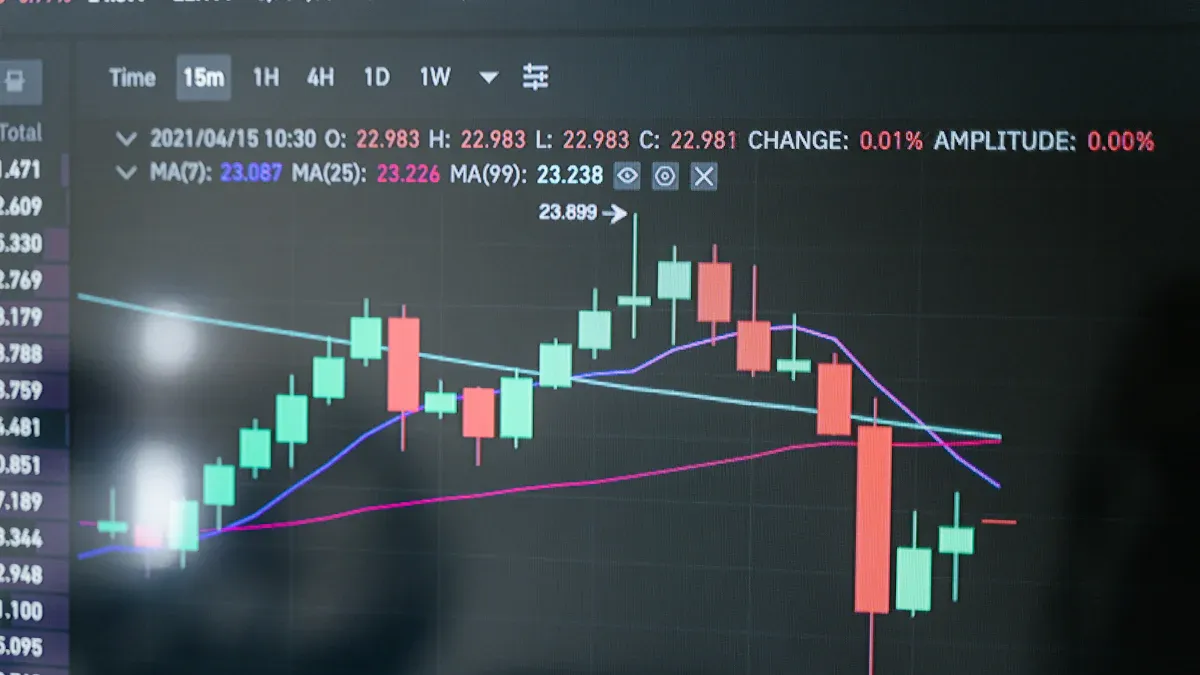
Image Source: pexels
Analyzing futures data offers a predictive edge to understand the market. You can predict market trends more effectively. This guide builds your analysis framework for trading in 2026.
Note: Your trading strategy will improve by mastering three core analysis methods:
- Foundational data analysis
- In-depth technical analysis
- Market sentiment analysis
This approach to technical analysis helps you interpret trends in futures. A strong analysis of stock futures today real time data and other futures will help you navigate the market with greater confidence.
Key Takeaways
- Combine foundational, technical, and sentiment analysis for better market predictions. This approach helps you understand why prices move.
- Use volume and open interest to confirm trends and spot reversals. These tools show the strength of market moves.
- Apply technical tools like moving averages and RSI to see trends and momentum. They help you visualize market conviction.
- Read the Commitment of Traders (COT) report to understand what big traders are doing. This shows you market sentiment.
- Use AI to analyze real-time data and find complex patterns. AI helps you make faster and more accurate trading decisions.
Foundational Futures Data Analysis
Price movements tell you what is happening in the market. Volume and open interest tell you why. You should consider these two metrics the bedrock of your futures analysis. They provide deep insights into market conviction. A proper analysis of this data helps you validate trends or spot potential reversals before they happen. This foundational analysis is crucial for successful trading.
Confirming Trends with Volume Analysis
Volume represents the total number of futures contracts traded during a specific period. It measures the intensity and urgency behind price moves. A high-volume move shows strong participation and conviction. Your analysis should always pair price action with volume. This simple analysis confirms the strength of market trends. For example, a price rally on high volume suggests strong buying interest. This analysis strengthens your confidence in the ongoing trend.
Gauging Conviction with Open Interest
Open interest is the total number of outstanding futures contracts that have not been settled. It represents the total capital committed to the market. Your analysis of open interest reveals the flow of money into or out of futures. This gives you a clear picture of market conviction.
You can combine price, volume, and open interest for a powerful analysis. This approach helps you interpret market trends with greater accuracy.
| Price Trend | Volume | Open Interest | Market Interpretation |
|---|---|---|---|
| Rising | Rising | Rising | Strong Uptrend: New money supports the trend. |
| Rising | Falling | Falling | Weakening Uptrend: Participants are closing positions. |
| Falling | Rising | Rising | Strong Downtrend: New money is driving prices lower. |
| Falling | Falling | Falling | Weakening Downtrend: Participants are covering shorts. |
Watch for Divergence! A divergence occurs when price moves in one direction while an indicator like volume or open interest moves in the opposite direction. For example, if the market makes a new high but on falling volume, it signals weakening conviction. This divergence is a powerful warning for your trading. It often precedes a reversal in trends, making it a key signal in your analysis of futures.
Applying Technical Analysis to Futures Charts

Image Source: pexels
While foundational data tells you about market conviction, technical analysis helps you visualize that conviction on a price chart. Your technical analysis of futures charts uses historical price and volume data to forecast future movements. This discipline is built on a core set of technical indicators. Mastering these tools allows you to define trends, measure momentum, and gauge volatility. A robust technical analysis framework is essential for making informed trading decisions.
Defining Trend Direction with Moving Averages
Moving averages are one of the most fundamental technical indicators. They smooth out price data to create a single flowing line, making it easier to identify the dominant trend direction. Your technical analysis should use them to filter out short-term market noise.
There are two common types:
- Simple Moving Average (SMA): This is the simple average of a security’s price over a specific number of periods.
- Exponential Moving Average (EMA): This gives more weight to recent prices, making it more responsive to new information.
You can use moving averages to generate clear signals. When the price is above a key moving average (like the 50-day or 200-day), your analysis can confirm an uptrend. When the price is below it, the analysis points to a downtrend. Crossovers, where a shorter-term average crosses above or below a longer-term average, can also signal a potential shift in trends.
Identifying Trends with Trendline Analysis
Trendlines are a simple yet powerful tool in your technical analysis toolkit. You draw them on a chart to connect key price points, helping you visualize support and resistance levels. A proper analysis of trendlines can define a trading channel and signal potential breakouts or breakdowns.
To draw accurate trendlines for your technical analysis, you should follow a few best practices:
- For uptrends: You connect a series of higher lows.
- For downtrends: You connect a series of lower highs.
- Use the "Three Touch Rule": A trendline gains significant validity after the price has tested it three times. This confirms that the broader market recognizes the level.
- Assess the slope: A moderate slope (30-45 degrees) suggests a healthy, sustainable trend. A very steep slope indicates a parabolic move that is at high risk of a sharp reversal.
Your goal is to let the pattern form naturally. Avoid forcing a line to fit your expectations. A well-drawn trendline is a critical component of your technical analysis, offering clear visual cues about the market’s direction and strength.
Measuring Momentum with the RSI
The Relative Strength Index (RSI) is a momentum oscillator. It measures the speed and change of price movements. Your technical analysis uses the RSI to identify overbought or oversold conditions in the market. The RSI oscillates between 0 and 100.
Standard settings for this technical indicator are:
- RSI Period: 14
- Overbought Level: > 70
- Oversold Level: < 30
When the RSI moves above 70, it suggests the market is overbought and may be due for a price correction. When the RSI falls below 30, it suggests the market is oversold and may be due for a bounce. This analysis helps you time entries and exits by gauging when a trend might be losing momentum. Combining RSI signals with price action provides a more complete picture for your technical analysis.
Gauging Volatility with Bollinger Bands
Bollinger Bands are technical indicators that measure market volatility. They consist of three lines: a middle band (typically a 20-period SMA) and upper and lower bands that are set two standard deviations away from the middle band. When volatility is high, the bands widen. When volatility is low, the bands contract.
The Bollinger Band Squeeze A “squeeze” is one of the most powerful patterns you can identify with these technical indicators. It occurs when the bands tighten significantly, signaling a period of low volatility. This consolidation often precedes a large price move. Your analysis should watch for a price breakout above the upper band (a buy signal) or below the lower band (a sell signal) to capitalize on the subsequent expansion in volatility.
You can combine Bollinger Bands with the RSI for a powerful reversal strategy. This technical analysis approach generates signals at potential market turning points.
// A quantified example of a BB-RSI strategy
// Buy Signal: Price crosses above the lower band AND RSI is below 30.
// Sell Signal: Price crosses below the upper band AND RSI is above 70.
This combined analysis helps you confirm signals from one technical indicator with another. For example, if the price of futures touches the lower Bollinger Band while the RSI is in oversold territory, it creates a high-probability buy signal. This multi-indicator approach strengthens your technical analysis and helps you filter out false signals, improving the reliability of your trading decisions for futures and other assets. These technical indicators are crucial for navigating different market trends.
Leveraging Futures Sentiment and Positioning Data
Technical charts show you price action, but sentiment data reveals the beliefs of the players behind the moves. Your analysis is incomplete without understanding who is buying and who is selling. This layer of analysis helps you gauge whether the “smart money” agrees with the current market trend. By examining positioning data, you can add a powerful predictive element to your trading decisions.
Reading the Commitment of Traders (COT) Report
The Commitment of Traders (COT) report gives you a weekly snapshot of positions in the futures markets. The U.S. Commodity Futures Trading Commission (CFTC) publishes this data, breaking down open interest by trader type. Your analysis of this report helps you see what the largest market participants are doing.
You should focus your analysis on three key groups:
- Commercials: These are businesses hedging their risk. They often take positions against the prevailing trend.
- Large Speculators: These are large funds and institutions trading to profit. They are often called the “smart money” and tend to follow trends.
- Small Speculators: This group includes individual retail traders.
A powerful trading signal emerges when Large Speculators build an extreme net-long or net-short position. Historically, such extremes often precede major market turning points. Your analysis should watch for these moments, as they can signal a potential top or bottom in the market for futures.
Note on Timing The COT report has a time lag. It is released on a Friday but reflects positions held on the previous Tuesday. This delay means it is not a short-term timing tool, but rather a guide for understanding the broader market sentiment for futures.
Interpreting the Futures Basis
The futures basis offers a real-time sentiment reading. The basis is simply the difference between the futures price and the underlying asset’s spot (cash) price. A proper analysis of the basis tells you if the market expects prices to rise or fall.
You can interpret the basis using two key terms:
| Term | Formula | Market Sentiment |
|---|---|---|
| Contango | Futures Price > Spot Price | Bullish |
| Backwardation | Futures Price < Spot Price | Bearish |
When futures are in contango, it shows that traders are willing to pay a premium for future delivery, signaling bullish expectations. Conversely, backwardation suggests immediate demand is high or that the market anticipates falling prices. This simple analysis provides an excellent barometer of current sentiment, complementing your other trading tools for navigating the futures market.
How to Predict Market Trends with Advanced Tools

Image Source: pexels
You have learned the individual components of analysis. Now you can combine them into powerful, forward-looking strategies. Advanced tools help you synthesize data and execute your trading strategy with greater precision. These methods move you from simply reacting to the market to anticipating its next move.
Building a Multi-Factor Confirmation Checklist
A confirmation checklist is your most important tool for disciplined trading. This simple strategy forces you to verify a trade idea across multiple analytical pillars before risking capital. Your checklist ensures every trade aligns with your overall market view. This process helps you avoid emotional decisions and stick to proven strategies. You can build a checklist to confirm bullish or bearish trends.
Example Bullish Checklist Before entering a long trade, you should confirm that most of these conditions are met.
| Category | Confirmation Signal | Your Check |
|---|---|---|
| Foundational | Price, Volume, and Open Interest are all rising. | ☐ |
| Technical | Price is above the 50-day moving average. | ☐ |
| Momentum | RSI is above 50 but not yet overbought (>70). | ☐ |
| Sentiment | Large Speculators (COT) are net-long. | ☐ |
| Basis | The market is in Contango (Futures > Spot). | ☐ |
Using AI for Stock Futures Today Real Time Data
Artificial intelligence (AI) is transforming how traders predict market trends. AI models analyze vast amounts of stock futures today real time data, identifying complex patterns invisible to the human eye. These systems go beyond simple indicators to build adaptive strategies that evolve with the market. For example, Random Forest models have achieved directional accuracy rates as high as 91.27% on 15-minute stock futures today real time data.
Modern platforms like Biyapay provide the high-speed stock futures today real time data feeds necessary for these advanced AI applications. AI-driven hedge funds have already demonstrated their edge, outperforming traditional funds by 3-7% annually during volatile periods. This is because AI can process stock futures today real time information and react in seconds, capturing opportunities that human traders miss. By leveraging AI, you can enhance your analysis of futures and gain a significant competitive advantage in identifying emerging trends. Your ability to interpret these AI-driven insights will define your success with futures and other assets, especially when analyzing fast-moving trends.
One practical caveat: AI is only as useful as the data quality and the “execution reality” behind it. If your feed is delayed, inconsistent, or hard to validate across venues, the model’s output becomes more of a post-mortem tool than a trading aid. A simple workflow is to keep your usual quote source for signal discovery, then use a second surface for fast cross-checking—e.g., open the same ticker on the BiyaPay markets page to verify display conventions, session timing, and navigation flow before you treat the move as actionable.
Also, many strategies look great in backtests but feel off in live trading because the real P&L is driven by “hidden” costs—FX impact, fees, and capital usage—especially when you’re comparing opportunities across USD/EUR and your home currency. Before committing to a trade, a quick sanity check with the BiyaPay currency converter helps you anchor the move in true, comparable terms. If you want to connect “watch → cost-check → act” in fewer steps, the BiyaPay official site is a useful reference for cross-market coverage and entry points (including USDT-based access to U.S. stocks, Hong Kong stocks, and futures, plus zero-fee Maker trading for digital-asset spot and contracts). This way, AI can help you spot emerging trends—while your workflow stays grounded in execution-ready reality.
Your success in analyzing futures hinges on integrating three core pillars: foundational data analysis, comprehensive technical analysis, and insightful sentiment analysis. Legendary traders like Paul Tudor Jones built careers on such a multi-faceted analysis, proving a consistent framework is your best tool for predicting market trends. Mastering this combined technical analysis is essential.
It provides the foundational logic you need to leverage the AI-native data analysis tools that will define trading beyond 2026, ensuring your technical analysis remains relevant in an evolving landscape.
FAQ
What are the most important metrics for foundational analysis?
You should focus on volume and open interest. These metrics show the conviction behind price moves. They help you confirm trend strength or spot potential reversals. This analysis provides deeper market insight than price alone.
Why should you combine technical and sentiment analysis?
You gain a more complete market view. Technical analysis shows you price patterns. Sentiment data, like the COT report, reveals what large traders believe. This combination helps you confirm trends and trade with greater confidence.
Pro Tip: A multi-factor approach reduces false signals. It forces you to verify a trade idea across different analytical pillars, leading to more disciplined and reliable trading decisions.
How does AI help in analyzing futures data?
AI models process vast amounts of real-time data very quickly. They identify complex patterns that humans might miss. This gives you a significant analytical edge for predicting market trends and reacting to new information instantly.
*This article is provided for general information purposes and does not constitute legal, tax or other professional advice from BiyaPay or its subsidiaries and its affiliates, and it is not intended as a substitute for obtaining advice from a financial advisor or any other professional.
We make no representations, warranties or warranties, express or implied, as to the accuracy, completeness or timeliness of the contents of this publication.
Related Blogs of

The Easiest Way to Find the Code for Calling France


What Are the Daily Limits for Chase Accounts?


How to Fill Out a CVS Money Order A 2026 Guide


Why Is Canada's Country Code 1

Choose Country or Region to Read Local Blog

Contact Us


BIYA GLOBAL LLC is a licensed entity registered with the U.S. Securities and Exchange Commission (SEC No.: 802-127417); a certified member of the Financial Industry Regulatory Authority (FINRA) (Central Registration Depository CRD No.: 325027); regulated by the Financial Industry Regulatory Authority (FINRA) and the U.S. Securities and Exchange Commission (SEC).
BIYA GLOBAL LLC is registered with the Financial Crimes Enforcement Network (FinCEN), an agency under the U.S. Department of the Treasury, as a Money Services Business (MSB), with registration number 31000218637349, and regulated by the Financial Crimes Enforcement Network (FinCEN).
BIYA GLOBAL LIMITED is a registered Financial Service Provider (FSP) in New Zealand, with registration number FSP1007221, and is also a registered member of the Financial Services Complaints Limited (FSCL), an independent dispute resolution scheme in New Zealand.