What Are Real-Time Stock Indexes Explained


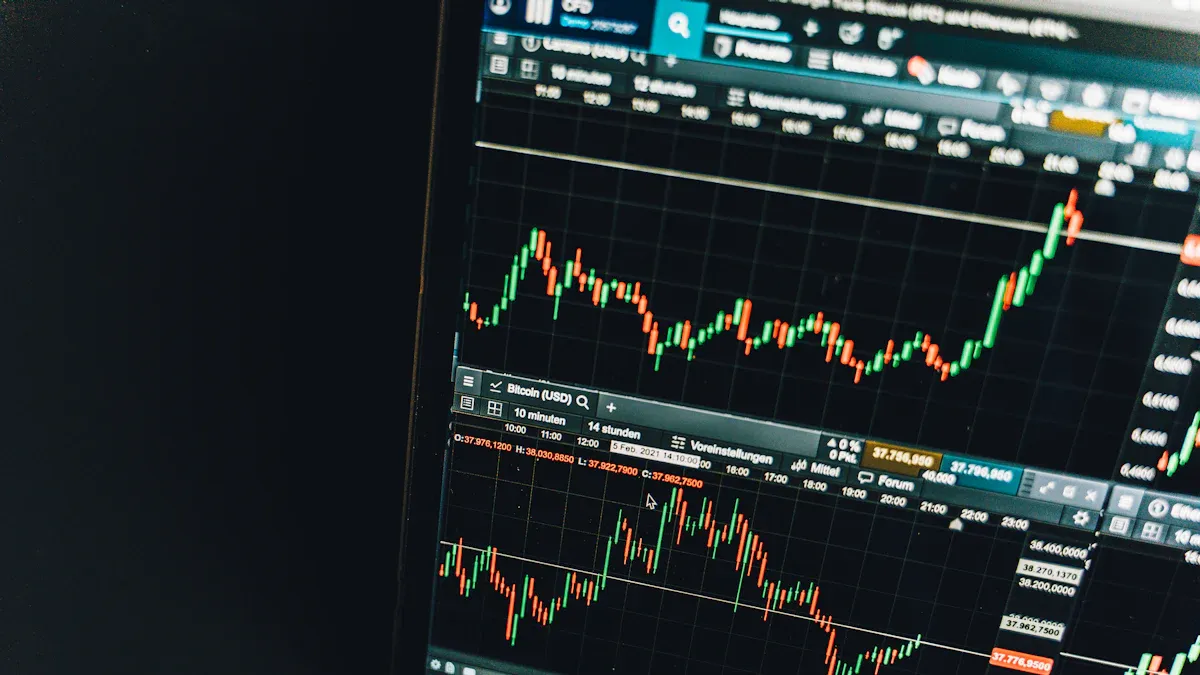
Image Source: pexels
A real time stock index is a live “report card” for a specific segment of the stock market. Think of a stock index like a car’s speedometer; it gives an instant reading of the market’s speed and direction. Its purpose is to provide investors, economists, and the public with an immediate snapshot of market health. This single number, derived from the prices of multiple stocks, reflects overall investor confidence and is a vital tool for any investment strategy. A stock market index helps everyone understand market movements at a glance.
If you use an index as a “market thermometer,” two practical questions usually follow: which stocks are actually driving the move, and whether FX fluctuations might change your effective cost when planning funds across currencies. In that case, it helps to observe the chain of “index → constituents → exchange-rate impact,” instead of staring at a single index print in isolation.
For this kind of linked tracking, a multi-asset wallet like BiyaPay can be useful as an auxiliary tool. You can use its stock information lookup to quickly review prices and key data for index-related names, and its official FX converter and comparison tool to check live currency conversion rates and estimate potential conversion costs. If you want to connect observation with execution, you can also access the unified trading interface via the trading entry, or reference its international remittance service when cross-border fund transfers are part of your workflow. The goal here is simply to keep information and actions within one path, so you can use index moves as a clearer decision input—not as a substitute for judgment.
Key Takeaways
- A real-time stock index shows the market’s health. It is like a report card for a part of the stock market.
- Indexes are calculated in different ways. Some indexes give more weight to higher-priced stocks, while others give more weight to larger companies.
- Stock indexes help you check how well your investments are doing. They also show how the economy is performing.
- You cannot buy an index directly. You can invest in funds that track an index, like ETFs or index funds.
- The S&P 500, Dow Jones, and NASDAQ Composite are major US indexes. Each one tracks a different part of the market.
How a Real Time Stock Index Works

Image Source: unsplash
A real time stock index appears as a single, constantly changing number. This number is the result of a complex, high-speed process. It involves specific mathematical formulas and a vast technological infrastructure. Understanding this process reveals how a simple number can accurately reflect the pulse of the market.
How Stock Market Indexes Are Calculated
Not all stock market indexes are created equal. The final index value depends heavily on its calculation method. These methods determine how much influence each individual stock has on the total. The two most common methods are price-weighting and market-capitalization-weighting.
A price-weighted index gives more importance to stocks with higher share prices. The Dow Jones Industrial Average is a famous example of this method. The calculation simply adds the prices of all component stocks and divides that sum by a special number called a divisor.
Price weighted average = (Sum of prices) / (Number of stocks)
In this model, a stock trading at $500 has a greater impact on the index’s movement than a stock trading at $50.
A market-capitalization-weighted index, on the other hand, gives more influence to larger companies. The S&P 500 uses this method. Market capitalization is the total market value of a company’s outstanding shares.
Market Capitalization = Stock Price x No. of Shares Outstanding
To calculate these indices, data providers follow a clear process:
- First, they determine each company’s market capitalization.
- Next, they sum the market caps of all companies in the index.
- Finally, they divide each company’s market cap by the total to find its weight.
This means a company worth $2 trillion will influence the S&P 500 far more than a company worth $50 billion. The table below compares these methods with a third type, the equal-weighted index.
| Index Type | Weighting Basis | Impact of Company Size/Price | Rebalancing Needs |
|---|---|---|---|
| Price-Weighted | Highest share price carries most weight | Higher-priced stocks have greater influence | Divisor adjustments for corporate actions |
| Market-Cap-Weighted | Highest market capitalization carries most weight | Larger companies have greater influence | Base value adjustments for continuity |
| Equal-Weighted | Each component has the same weight | Equal impact regardless of market cap or price | Frequent rebalancing to maintain weights |
The Role of the Index Divisor
The index divisor is a crucial component, especially for price-weighted stock market indices like the Dow Jones Industrial Average. Its main purpose is to maintain the historical continuity of the index value. The divisor prevents corporate actions, such as stock splits or component changes, from artificially distorting the index’s level.
For example, Apple Inc. executed a 4-for-1 stock split in August 2020. This action quartered the price of its stock. Without an adjustment, this price drop would have caused the entire index to fall dramatically, incorrectly signaling a market downturn. To prevent this, the index managers lowered the Dow divisor. This adjustment ensured the index value remained consistent before and after the split, reflecting only genuine market movement.
The divisor changes for several reasons beyond stock splits. These events can include:
- Company mergers or acquisitions where a component stock ceases to exist.
- The delisting of a company from an exchange.
- Special one-time dividend payments.
- Spin-offs, where a company creates a new independent entity.
- Changes in the companies that make up the index.
Each adjustment ensures the stock market index remains a reliable and comparable benchmark over time.
The Real-Time Data Feed
The “real-time” aspect of a real time stock index depends on a constant stream of information. Stock exchanges use a sophisticated technology infrastructure to broadcast trade data instantly. Every time a stock is bought or sold, information about the trade—including its price and volume—is sent out.
Financial data providers are the engines that power this process. Companies like Refinitiv, FactSet, and Polygon subscribe to these data feeds from exchanges worldwide. Their systems use powerful APIs (Application Programming Interfaces) and message brokers to ingest and process millions of data points per second.
This infrastructure is built for speed and reliability. It uses low-latency technology to minimize delays. As soon as new trade data arrives, these providers instantly recalculate the value of the stock market indexes they track. The updated value is then distributed to news outlets, trading platforms, and investors globally. This entire cycle—from a trade occurring on an exchange to an updated index value appearing on a screen—happens in a matter of seconds, giving everyone a live view of market performance.
Why a Stock Market Index is Important
A stock market index is more than just a number on a screen; it is a vital tool for investors, economists, and financial institutions. These indices provide a clear, concise summary of market performance, offering critical insights that inform investment decisions and economic analysis. Their importance stems from three primary functions: serving as a benchmark for performance, acting as an indicator of economic health, and providing the foundation for a wide range of financial products.
Benchmarking Portfolio Performance
One of the most critical functions of a stock market index is to serve as a benchmark for evaluating investment performance. The Government Finance Officers Association (GFOA) recommends that investors compare their portfolio’s total return against carefully selected benchmarks to get a clear picture of how their investments are truly performing. This comparison helps determine whether an investment strategy is delivering value beyond what could be achieved by simply tracking the market.
For an investor, a benchmark acts as a yardstick. If your portfolio of U.S. large-cap stocks returned 8% in a year when the S&P 500 returned 12%, your investments underperformed the market. This is a crucial reality check, as historical data shows that a significant majority of actively managed funds fail to outperform their benchmarks over the long term. For instance, over a 10-year period, approximately 85% of actively managed large-cap funds underperformed the S&P 500 Index.
Financial advisors create a “policy portfolio” by blending different indices to match a client’s specific asset allocation. This customized benchmark reflects the client’s risk tolerance and long-term goals. To be effective, a benchmark must be:
- Unambiguous and transparent: Its components and weights are clearly defined.
- Investable: It is possible to replicate the benchmark’s holdings.
- Measured regularly: Its performance is calculated consistently.
- Supported by historical data: Past returns are available for comparison.
By using these benchmarks, investors can objectively assess the performance of their investment portfolios and make informed adjustments.
Gauging Economic Health
Stock market indices are widely regarded as barometers of economic health. Because stock prices reflect investor expectations about future corporate earnings and economic growth, a rising index often signals optimism, while a declining one suggests a potential downturn. Central banks, including the Federal Reserve, use stock market data as a key input for their economic forecasts. A 10% decline in the stock market, for example, is associated with a roughly 1 percentage point downgrade in growth expectations for the following year.
The relationship between a stock market index and the broader economy, such as the Gross Domestic Product (GDP), is complex but often correlated. Historically, periods of strong GDP growth have frequently coincided with rising stock markets. A study analyzing data from 1990 to 2019 found a significant positive relationship between GDP growth and S&P 500 performance. Major economic events are often preceded or accompanied by significant market movements.
- The Great Depression was famously triggered by the stock market crash of 1929.
- The recession in the early 2000s followed the collapse of the dot-com bubble, which saw the market fall sharply.
While not a perfect predictor, the stock market remains a powerful leading indicator of economic trends, influencing both consumer confidence and business investment decisions.
The Basis for Indices Trading
The rise of stock index investing has transformed modern finance, making it easier and more cost-effective for individuals to participate in the market. Instead of buying individual stocks, investors can purchase a single financial product that tracks the performance of an entire index. This strategy provides instant diversification, spreading risk across hundreds or even thousands of companies.
The most popular vehicles for this are Exchange-Traded Funds (ETFs) and index funds. The global ETF market has exploded in popularity, growing to over $13 trillion in assets under management as of May 2024.
For more sophisticated investors, index futures and options offer tools for hedging and speculation. These derivatives allow traders to bet on the future direction of an entire market or protect their existing investment portfolios from a potential decline. Unlike owning a stock, trading futures involves high leverage and requires less initial capital, but it also comes with greater risk and complexity. These products provide essential liquidity and risk management tools, making indices a cornerstone of the global financial system.
Major US Stock Market Indices

Image Source: unsplash
The United States is home to several major stock market indices that serve as critical benchmarks for the economy. Each index tracks a different segment of the market, offering unique insights into market performance. Understanding the differences between these key stock market indexes is essential for any investor. The three most widely followed indices are the S&P 500, the Dow Jones Industrial Average, and the NASDAQ Composite.
The S&P 500: A Broad Market Benchmark
The Standard & Poor’s 500, or S&P 500, is one of the most important stock market indices. It represents about 80% of the total U.S. stock market value, making it an excellent gauge of overall market health. The index includes 500 of the largest U.S. companies, selected by a committee based on strict criteria. To be included, a company must meet specific requirements for profitability, market size, and liquidity.
- The company must be based in the U.S.
- It needs a market capitalization of at least $22.7 billion.
- It must have positive earnings in its most recent quarter and over the previous four quarters combined.
- A significant portion of its stock must be available for public trading.
The S&P 500 has historically provided strong returns, though it experiences periods of volatility.
The Dow Jones: A Blue-Chip Snapshot
The Dow Jones Industrial Average (DJIA) is the oldest and most famous of the U.S. stock market indexes. Created by Charles Dow in 1896, it tracks 30 large, well-established American companies. These “blue-chip” companies are leaders in their industries and include household names like Microsoft, Apple, and Walmart.
The Dow Jones Industrial Average is a price-weighted index. This means a stock with a higher share price has a greater impact on the index’s value, regardless of the company’s total size. A $1 change in any component stock has the same effect on the index total.
Because it contains only 30 companies, the Dow Jones Industrial Average offers a more focused view of the market compared to broader indices. It serves as a snapshot of the health of major U.S. corporations and is one of the most cited benchmarks in financial news.
The NASDAQ Composite: A Tech-Focused View
The NASDAQ Composite index is known for its heavy concentration of technology companies. It includes over 3,000 companies listed on the NASDAQ stock exchange, making it much broader than the Dow Jones Industrial Average. The NASDAQ Composite is a market-capitalization-weighted index, so larger companies like NVIDIA, Apple, and Microsoft have the most influence on its performance.
While it includes companies from various sectors, the NASDAQ Composite is dominated by innovative firms in areas like software, biotechnology, and semiconductors. This focus makes the NASDAQ Composite a key indicator for the tech industry and a popular benchmark for growth-oriented investors.
A real time stock index is a live, calculated score that tracks a group of stocks. This stock market index derives its value from processing continuous stock prices through a specific weighted formula. It is an indispensable tool for investors. The growth of passive investment strategies tied to these indices has a notable market impact on every stock.
“Basically, what we see happening is large firms keep getting bigger, and their stock prices keep going higher,” says one researcher.
This makes each stock index a powerful force. A real time stock index and other major indices remain essential for investors to gauge performance and understand the direction of the stock market index.
FAQ
What is the main difference between the S&P 500 and the Dow Jones?
The S&P 500 uses market-cap weighting, so larger companies have more influence. The Dow Jones uses price-weighting, giving stocks with higher share prices greater impact. The S&P 500 also tracks 500 companies, while the Dow Jones tracks only 30.
Why does an index need a divisor?
An index divisor maintains historical continuity. It prevents corporate actions like stock splits from distorting the index’s value. This adjustment ensures the index only reflects genuine market movements and remains a reliable benchmark for investors over time.
Can an individual invest directly in a stock market index?
An individual cannot buy an index itself because it is a calculation. However, investors can purchase financial products like Exchange-Traded Funds (ETFs) or index funds. These products are specifically designed to track the performance of an entire index.
How often is a real-time index updated?
A real-time index updates continuously during the trading day. Financial data providers receive live trade data from exchanges. They recalculate the index value every few seconds and distribute the new number to trading platforms and news outlets worldwide.
*This article is provided for general information purposes and does not constitute legal, tax or other professional advice from BiyaPay or its subsidiaries and its affiliates, and it is not intended as a substitute for obtaining advice from a financial advisor or any other professional.
We make no representations, warranties or warranties, express or implied, as to the accuracy, completeness or timeliness of the contents of this publication.
Related Blogs of

Enterprise Overseas Payroll Compliance and Tax Planning: How to Use Multi-Asset Payroll Platforms to Reduce Cross-Border Employment Costs?


How Do European International Students Pay the Final Installment for a Used Car? Digital Payment Methods to Avoid SEPA Transfer Delays Caused by Weekend Bank Closures


OpenAI Card Frequently Declined (Card Declined)? Virtual Card Tested Solutions


Capital Preparation in Early Stages of Cross-Border M&A: How Enterprises Safely Transfer Millions in USD Deposits to Overseas Trust Escrow Accounts?

Choose Country or Region to Read Local Blog

Contact Us


BIYA GLOBAL LLC is registered with the Financial Crimes Enforcement Network (FinCEN), an agency under the U.S. Department of the Treasury, as a Money Services Business (MSB), with registration number 31000218637349, and regulated by the Financial Crimes Enforcement Network (FinCEN).
BIYA GLOBAL LIMITED is a registered Financial Service Provider (FSP) in New Zealand, with registration number FSP1007221, and is also a registered member of the Financial Services Complaints Limited (FSCL), an independent dispute resolution scheme in New Zealand.