Best Hang Seng Index Tracking Apps 2025: Free Real-Time Quotes & Technical Analysis All-in-One


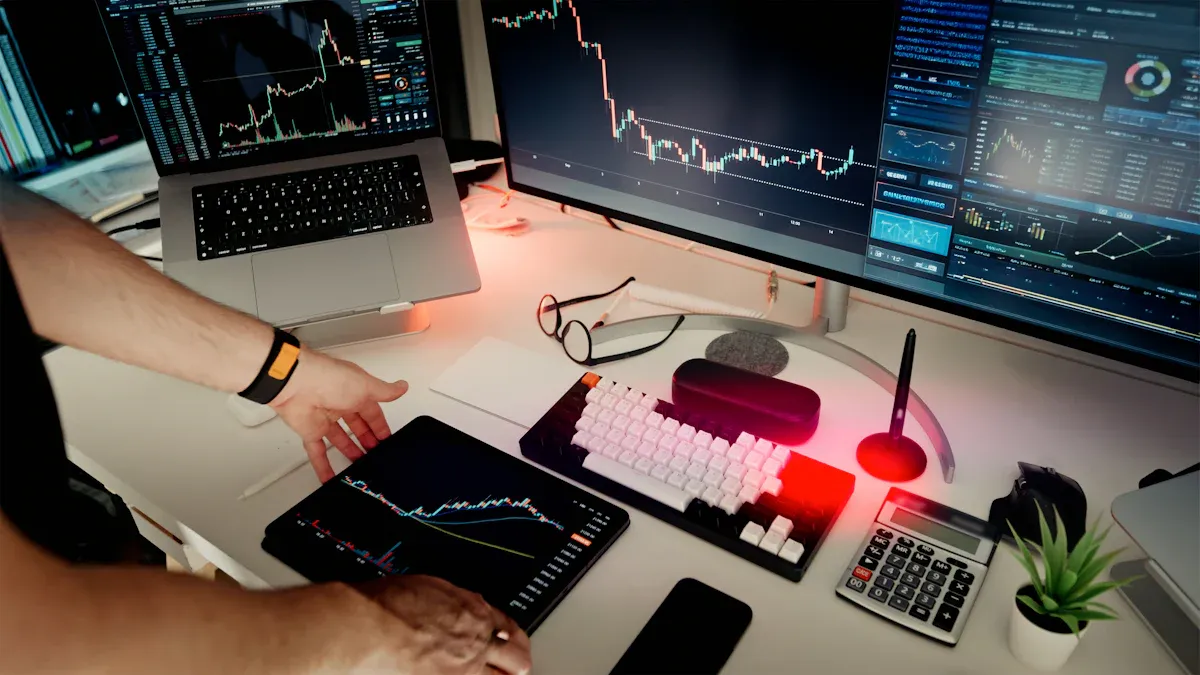
Image Source: unsplash
Want to invest in Hong Kong stocks but don’t know which app to use for market monitoring? Don’t worry—this article is your ultimate guide!
Do you often feel overwhelmed by massive market information and struggle to decide the right entry timing when the market fluctuates? Mastering real-time Hang Seng Index movements is actually not difficult. We will introduce several powerful free tools to help you easily solve issues with delayed quotes and trend analysis.
Key Takeaways
- When choosing a Hang Seng Index app, make sure it provides real-time quotes so you can react instantly to market changes.
- Make good use of built-in technical charts such as moving averages and RSI—they help you identify trends and optimal buy/sell timing.
- Build a watchlist and set price alerts so you never miss important opportunities.
- Beginners can start with user-friendly apps like Yahoo Finance and gradually move to more professional tools.
- AI-powered analysis is a great reference, but final investment decisions should still rely on your own judgment.
Three Key Factors When Choosing a Hang Seng Index App
There are countless apps on the market. To find the one that fits you best, focus on these three critical factors. Mastering them will help you screen tools more efficiently and make your investment journey smoother.
Get Real-Time Hang Seng Index Data: Zero-Delay Pulse Tracking
In the investment world, every second counts—one minute of delay can mean missing the best entry or exit point.
Many so-called “free” quote services are not truly real-time. You might not realize that some platforms have delays, for example:
- Index data may only refresh every 5 minutes.
- Certain overseas indices can be delayed by up to 20 minutes.
Therefore, choosing an app that offers “free real-time basic quotes” is crucial. This ensures the Hang Seng Index you see has zero delay, allowing you to react instantly to the latest price movements.
Master Technical Charts: Visualize Trends at a Glance
When facing endless numbers, a clear chart is worth a thousand words. Technical charts turn cold price data into intuitive visual patterns, helping you judge bullish or bearish trends. Beginners can learn to spot key signals through charts, such as:
- Head and Shoulders Top/Bottom: Signals a potential trend reversal.
- Double Top/Bottom: Another important reversal pattern.
- Triangles: Indicate consolidation and an upcoming breakout.
Many apps now include AI-powered pattern recognition, automatically detecting and marking these patterns—greatly reducing human error and boosting your confidence in market decisions.
Build a Watchlist: Never Miss Key Opportunities
When you start following multiple stocks, a solid watchlist feature becomes indispensable. It’s not just a list—it’s a powerful strategy management tool. You can use it to:
- Centralize tracking: Group all stocks or index ETFs you’re interested in for quick performance checks.
- Set alerts: Get instant notifications when a stock hits your target price.
- Stay focused on your strategy: Filter out market noise and avoid impulsive decisions driven by fear or greed.
A well-maintained watchlist acts like your personal investment radar, always ready to catch the next big move.
If you want “monitoring” and “fact-checking” to follow the same routine, start by adding the Hang Seng Index and the stocks you track most to a watchlist, then use that same list to verify basics like company profiles, latest price levels, and recent performance ranges. In practice, you can pull up a stock page quickly via BiyaPay Stock Info Lookup and keep your key tickers pinned, so you’re not restarting from search every time.
When you’re ready to move from “watching” to “executing,” you can also review available assets and the trading interface via the BiyaPay Trading Entry and plan based on your own risk tolerance. BiyaPay is positioned as a multi-asset wallet spanning investing, trading, and fund management, supported by compliance credentials such as a US MSB and New Zealand FSP registration; for feature updates or schedule notices, you can check the Events Center.
Top Hang Seng Index Tracking Apps – There’s One Perfect for You
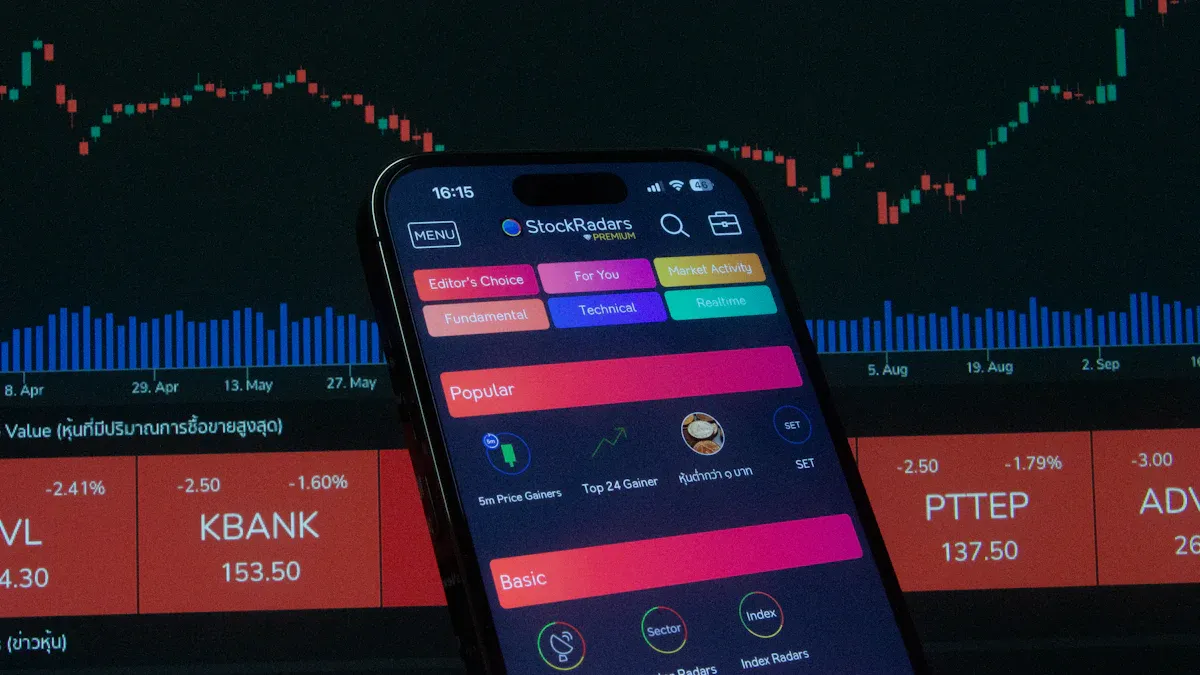
Image Source: pexels
After understanding the selection criteria, let’s dive into the most popular free Hang Seng Index tracking apps available today. Each has unique strengths, so no matter your needs, you’ll find the right one here.
TradingView: Professional Charts & Global Data
If you’re passionate about technical analysis, TradingView is hands-down the top choice. Known as the Swiss Army knife of charting, it offers world-class tools and a huge global community.
- Key Advantages:
- Best-in-class charting: Hundreds of indicators and drawing tools with smooth performance.
- Global coverage: Not just Hong Kong stocks—covers global equities, forex, crypto, and more.
- Active community: Learn strategies by viewing charts shared by traders worldwide.
- Main Drawbacks:
The free plan has noticeable limitations, which may feel restrictive for advanced users.
With a free account, you’ll see occasional video ads and upgrade prompts that can distract from charting.
| Feature | Free Plan Limit |
|---|---|
| Charts per tab | 1 |
| Indicators per chart | 2 |
| Ads & upgrade prompts | Yes |
- Best For:
Investors who love technical analysis and want professional-grade charting tools to study market trends.
Investing.com: The Most Comprehensive Financial Database
Investing.com is like a giant financial information library with astonishing data breadth—an excellent helper for macro research.
- Key Advantages:
- Comprehensive data: Global indices, commodities, futures, bond yields, and more.
- Economic calendar: Detailed schedule of major economic data releases to plan ahead.
- 44+ languages: Convenient for users worldwide.
- Main Drawbacks:
- Heavy ads: Many ad placements that can affect user experience.
- Basic charting: Lags far behind TradingView for in-depth technical analysis.
- Best For:
Investors who need broad macro data rather than deep individual stock technical analysis.
AAStocks: Deep Hong Kong Market Intelligence
If you focus exclusively on Hong Kong stocks, AAStocks is an indispensable localized powerhouse. Its depth of Hong Kong market information is unmatched by most global platforms.
- Key Advantages:
- Localized data: Detailed Hong Kong-specific info such as:
- IPO details
- Substantial shareholding disclosures
- Short-selling data
- Comprehensive warrants and CBBC data
- Fast news alerts: Instant updates on earnings, company announcements, etc.
- Localized data: Detailed Hong Kong-specific info such as:
- Main Drawbacks:
- Dated interface: Older design that may feel less appealing to younger users.
- Limited global coverage: Primarily focused on Hong Kong and mainland China markets.
- Best For:
Investors focused on Hong Kong stocks, especially those needing in-depth IPO and derivative data.
Yahoo Finance: Clean Interface & Beginner-Friendly
For newcomers, a clean and intuitive interface is everything. Yahoo Finance excels here, ensuring you won’t feel overwhelmed by complex features.
- Key Advantages:
- Ultra-clean layout: Organized and tidy—easily find quotes and news without getting lost.
- Simple search: Quickly look up tickers or financial terms.
- Great integration: Charts, fundamentals, and news all on one page.
- Main Drawbacks:
- Lacks advanced tools: No deep charting or quantitative data.
- Quotes may be delayed: Free real-time data is not guaranteed for all markets.
- Best For:
Complete beginners or users who just need quick quotes and news without complex analysis.
Futubull (Futu NiuNiu): All-in-One Trading + AI Analysis
Futubull is more than a monitoring app—it’s a comprehensive platform combining powerful analysis and lightning-fast trading.
- Key Advantages:
- Seamless watch-and-trade: Free real-time Hang Seng quotes with direct brokerage linkage.
- Powerful AI tools: Built-in features like:
- AI Q&A: Instant stock insights.
- AI stock screener: Curated picks for busy investors.
- Active community: Share ideas in “NiuNiu Circle”.
- Main Drawbacks:
- Feature overload: Can feel complex for absolute beginners.
- Full features require account: Advanced data and trading need a Futu brokerage account.
- Best For:
Investors who want analysis, AI tools, trading, and community all in one app.
etnet: Clean Dashboard & Smooth Experience
etnet is a veteran Hong Kong financial portal with a mobile app known for its clean interface and smooth performance—perfect for focusing on essential market data.
- Key Advantages:
- Dashboard design: Home screen shows sector performance, global indices, and hot themes at a glance.
- Custom portfolios: Track your H-shares and A-shares in one place.
- Instant alerts: Key news and IPO updates pushed in real time.
- Main Drawbacks:
- Basic charting: Lacks advanced technical tools.
- Limited community: No strong social features compared to Futu or TradingView.
- Best For:
Users who prefer a minimalist interface and fast access to Hang Seng Index and core news.
Hands-On Tutorial: Basic Technical Analysis with Apps
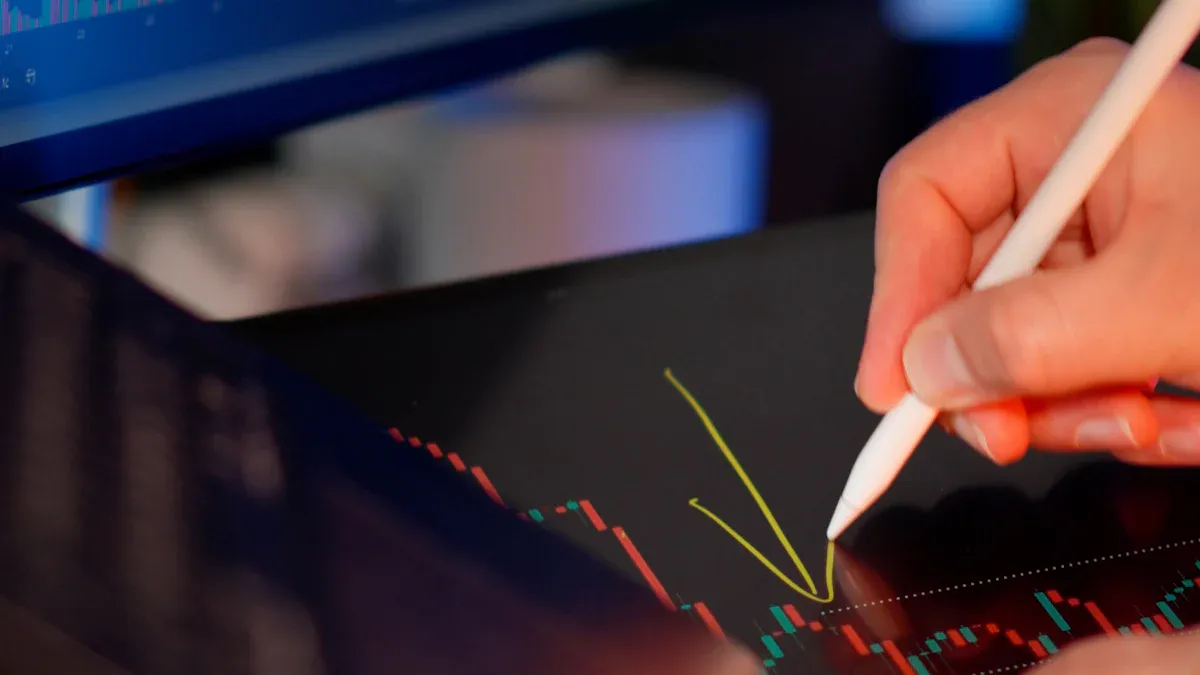
Image Source: unsplash
Now that you know how to pick an app, it’s time to put it into practice. Technical analysis isn’t as hard as it seems—just master a few basic indicators and you’ll greatly improve your market judgment.
Set Up Moving Averages (MA): Identify Trend Direction
Moving averages are the first indicator every beginner should learn. They smooth out short-term noise and reveal the longer-term trend. In most apps:
- Tap “Indicators” on the chart page.
- Select “Moving Average (MA)”.
- Add multiple lines (e.g., 20-day, 50-day).
- Adjust the “period” setting to change the number of days.
When a shorter-term MA crosses above a longer-term MA, it’s called a golden cross—a potential bullish signal. The opposite is a death cross.
| Cross Type | Signal | Market Implication |
|---|---|---|
| Golden Cross | Short MA crosses above long MA | Potential buy signal |
| Death Cross | Short MA crosses below long MA | Potential sell signal |
Check Relative Strength Index (RSI): Gauge Market Heat
RSI measures the balance between buyers and sellers on a scale from 0 to 100.
- RSI > 70: Overbought—price may be due for a pullback.
- RSI < 30: Oversold—possible rebound ahead.
Think of RSI as a market sentiment thermometer—stay cautious when everyone is greedy, and look for opportunities when fear dominates.
Draw Support & Resistance Lines: Find Key Price Levels
Support and resistance are critical psychological price zones.
Support acts like a floor—buyers step in to defend it. Resistance acts like a ceiling—sellers push back when price reaches it.
Use the horizontal line tool to connect previous lows (support) and highs (resistance). These levels help you plan better entry and exit points.
After reviewing all these apps, have you found your favorite yet? Each has its unique strengths—the key is matching them to your needs.
Final recommendations based on your style:
- Advanced technical analysis: Go with TradingView—unmatched charting and scripting.
- All-in-one trading + AI: Choose Futubull for seamless analysis-to-execution.
- Absolute beginners: Start with Yahoo Finance or etnet—clean and easy to use.
No more hesitation! Download the app that suits you best and start your Hang Seng investment journey today!
FAQ
Are these apps completely free?
Most core monitoring and charting features are free. However, advanced functions like ad removal, extra indicators, or deeper data often require a paid subscription.
Do I need to open a brokerage account for each app?
No. You can use all these apps purely for monitoring without any account. Only apps like Futubull require an account if you want to trade directly.
Should I use multiple apps at once?
Beginners should stick to 1–2 apps first. For example, use Yahoo Finance for quick quotes and TradingView for in-depth charting—this combination is highly efficient.
Can I fully trust the AI analysis suggestions in these apps?
AI analysis is an excellent auxiliary tool for quickly filtering information, but you should never rely on it 100%. Treat AI suggestions as references and combine them with your own judgment and other indicators before making final decisions.
*This article is provided for general information purposes and does not constitute legal, tax or other professional advice from BiyaPay or its subsidiaries and its affiliates, and it is not intended as a substitute for obtaining advice from a financial advisor or any other professional.
We make no representations, warranties or warranties, express or implied, as to the accuracy, completeness or timeliness of the contents of this publication.
Related Blogs of

Zelle Wire Transfer or ACH? Clearing Up the Confusion


Why Is Canada's Country Code 1

How Safe Is Your Money With Ally Bank in 2026?


The Easiest Way to Find the Code for Calling France

Choose Country or Region to Read Local Blog

Contact Us


BIYA GLOBAL LLC is a licensed entity registered with the U.S. Securities and Exchange Commission (SEC No.: 802-127417); a certified member of the Financial Industry Regulatory Authority (FINRA) (Central Registration Depository CRD No.: 325027); regulated by the Financial Industry Regulatory Authority (FINRA) and the U.S. Securities and Exchange Commission (SEC).
BIYA GLOBAL LLC is registered with the Financial Crimes Enforcement Network (FinCEN), an agency under the U.S. Department of the Treasury, as a Money Services Business (MSB), with registration number 31000218637349, and regulated by the Financial Crimes Enforcement Network (FinCEN).
BIYA GLOBAL LIMITED is a registered Financial Service Provider (FSP) in New Zealand, with registration number FSP1007221, and is also a registered member of the Financial Services Complaints Limited (FSCL), an independent dispute resolution scheme in New Zealand.