US Stock Indices Cheat Sheet: Understand Dow Jones, S&P 500, Nasdaq, and Russell 2000 at a Glance


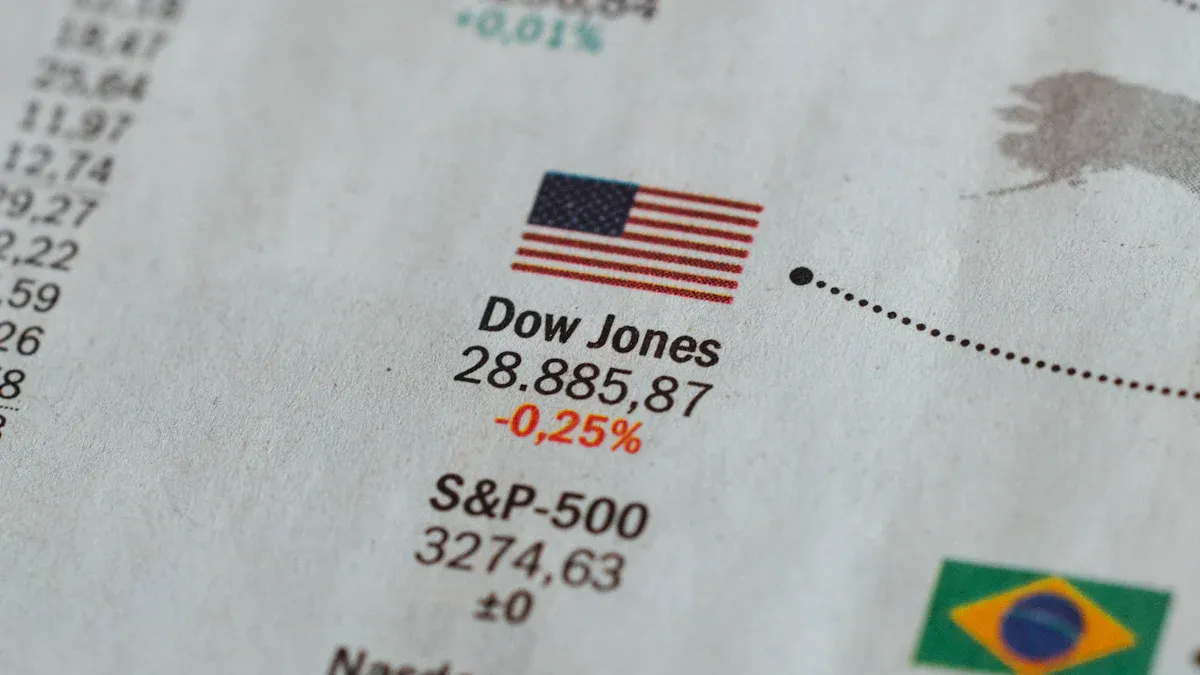
Image Source: unsplash
Want to invest in US stocks but can’t tell the difference between the Dow Jones and S&P 500? This cheat sheet will help you understand the four most-watched market indices in one go. Besides the commonly mentioned big three, we’ve added the Russell 2000 to give you a more complete picture of the US market. Let’s start with a quick comparison table to see their core differences at a glance!
US Major Indices Super Comparison
| Index Name | Number of Components | Calculation Method | Market Significance |
|---|---|---|---|
| S&P 500 | 500 companies | Market-cap weighted | Represents ~80% of US market cap; the key thermometer for overall market performance. |
| Dow Jones (DJIA) | 30 companies | Price weighted | Represents America’s most influential blue-chip stocks; the media’s favorite headline index. |
| Nasdaq (Composite) | Over 3,000 companies | Market-cap weighted | Focuses on tech and growth companies; seen as the future trend of innovative industries. |
| Russell 2000 | 2,000 companies | Market-cap weighted | Reflects the vitality of US small- and mid-cap companies; a microcosm of domestic economic health. |
Key Takeaways
- The US stock market has four major indices, each representing a different market segment.
- The S&P 500 is the benchmark for large-cap US stocks, covering about 80% of total US market capitalization.
- The Dow Jones includes 30 major US companies, reflecting the performance of these blue-chip stocks.
- The Nasdaq primarily tracks tech and growth companies, representing trends in innovative sectors.
- The Russell 2000 reflects the vitality of US small- and mid-cap companies and is an important indicator for observing the domestic economy.
Understanding the US Stock Market: Start with the S&P 500

Image Source: unsplash
If you want to grasp the overall pulse of the US market, the S&P 500 is the first index you must know. It is widely regarded as the best standard for measuring large-cap US stock performance and one of the indices that most accurately reflects the overall economic situation.
Index Features: The Thermometer of the US Market
Simply put, the S&P 500 is the most critical thermometer for observing the overall US stock market. This index covers about 80% of total US market capitalization. When it rises, it generally means most large US companies are performing well; when it falls, it indicates widespread market pressure.
Composition and Calculation: A Collection of 500 Leading Companies
The S&P 500 consists of 500 top US listed companies selected by Standard & Poor’s. To be included, companies must meet strict criteria:
- Headquartered in the US.
- Market cap of at least $22.7 billion.
- Profitable, with positive earnings in the past four quarters and the most recent quarter.
- Stocks must have good liquidity.
It uses a “market-cap weighted” method. Think of it as a tug-of-war contest: heavier players (higher market cap companies) pull harder on the rope. Therefore, price movements of mega-cap companies like Apple (Apple) or Microsoft have a much greater impact on the index than smaller components.
Market Significance: Preferred Reference for Long-Term Investing
Due to its broad representation and stability, the S&P 500 is the top choice for many long-term investors. Even Warren Buffett has publicly stated:
My advice to my family for wealth management is simple: put 10% in short-term government bonds and 90% in a very low-cost S&P 500 index fund.
Buffett believes that for ordinary investors who cannot devote significant time to stock research, long-term holding of an S&P 500 index fund will outperform most professional investors. Historical data supports this view:
| Period | Average Annual Return (with dividend reinvestment and inflation adjustment) |
|---|---|
| 30 years (1994 – 2024) | 9.33% |
This stable long-term return is why the S&P 500 is ideal for steady investing and retirement planning.
Dow Jones Industrial Average (DJIA): The Historic Blue-Chip Indicator

Image Source: unsplash
When you turn on financial news, the most frequently mentioned index is likely the Dow Jones Industrial Average (DJIA). It’s like America’s stock market “hall of fame.” Though it includes only a few companies, each is a household-name industry giant.
Index Features: Dynamics of 30 Elite Companies
The Dow tracks just 30 so-called “blue-chip” large listed companies. These are selected by Wall Street Journal editors as the most influential in the US economy. You’ve surely heard of members like Apple, Microsoft, McDonald’s, and Disney.
This index has a very long history and is a living record of US economic changes:
The Dow was first published in 1896 with just 12 companies. It wasn’t until 1928 that the components expanded to the familiar 30. It has witnessed the Great Depression, two world wars, and countless bull and bear cycles.
Composition and Calculation: Unique Price-Weighted Method
The Dow’s most distinctive feature is its use of a “price-weighted” method, completely different from the S&P 500’s market-cap weighting.
Simply put, higher-priced stocks have greater weight in the index, regardless of company size. This creates an interesting phenomenon:
- A $200 stock rising $1 has the same impact on the index as a $50 stock rising $1.
This means small price movements in high-priced stocks can have a far greater effect than large movements in low-priced stocks. Some argue the Dow doesn’t fully reflect true market conditions, but this is also what makes it unique.
Market Significance: Media Headline Regular
Why does an index with only 30 companies get so much media exposure?
Due to long-standing tradition and public recognition, the Dow has become a universal gauge of market sentiment. When people ask “How’s the stock market today?” they’re often thinking of the Dow’s point change. It’s not just an investment index but a barometer of national economic confidence and mood.
Though less representative than the S&P 500, the Dow’s historical status and media influence make it an indispensable reference for understanding market news and public sentiment.
Nasdaq Composite Index (Nasdaq): Future Trends in Tech and Growth Stocks
If the S&P 500 is the market’s thermometer, the Nasdaq Composite Index is the wind vane for innovative industries. When you think of world-changing companies like Apple, Amazon, or Tesla, you’re thinking of the Nasdaq spirit. This index specifically tracks all companies listed on the Nasdaq exchange and is the best gauge for tech and growth stock performance.
Index Features: Wind Vane for Innovative Industries
The Nasdaq represents America’s innovative power. It covers forward-looking sectors from software and semiconductors to biotech. When this index rises, it usually signals market confidence in future tech development. Many products and services you use daily are deeply tied to companies driving this index.
Composition and Calculation: Tech Giants Under Market-Cap Weighting
The Nasdaq Composite includes over 3,000 companies, the most among the four major indices. Like the S&P 500, it uses “market-cap weighting,” so mega-cap tech giants heavily influence the index.
However, Nasdaq isn’t just tech stocks. Biotech is also a major pillar, with many companies leading medical innovation:
- Moderna: Gained global fame during the COVID-19 pandemic with its mRNA vaccine technology.
- Amgen: Successfully developed breakthrough drugs for specific lung cancer mutations.
- BioNTech: Actively planning mRNA vaccine production facilities in Africa, showcasing global influence.
Market Significance: Capturing Tech Stock Investment Pulse
The Nasdaq’s high-growth nature makes it a focus for aggressive investors. Historically, its long-term returns are impressive. During the bull market from 2009 to late 2021, the Nasdaq consistently outperformed the S&P 500, largely due to massive gains from Apple, Amazon, and others.
Trivia: Nasdaq Composite vs. Nasdaq 100 You may often hear about the “Nasdaq 100 Index (NDX).” What’s the difference?
- Nasdaq Composite: Includes all stocks listed on the Nasdaq exchange, over 3,000 companies.
- Nasdaq 100: Selects only the largest 100 non-financial companies. In short, the Composite represents the entire Nasdaq market, while the 100 focuses more on top tech and growth giants.
In summary, the Nasdaq represents high growth potential but with higher volatility. If you’re bullish on tech’s future and willing to accept corresponding risks, the Nasdaq is a market pulse you must closely follow.
Russell 2000 Index (Russell 2000): Microcosm of US Economic Vitality
When you want to understand the true vitality of the US economy, beyond large companies, you should know the Russell 2000 Index (Russell 2000). This index specifically tracks US small- and mid-cap companies, which are closer to the domestic market, making it a key microcosm for observing US domestic demand and economic health.
Index Features: Barometer for Small- and Mid-Cap Companies
The Russell 2000 is a key barometer for US small- and mid-cap market performance. Why does it so accurately reflect domestic economic conditions? The answer lies in these companies’ revenue sources:
- On average, about 80% of Russell 2000 component companies’ revenue comes from the US domestic market.
- In contrast, only about 60% of S&P 500 large companies’ revenue is domestic.
This means the Russell 2000’s performance is less affected by global trade or exchange rate fluctuations, directly reflecting US domestic consumption and business activity.
Composition and Calculation: Tracking 2,000 Potential Companies
The Russell 2000 components are the remaining 2,000 companies after removing the top 1,000 by market cap from the Russell 3000 Index (covering the top 3,000 US companies by market cap). Like the S&P 500, it uses “market-cap weighting.”
How big are these “small-cap” companies? Refer to the data below:
| Index Name | Number of Companies | Largest Market Cap | Smallest Market Cap |
|---|---|---|---|
| Russell 2000 | 2,010 | $7.1 billion | $150.4 million |
Source: FTSE Russell. Data as of April 30, 2024.
In sector distribution, the Russell 2000 shows a different profile from large-cap indices:
You’ll find financials, industrials, and healthcare are the highest-weighted sectors in the Russell 2000. This reflects a market full of regional banks, manufacturers, and innovative biotech firms. Compared to the Nasdaq, it has a lower tech weighting and a more diversified portfolio.
Market Significance: Observing Domestic Economic Health
Due to its high sensitivity to the domestic economy, the Russell 2000 is a leading indicator for economic direction. When investors expect economic recovery or acceleration, capital often flows first into small- and mid-cap stocks, pushing the index higher.
Generally, the Russell 2000 performs particularly well in these scenarios:
- Early stages of economic recovery from recession.
- Market expectations of imminent interest rate cuts (benefiting lower corporate financing costs).
- Investor sentiment turning optimistic, willing to take higher risks.
Thus, when you see the Russell 2000 starting to outperform the broader market, it may signal that the market is bullish on the future of the US domestic economy.
Four Major Indices Comparison: How to Choose Your Market Indicator?
After understanding the unique features of the four indices, you might ask: “Which index should I follow?” There’s no standard answer, as they’re like four lenses with different focal lengths, each capturing a different aspect of the market. Choose the most suitable reference based on your investment goals and style.
Steady Investing: Reference the S&P 500
If your goal is long-term steady growth, such as retirement planning, the S&P 500 is your most important reference.
It broadly covers about 80% of US market cap, highly representative, and effectively diversifies single-sector or company risk. Historical returns prove its stability.
Long-Term Returns Speak Volumes Over the past 10 years ending December 2024, the S&P 500’s average annual return (with dividends) was 13.3%. In contrast, the Russell 2000, representing small- and mid-caps, had an annualized return of 7.82%. This shows large blue-chip stocks’ stability advantage in long-term holding.
Moreover, S&P 500 components are mostly mature, profitable companies that pay regular dividends. Though yields are at historic lows recently, over the long term, this cash flow significantly contributes to total returns.
This chart tells you dividends are part of market cycles. Even during price volatility, stable dividends provide a buffer for your portfolio.
Tech Growth: Focus on Nasdaq
If you’re bullish on tech’s future and willing to accept higher risk for higher potential returns, the Nasdaq Composite is your top choice.
This index epitomizes innovative industries, especially world-changing tech giants. Two major trends are currently driving Nasdaq growth:
- Artificial Intelligence (AI): From chip design to software applications, AI development brings huge imagination to the tech sector.
- Cloud Computing: Corporate digital transformation demand continues to rise, making cloud services indispensable infrastructure.
Due to its concentration in growth stocks, the Nasdaq’s volatility is much higher than the S&P 500. In bullish markets, it may lead gains; in bearish markets or rising rates, it often falls harder. Following the Nasdaq requires a strong heart and deep understanding of tech trends.
Economic Pulse: Watch Russell 2000
If you want to stay ahead in understanding the true health of the US economy, closely watch the Russell 2000.
Due to its components’ high reliance on the US domestic market, this index is extremely sensitive to domestic economic changes and often seen as a “leading indicator” of economic cycles. Its performance often foreshadows economic shifts:
- Signal of Economic Recovery: In the early stages of recovery from recession, small-cap performance usually leads large caps. Investors expecting improvement prioritize higher-growth-potential small companies.
- Interest Rate Policy Wind Vane: When markets expect Fed rate cuts, the Russell 2000 typically rebounds first. Rate cuts lower financing costs for small companies, directly improving profitability.
Observing the relative strength of the Russell 2000 versus the S&P 500 helps judge current market risk appetite and future economic expectations.
News Focus: Understand the Dow Jones
When you open financial news daily and hear “US stocks plunge 500 points,” it’s almost always referring to the Dow Jones. Though less representative than the S&P 500, learn to interpret it correctly.
The Dow is a media darling, but reporting has a “big news bias”. Research shows journalists amplify major negative events while ignoring frequent small gains.
| Index | Actual Average Daily Change (Annualized Return) | Media-Weighted Average Daily Change |
|---|---|---|
| Dow (US) | Positive | Negative |
| DAX (Germany) | Positive (7%) | Negative (-10 points) |
| FTSE 100 (UK) | Positive | Negative |
Source: 2017-2024 data research
Interpretation Key: The table shows that despite long-term upward trends in major indices, media-weighted impressions are negative. This is because “crashes” attract far more attention than “small gains.”
Thus, when seeing sensational Dow headlines, stay calm. Use it as a reference for market sentiment but not your sole investment decision basis. Return to broader indices like the S&P 500 or those aligned with your strategy for comprehensive judgment.
After reviewing the four indices, you’ll see they’re different lenses on the US stock market, each with unique functions and no absolute superiority. Use them flexibly based on your investment style.
If you treat the four indices as a “market language,” the next practical step is usually twofold: keep tracking with a consistent lens (e.g., checking the same set of indices at comparable times), and map index narratives back to what you actually hold or watch (stocks, ETFs, or sectors). For organizing that workflow, you can use BiyaPay Stock Quote & Info to keep your frequently watched names in one place—confirm tickers, trading ranges, and basics—so “watching indices” and “executing on instruments” don’t become two disconnected systems.
If your allocation involves multiple currencies, it becomes closer to risk control: estimate conversion cost first, then decide whether to phase in or fund in one go. In that case, BiyaPay FX Converter & Comparison helps you sanity-check FX spreads and conversion costs, turning “understanding indices” into an executable plan. For occasional tool updates or operational reminders, you can also monitor the Events Center to avoid missing key timing details.
Experts remind that even historically reliable recession signals (like yield curve inversion) can fail. Over-relying on a single indicator may cause you to miss important market gains.
- S&P 500: Market breadth
- Nasdaq: Tech future
- Dow Jones: Blue-chip elite
- Russell 2000: Economic potential
Master the four indices for a more comprehensive view of your US stock investments!
FAQ
Which index is the best?
There’s no “best” index, only the one most suitable for you. Steady investors should reference the S&P 500; those pursuing tech growth should focus on Nasdaq. Your investment goals determine which index matters most to you.
Can I directly invest in these indices?
You cannot buy indices directly. You can invest in index-tracking exchange-traded funds (ETFs).
- For example, buying an ETF tracking the S&P 500 is equivalent to investing in 500 major US companies at once.
- This is the simplest and most risk-diversified investment method.
Why does news always report the Dow Jones?
Because the Dow has the longest history and has become a media reporting habit. Its point changes are intuitive and quickly convey market sentiment. But remember, its representation is less than the S&P 500 and better used as a reference for market atmosphere.
How do the risks (volatility) of these four indices rank?
Generally, risk and volatility rank from high to low as follows:
- Nasdaq (tech growth stocks dominant)
- Russell 2000 (small- and mid-cap)
- S&P 500 (large-cap diversified portfolio)
- Dow Jones (30 mature blue-chip stocks)
*This article is provided for general information purposes and does not constitute legal, tax or other professional advice from BiyaPay or its subsidiaries and its affiliates, and it is not intended as a substitute for obtaining advice from a financial advisor or any other professional.
We make no representations, warranties or warranties, express or implied, as to the accuracy, completeness or timeliness of the contents of this publication.
Related Blogs of

How Safe Is Your Money With Ally Bank in 2026?


Tap and Go A Beginner's Guide to Cardless ATM Withdrawals


What is the Dialing Code for the USA and How to Call?


How to Fill Out a CVS Money Order A 2026 Guide

Choose Country or Region to Read Local Blog

Contact Us


BIYA GLOBAL LLC is a licensed entity registered with the U.S. Securities and Exchange Commission (SEC No.: 802-127417); a certified member of the Financial Industry Regulatory Authority (FINRA) (Central Registration Depository CRD No.: 325027); regulated by the Financial Industry Regulatory Authority (FINRA) and the U.S. Securities and Exchange Commission (SEC).
BIYA GLOBAL LLC is registered with the Financial Crimes Enforcement Network (FinCEN), an agency under the U.S. Department of the Treasury, as a Money Services Business (MSB), with registration number 31000218637349, and regulated by the Financial Crimes Enforcement Network (FinCEN).
BIYA GLOBAL LIMITED is a registered Financial Service Provider (FSP) in New Zealand, with registration number FSP1007221, and is also a registered member of the Financial Services Complaints Limited (FSCL), an independent dispute resolution scheme in New Zealand.