- More
- Download
Why Do Semiconductor Stocks Fall Together? The Linkage Logic Between Samsung, TSMC, ASML, and Nvidia





When semiconductor stocks fall together, it usually does not mean that every chip company’s fundamentals have deteriorated at the same time. More often, the market is repricing the same set of assumptions: how long AI demand can last, whether cloud CAPEX is too high, whether memory price increases are slowing, and whether advanced process and equipment orders can keep converting into earnings. Samsung, TSMC, ASML, and Nvidia represent memory, foundry, equipment, and AI compute demand, respectively. When one link shows an expectation gap, capital quickly reprices the entire chip supply chain, while ETFs and quantitative trading amplify synchronized volatility.
Key Takeaways
- Semiconductor stocks often fall together because of expectation resets, not simultaneous industry decline.
- Samsung affects memory prices, while TSMC affects advanced process and AI chip supply.
- ASML order changes influence future capacity expectations and equipment-stock valuations.
- Nvidia often reflects AI compute demand and overall market risk appetite.
- ETFs, options, and crowded positioning can amplify synchronized chip-stock volatility.
- To judge real risk, watch orders, CAPEX, valuation, inventory, and guidance together.
Why Do Semiconductor Stocks Fall Together?
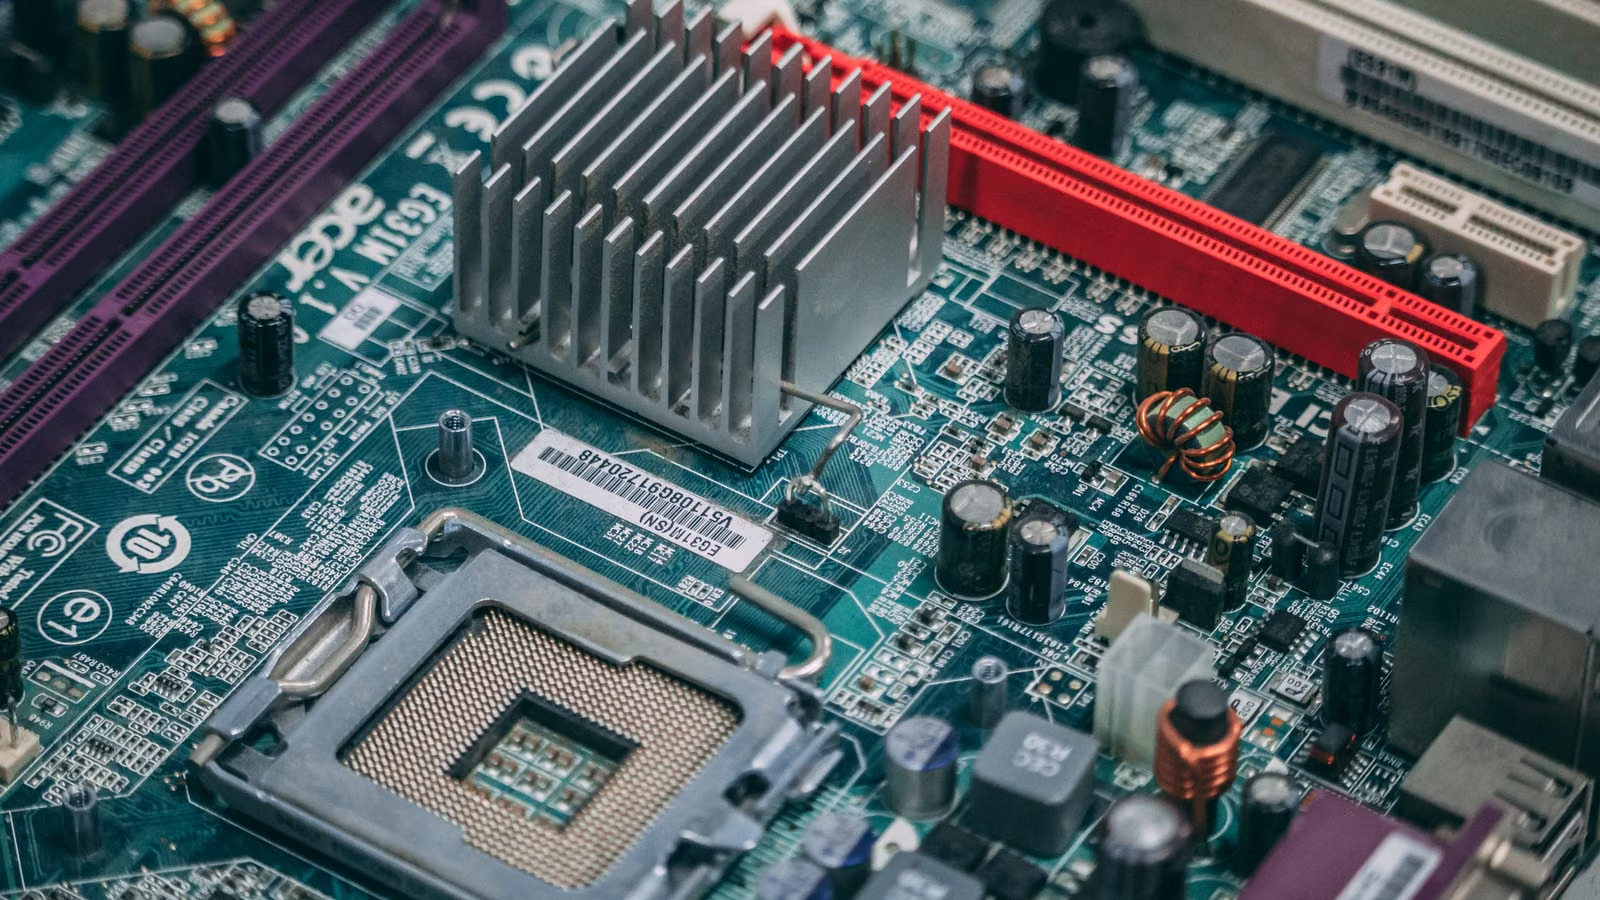
Semiconductor stocks fall together because the market often prices different companies as part of the same AI and chip cycle. Samsung, TSMC, ASML, and Nvidia have different businesses, but all are affected by AI data centers, hyperscaler capital expenditure, advanced processes, memory prices, and market valuations. When investors downgrade one key assumption, the entire chain comes under review.
Semiconductors are one of the most globally integrated industries. On the demand side, the sector covers AI servers, cloud computing, PCs, smartphones, automotive electronics, and industrial equipment. On the manufacturing side, it includes foundry services, advanced packaging, lithography equipment, materials, and testing. On the trading side, it is also tied to semiconductor ETFs, index funds, options, and quantitative strategies. As a result, an earnings expectation gap at one company can become a trigger for broader sector risk appetite.
A recent example is Samsung. Samsung’s second-quarter earnings guidance projected consolidated revenue of about KRW 171 trillion and operating profit of about KRW 89.4 trillion. Reuters reported that Samsung’s operating profit rose about 19 times year over year, yet Samsung’s share price fell as investors worried about the durability of AI memory demand. Strong results can still trigger a sell-off because the market trades future growth, not just single-quarter numbers.
| Trigger | Transmission Path | Typical Affected Companies |
|---|---|---|
| Cooling AI demand expectations | GPU, HBM, and server orders are repriced | Nvidia, Broadcom, Micron |
| Slower memory price increases | DRAM and NAND earnings leverage is repriced | Samsung, SK Hynix, Micron |
| Advanced-process CAPEX changes | Foundry and equipment demand is repriced | TSMC, ASML, Applied Materials |
| Hyperscaler spending pressure | AI infrastructure returns are scrutinized | Nvidia, TSMC, data center chain |
| ETF outflows | Constituents face synchronized pressure | SOX, SMH, SOXX products |
The same transmission can happen in U.S. markets. After Samsung’s strong profit failed to ease AI chip concerns, the Nasdaq fell, while Micron, SanDisk, and other memory-related stocks came under pressure, and the Philadelphia Semiconductor Index also dropped sharply. This shows that a sector sell-off is often not about one company’s negative news, but about investors using one company’s information to reassess the entire supply chain.
Summary: Semiconductor stocks often fall together because the same set of macro and industry assumptions is being repriced, not because every company is deteriorating at once. You should not look only at one company’s news. You need to understand which signal that company represents: AI demand, memory prices, advanced processes, equipment orders, or hyperscaler CAPEX. If that signal changes market assumptions about future orders, margins, and valuation multiples, synchronized sector declines can occur.
What Signals Do Samsung, TSMC, ASML, and Nvidia Represent?
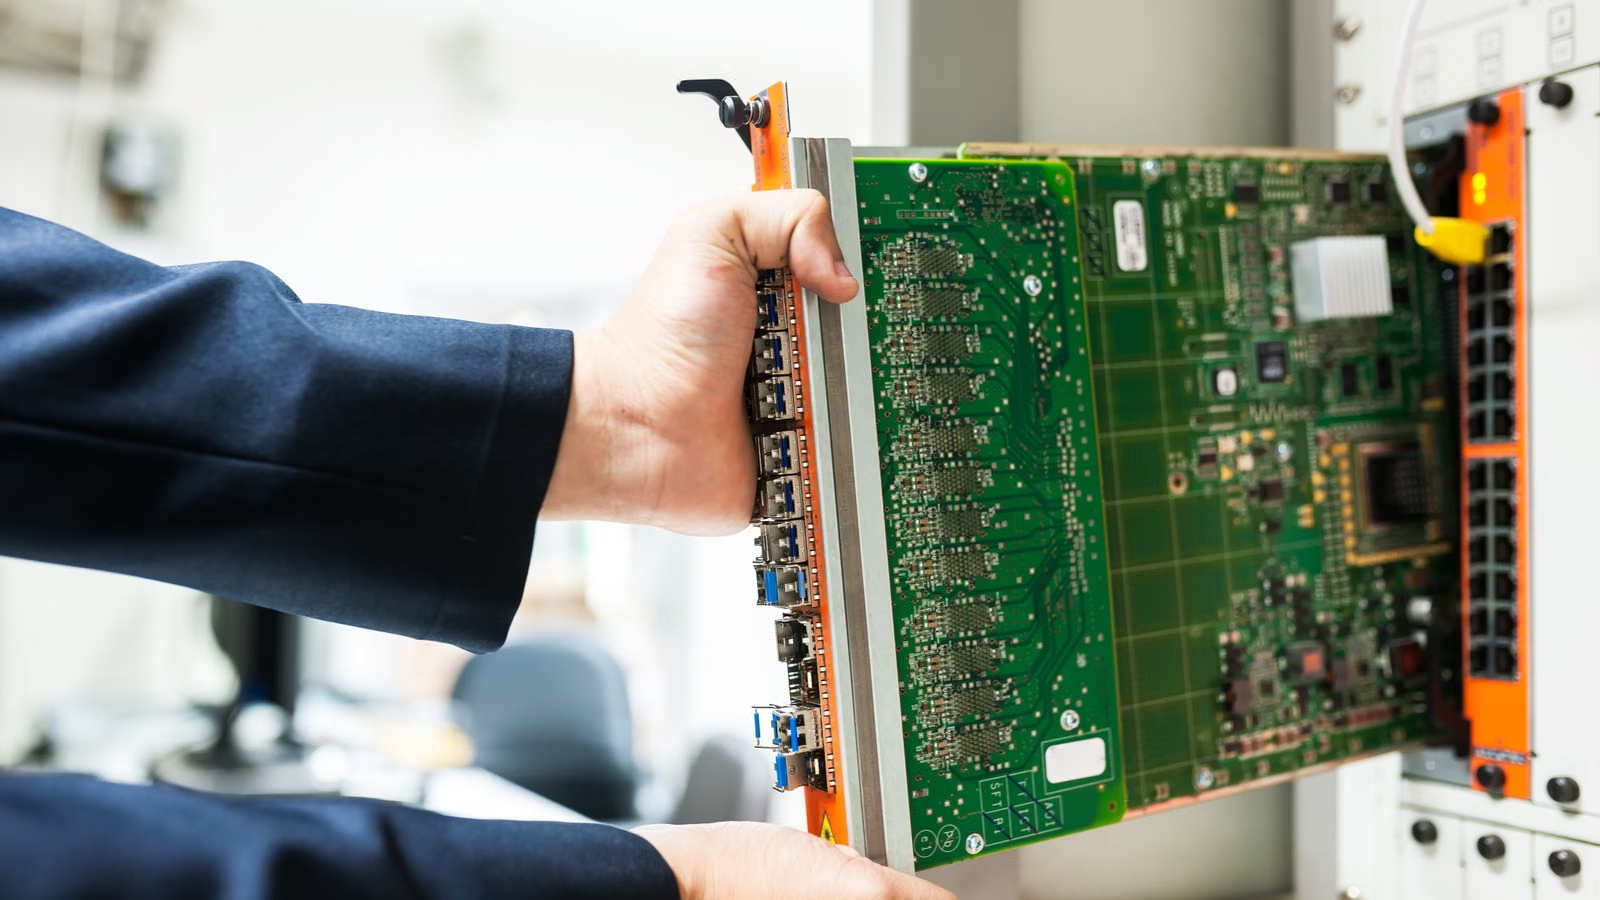
Samsung, TSMC, ASML, and Nvidia are not the same type of chip company, but they represent four key signals in the semiconductor cycle: Samsung reflects memory pricing, TSMC reflects advanced manufacturing and packaging capacity, ASML reflects future equipment-driven capacity, and Nvidia reflects AI compute demand. Weakness in any one of these signals can trigger a sector-wide risk reset.
Samsung Represents the Memory Cycle and AI Memory Prices
Samsung is an important player in DRAM, NAND, and HBM. Its earnings help investors observe AI server memory demand, memory contract prices, inventory cycles, and HBM supply tightness. Samsung’s strong earnings followed by a share-price decline does not mean memory demand has disappeared. It means the market is worried that strong growth was already priced in and that future profit leverage may fall short of the most optimistic assumptions.
TSMC Represents Advanced Process and AI Chip Capacity
TSMC is a key foundry for advanced chips from Nvidia, AMD, Apple, Broadcom, and other major customers. Reuters reported that TSMC’s second-quarter revenue rose 36% year over year to a record high, mainly driven by AI demand. The market watches not only revenue, but also 3nm, 2nm, CoWoS advanced packaging, yields, and CAPEX. If TSMC raises capacity and capital spending, equipment and materials companies may benefit. If its guidance is cautious, the AI hardware chain can come under pressure.
ASML Represents Equipment Orders and Future Capacity
ASML is the key supplier of EUV lithography equipment, directly affecting the expansion speed of advanced logic chips and advanced memory. Reuters reported that ASML raised its 2026 revenue outlook to EUR 43 billion to EUR 45 billion due to AI chip demand and planned to increase EUV and DUV capacity. Strong ASML orders usually indicate support for fab expansion over the next two to three years. Slower orders may suggest that customer CAPEX cycles are becoming more cautious.
Nvidia Represents AI Demand and Market Sentiment
Nvidia is the key barometer of AI GPU demand. Its revenue guidance, gross margin, data center revenue, and new product cycle affect TSMC, HBM suppliers, servers, networking equipment, power infrastructure, and data centers. Nvidia once issued a quarterly revenue outlook above market expectations, but its share price can still fluctuate because of competition and already high expectations. This shows that the valuation threshold for AI leaders is already demanding.
| Company | Signal Represented | Key Indicators |
|---|---|---|
| Samsung | Memory cycle | DRAM, NAND, HBM prices and inventory |
| TSMC | Advanced process | 2nm, 3nm, CoWoS, CAPEX |
| ASML | Future capacity | EUV orders, DUV demand, customer expansion |
| Nvidia | AI demand | Data center revenue, GPU shipments, gross margin |
Summary: These four companies are linked because they sit at critical nodes of the AI semiconductor supply chain. Samsung tells you whether memory is tight. TSMC tells you whether advanced chips can be manufactured. ASML tells you whether future capacity is still expanding. Nvidia tells you whether AI compute demand remains strong. When assessing sector risk, you should treat them as four signal sources rather than four unrelated stocks.
Why Can One Company’s Problem Spread Across the Entire Chip Chain?
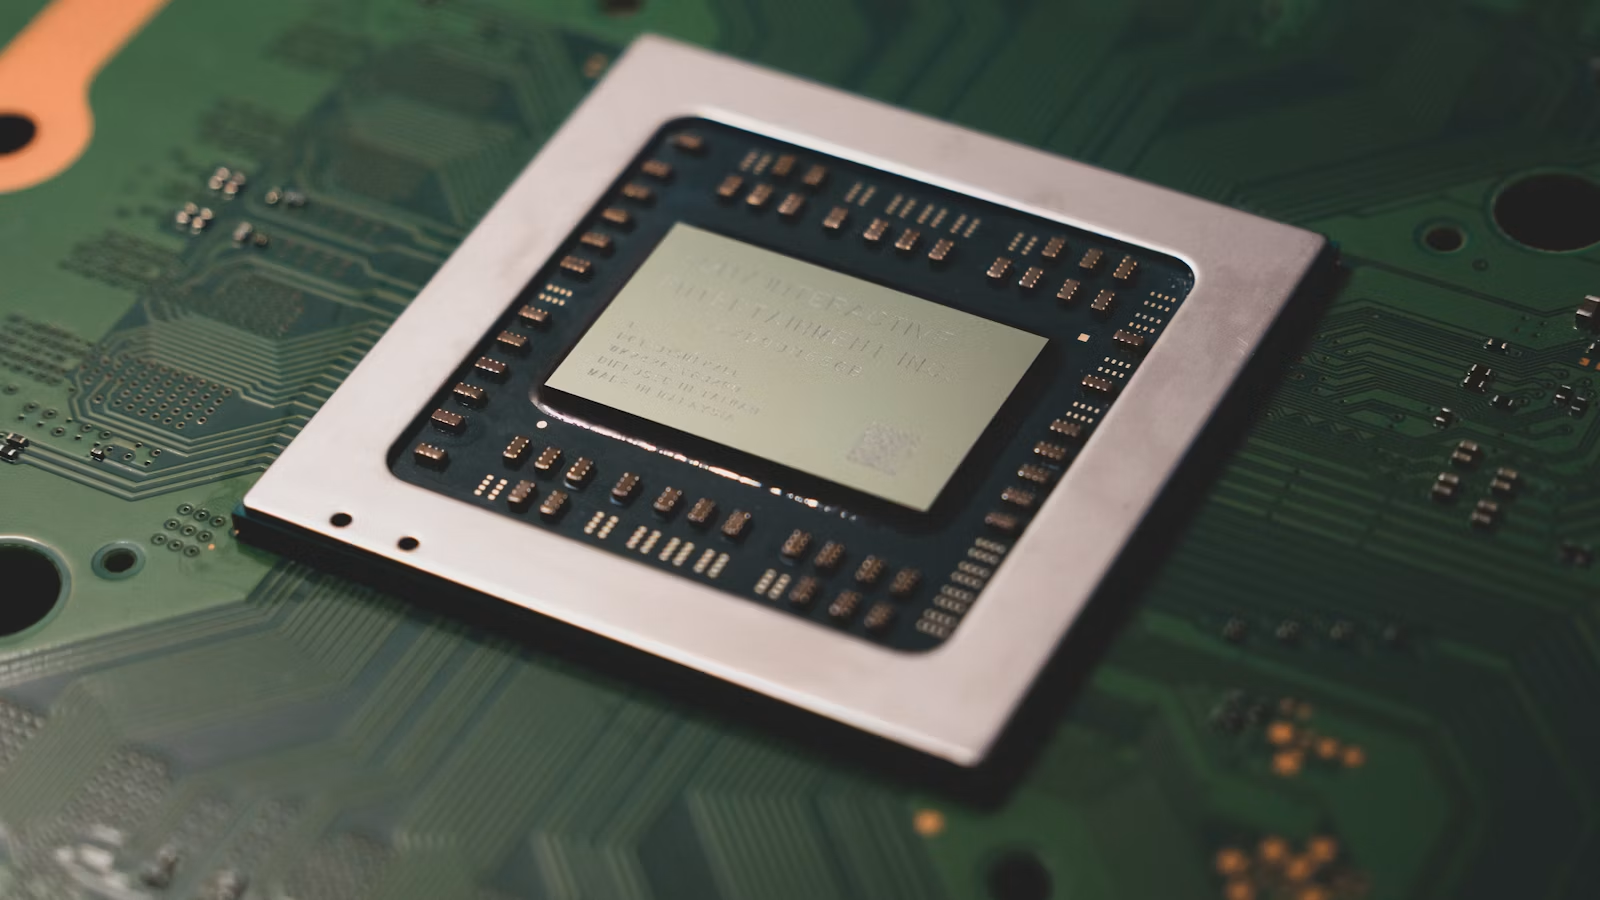
One company’s problem can spread across the entire chip chain because the semiconductor industry depends heavily on the continuity of orders, capacity, pricing, and capital expenditure. A shift in Nvidia demand can affect TSMC foundry demand and CoWoS packaging. TSMC capacity expansion affects ASML equipment orders. AI server growth also drives HBM and DRAM demand from Samsung, SK Hynix, and Micron.
The semiconductor supply-chain transmission path is usually not linear; it often involves multiple points of resonance. For example, when cloud providers increase AI CAPEX, the first impact appears in Nvidia GPU and networking equipment orders. Those orders then flow into TSMC’s advanced process capacity, CoWoS packaging, and ABF substrate demand. As server shipments rise, HBM, DDR5, enterprise SSDs, and power equipment demand also increases. If fabs need to expand, equipment makers such as ASML, Applied Materials, Lam Research, and Tokyo Electron are repriced as well.
In reverse, if one node falls short of expectations, the market can infer broader risks:
| Reporting Company | Market Interpretation | Possible Transmission Targets |
|---|---|---|
| Samsung | Are memory price increases and AI memory demand peaking? | Micron, SK Hynix, memory ETFs |
| TSMC | Are AI chip foundry orders and advanced packaging still tight? | Nvidia, AMD, Broadcom, ASML |
| ASML | Are future expansion plans and equipment orders still strong? | Semiconductor equipment and foundry stocks |
| Nvidia | Will AI compute demand and data center investment continue? | AI hardware chain and semiconductor ETFs |
“Good news can still cause stocks to fall” is one of the most misunderstood parts of linkage risk. A company can report strong results, but if they are not strong enough, its stock may still decline. Guidance can be raised, but if the increase is smaller than implied expectations, the broader sector may still come under pressure. Orders can remain strong, but if investors worry about high bases, valuation multiples may compress. Reuters once reported that listed chip stocks lost about USD 1.3 trillion in market value during a sell-off, showing that semiconductor valuation resets can happen very quickly.
ASML’s customer structure also explains the linkage logic. ASML serves advanced manufacturing and memory customers such as TSMC, Samsung, SK Hynix, and Micron. Its equipment orders are a leading indicator of downstream expansion intentions. If equipment orders are strong, the market may assume that future AI chip and memory capacity is still expanding. If equipment orders slow, investors may worry that downstream customers are starting to control CAPEX.
Summary: The core of semiconductor linkage is not the news itself, but how that news changes market assumptions about future orders, capacity, prices, and CAPEX. When you see earnings or share-price volatility at one chip company, first identify which part of the value chain it represents: demand, manufacturing, equipment, or memory. Only by understanding the signal-transmission path can you distinguish short-term sentiment from real fundamental risk.
How Do AI CAPEX, Valuation, and Crowded Trades Amplify Semiconductor Volatility?
The larger AI CAPEX becomes, the more it supports semiconductor orders in the short term, but the more the market focuses on investment returns, depreciation, and free cash flow. When chip stocks rise, CAPEX is treated as long-term demand. When chip stocks fall, the same capital spending can be interpreted as overinvestment risk.
Higher AI capital expenditure by major cloud providers simultaneously drives Nvidia GPUs, TSMC advanced processes, ASML equipment, Samsung and SK Hynix HBM, as well as data centers, power, networking equipment, and liquid-cooling infrastructure. Reuters reported that Microsoft, Alphabet, Meta, and Amazon could spend nearly USD 600 billion on AI-related initiatives in 2026. The larger the scale becomes, the more investors ask whether AI revenue can cover depreciation and financing costs.
Valuation and market structure further amplify the swings. Reuters cited a Bank of America fund manager survey showing that long global semiconductor exposure was the most crowded trade for the third consecutive month, reaching 82%. When large amounts of capital are positioned in the same AI supply chain, any earnings, order, or guidance result that falls short of expectations can trigger concentrated profit-taking.
| Market Mechanism | How It Amplifies Declines | What Investors Should Watch |
|---|---|---|
| ETF redemptions | Constituents are passively sold | ETF flows and trading volume |
| Options hedging | High volatility magnifies short-term moves | Implied volatility |
| Quant deleveraging | Same-theme stocks are sold together | Factor and volatility changes |
| Crowded trades | Negative catalysts trigger concentrated profit-taking | Positioning and target-price distribution |
| Valuation compression | High-P/E stocks face pressure first | Forward P/E and EPS revisions |
Semiconductor ETFs also bind different links of the chain together. You may buy or sell an ETF, but the underlying holdings may include GPU, foundry, equipment, EDA, memory, and analog chip companies at the same time. When ETF outflows occur, constituents can face passive selling pressure even if some companies’ fundamentals have not deteriorated. The options market can also amplify earnings-season volatility, especially before and after results from heavyweight names such as Nvidia, TSMC, and ASML, when market-making and hedging activities increase short-term swings.
Summary: AI CAPEX, valuation, and crowded trades make semiconductor stocks rise together and fall together. CAPEX creates orders, but it also creates return pressure. High valuations create upside sensitivity, but also valuation-compression risk. ETFs and quantitative strategies improve trading efficiency, but they also increase the probability of synchronized declines. To judge sector risk, you must look at both fundamentals and capital flows, not only individual company news.
How Can You Distinguish a Sentiment-Driven Sector Sell-Off From Fundamental Deterioration?
If semiconductor stocks fall but orders, prices, guidance, and earnings forecasts do not deteriorate together, the move is more likely a sentiment-driven sell-off or valuation reset. If hyperscalers cut CAPEX, memory prices weaken, TSMC and ASML issue cautious guidance, and Nvidia’s revenue comes in below expectations at the same time, the sell-off is closer to fundamental deterioration.
Sentiment-driven sell-offs usually have several features: leading companies still report strong earnings, management does not materially cut guidance, analysts continue to raise earnings estimates, stocks rebound quickly after the decline, and short-term ETF flows move more sharply than fundamentals. For example, after SK Hynix once fell sharply, it later rebounded nearly 13% on optimism around AI memory demand and a recovery in U.S. technology shares. Samsung also recovered, suggesting that part of the earlier decline came from position unwinding and sentiment repair.
Fundamental deterioration requires more caution. You should look for order cancellations or delays, hyperscalers postponing data center projects, weaker DRAM, NAND, or HBM contract prices, TSMC cutting advanced-process demand expectations, ASML orders missing expectations, or Nvidia’s data center revenue and gross-margin guidance falling materially below market expectations. If these signals appear together, the sell-off is no longer just valuation volatility; it may reflect a change in the earnings cycle.
| Dimension | Sentiment-Driven Sell-Off | Fundamental Deterioration |
|---|---|---|
| Orders | No clear change | Cancellations, delays, or cuts |
| Guidance | Management maintains or raises it | Revenue or gross margin cut |
| Prices | DRAM and HBM remain strong | Contract prices weaken |
| CAPEX | Cloud providers keep spending | Data center projects delayed |
| Capital flows | Short-term ETF outflows | Long-term capital exits |
| Rebound strength | Fast recovery | Weak rebound |
You can also watch the language used after earnings. If a company says “demand remains strong, but supply is constrained,” the issue is more likely a supply bottleneck. If it says “customer purchasing is normalizing,” high growth may be slowing. If it says “customers are adjusting inventory,” you should pay more attention to downcycle risk. The semiconductor industry rarely shifts suddenly from strong demand to broad recession. More often, orders, inventory, prices, and CAPEX give signals one after another.
Summary: Semiconductor stocks falling together does not automatically mean fundamentals are deteriorating. You need to verify the move through orders, prices, CAPEX, and management guidance. If earnings remain strong, prices are stable, and CAPEX continues, the pullback may be a valuation reset or position unwind. If order cuts, falling prices, slower capital spending, and lower earnings estimates appear together, the risk weight should rise. For semiconductor risk assessment, consecutive industry data matter more than one-day price moves.
How Should Investors Track Semiconductor Linkage Risk?
The best way to track semiconductor linkage risk is to observe five layers at the same time: demand, manufacturing, equipment, memory, and capital flows. Semiconductors are not a single uniform industry. They are a global supply chain with mutually dependent links. You need to know where each company sits in the chain rather than treating all chip stocks as the same type of asset.
The first layer is demand, focusing on Nvidia data center revenue, hyperscaler AI revenue, server orders, and AI CAPEX. The second is manufacturing, focusing on TSMC’s advanced processes, CoWoS capacity, yields, and capital spending. The third is equipment, focusing on ASML orders, EUV delivery cycles, and customer expansion plans. The fourth is memory, focusing on HBM, DRAM, NAND prices, and inventory at Samsung, SK Hynix, and Micron. The fifth is capital flows, focusing on the SOX index, SMH, SOXX, semiconductor ETF flows, options volatility, and sector valuation.
| Asset Type | Core Indicators | Main Risk |
|---|---|---|
| Nvidia / AI GPUs | Data center revenue, supply chain, gross margin | High expectations and customer concentration |
| TSMC | Advanced process, CoWoS, CAPEX | Capacity bottlenecks or demand slowdown |
| ASML | Equipment orders, EUV delivery | Customer CAPEX-cycle changes |
| Samsung / Micron / SK Hynix | HBM, DRAM, NAND prices | Memory-cycle reversal |
| Semiconductor ETFs | Holdings, expense ratios, volatility | Concentrated holdings and synchronized pullbacks |
If you track international-market names such as semiconductor ETFs, Nvidia, TSMC ADRs, ASML ADRs, and Micron, you should also consider trading costs, foreign exchange costs, order types, and market rules in addition to industry logic. Through Biya, you can follow U.S. stocks, Hong Kong stocks, and digital asset trading scenarios, while using U.S. stock information search to check semiconductor-related tickers. U.S. stock trading costs usually include more than commissions. They may also include platform fees, external institution fees, trading activity fees, and foreign exchange costs. Biya U.S. stock trading fees show that U.S. stock trading commission is $0, while platform fees, external institution fees, and other costs are subject to the fee schedule and order page. The information above only introduces public market information, trading rules, and fee structures, and does not constitute investment advice. Service availability depends on the user’s location, identity verification results, platform rules, and applicable laws and regulations.
You can also build a monthly monitoring table: for Nvidia, track data center revenue and gross margin; for TSMC, track advanced-process revenue and CAPEX; for ASML, track net bookings and EUV deliveries; for Samsung and Micron, track DRAM, NAND, and HBM pricing; for ETFs, track flows and constituent concentration. As long as these indicators do not weaken together, a sector pullback is more likely a valuation and positioning issue. If they weaken at the same time, the semiconductor cycle needs to be reassessed.
Summary: Semiconductor linkage risk should be tracked through both the industry chain and the trading structure. The industry chain tells you whether demand, capacity, equipment, and pricing are healthy. The trading structure tells you whether ETFs, options, and crowded positioning are amplifying volatility. You should first identify where a company sits in the chain, then judge whether the decline comes from fundamentals or capital flows. This approach is closer to real risk than simply tracking one-day price changes.
If you are watching Samsung, TSMC, ASML, Nvidia, Micron, AMD, Broadcom, or semiconductor ETFs, do not only ask how much chip stocks fell today. Ask whether the decline has changed the long-term assumptions around AI demand, advanced processes, equipment orders, and memory prices. Biya is a global multi-asset trading wallet that supports U.S. stocks, Hong Kong stocks, and digital asset trading, as well as USDT conversion into major fiat currencies such as U.S. dollars and Hong Kong dollars. If the relevant services are available in your region, you can use account registration to check service availability, identity verification requirements, and order fees. Before trading, you should fully understand the asset’s volatility, fee structure, order types, and local regulatory requirements.
FAQ
Does a Semiconductor Sector Sell-Off Mean the Industry Cycle Has Reversed?
A semiconductor sector sell-off does not necessarily mean the industry cycle has reversed. You need to check whether orders, inventories, prices, CAPEX, and management guidance are weakening at the same time. If the move is driven mainly by valuation compression, ETF outflows, or profit-taking, it may be closer to a sentiment-driven decline or a temporary reset.
Why Can Samsung’s Earnings Affect U.S. Chip Stocks?
Samsung’s earnings can affect U.S. chip stocks because Samsung is an important global supplier of memory chips and AI memory. Its results and guidance influence market expectations for DRAM, NAND, HBM prices, and AI server memory demand.
Why Are TSMC and ASML Linked?
TSMC and ASML are linked because TSMC’s capacity expansion requires ASML’s EUV and DUV equipment. If TSMC raises CAPEX, the market usually reassesses ASML’s order outlook. If TSMC demand slows, equipment stocks can also come under pressure.
Why Can Nvidia’s Decline Drag Down the Broader Chip Sector?
Nvidia’s decline can drag down the broader chip sector because it represents AI compute demand and market risk appetite. Nvidia’s data center revenue, gross margin, and supply-chain changes can affect valuations for TSMC, HBM suppliers, servers, networking equipment, and semiconductor ETFs.
Can Semiconductor ETFs Diversify Single-Stock Chip Risk?
Semiconductor ETFs can diversify single-company risk, but they cannot eliminate synchronized sector sell-off risk. If an ETF is heavily concentrated in leaders such as Nvidia, TSMC, Broadcom, or ASML, it can still experience significant volatility during a sector pullback.
How Can Retail Investors Track Semiconductor Linkage Risk?
Retail investors can track AI chip orders, TSMC CAPEX, ASML orders, memory prices, semiconductor ETF flows, and earnings guidance from leading companies. These indicators are more useful than one-day price moves when judging whether sector risk is truly deteriorating.
*This article is provided for general information purposes and does not constitute legal, tax or other professional advice from BiyaPay or its subsidiaries and its affiliates, and it is not intended as a substitute for obtaining advice from a financial advisor or any other professional.
We make no representations, warranties or warranties, express or implied, as to the accuracy, completeness or timeliness of the contents of this publication.
Related Blogs of

Under the IBM Shock, Which Has the Highest Enterprise IT Budget Exposure: NOW, CRM, ADBE, or ORCL? A Risk Ranking


What Does ASML’s Guidance Upgrade Mean for TSMC, Nvidia, and U.S. Semiconductor Equipment Stocks?


ASML Q2 2026 Earnings Analysis: What Signals Did Orders, EUV Demand, and Full-Year Guidance Release?

Will PayPal Accept Stripe’s Offer? Three Major Obstacles: Board Approval, Financing, and Regulation

Choose Country or Region to Read Local Blog
 Australia
 Austria
 Belgium
 Canada
 Cyprus
 Czech Republic
 Denmark
 Estonia
 Finland
 France
 Germany
 Greece
 Hong Kong
 India
India Indonesia
 Ireland
 Italy
Italy Japan
Japan Latvia
 Lithuania
 Luxembourg
 Malaysia
 Malta
Malta Morocco
 Nepal
Nepal Netherlands
 New Zealand
 Norway
 Pakistan
 Philippines
 Poland
 Portugal
 Romania
 Singapore
 Slovakia
 Slovenia
 South Africa
 South Korea
 Spain
Spain Sweden
 Thailand
 United States
 Turkey
 United Arab Emirates
 United Kingdom
 Vietnam
Contact Us



