
How to Tell Western Digital (WDC) and Sandisk (SNDK) Apart After the Spin-Off: HDD vs NAND




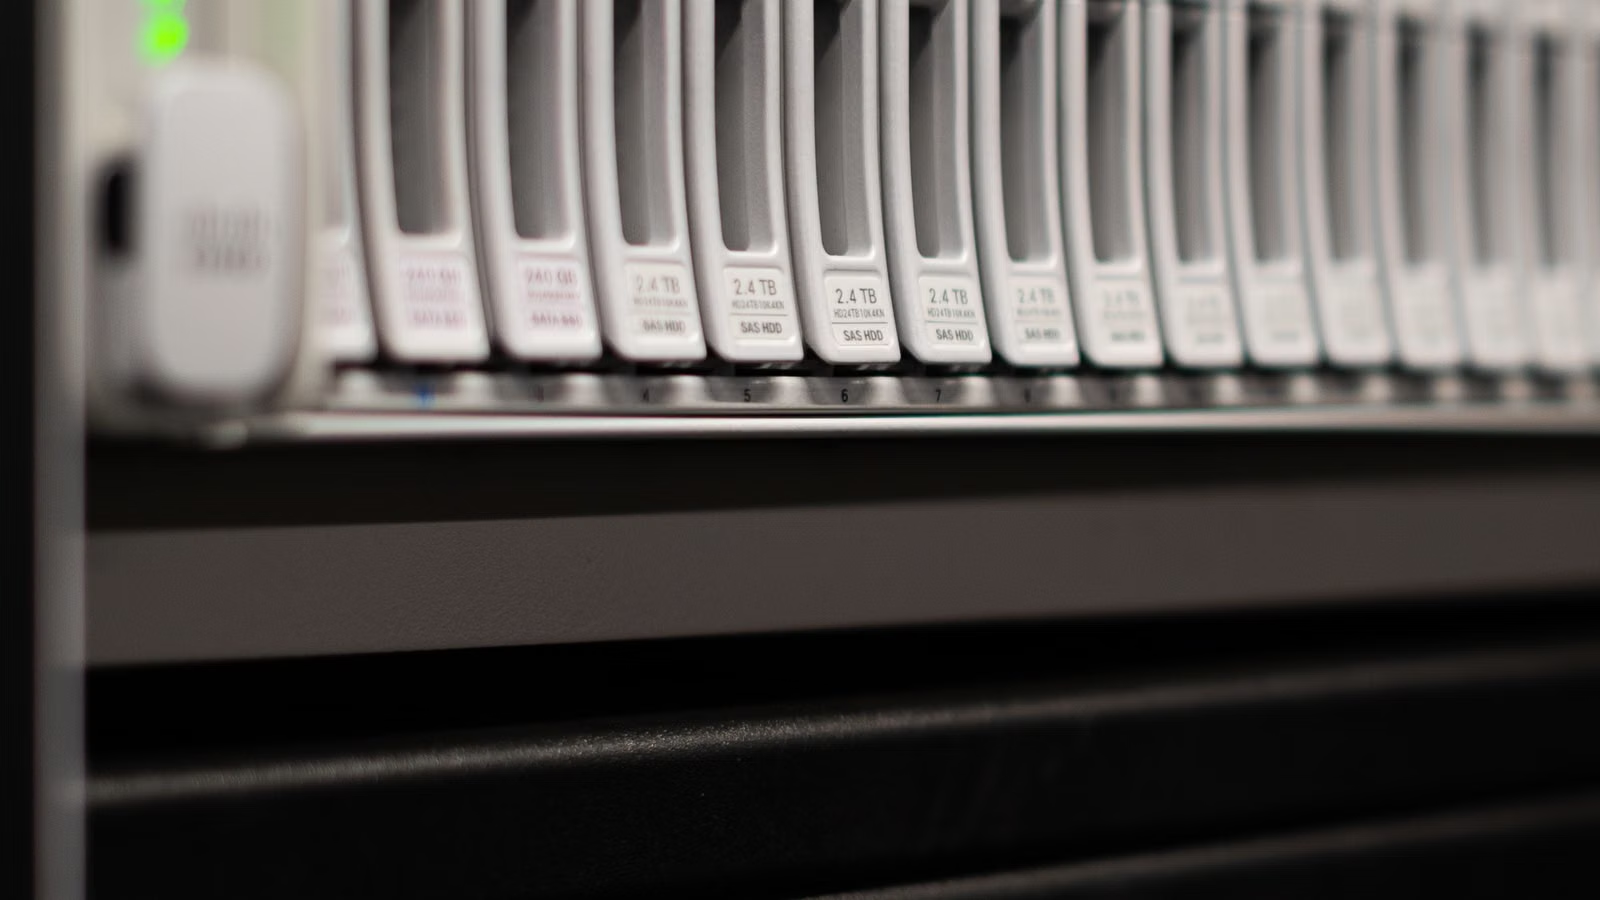
After the spin-off, the easiest way to distinguish Western Digital (WDC) from Sandisk (SNDK) is this: WDC is now more of a high-capacity HDD data-center storage company, while SNDK is more of a NAND Flash and SSD cycle company. You should no longer treat both stocks as the same generic “storage stock.” WDC’s key variables are AI data centers, cloud customers, nearline HDDs, capacity cost, and long-term supply-demand dynamics. SNDK’s key variables are NAND pricing, enterprise SSD demand, advanced flash technology, and storage-cycle upside.
Key Takeaways
- WDC’s post-spin story is HDD-driven, with cloud data-center capacity demand at the center.
- SNDK’s standalone story is NAND-driven, with flash pricing and SSD adoption as key variables.
- HDD is more about capacity economics, while NAND is more about performance, latency, and cycle leverage.
- AI can benefit both companies, but their exposure points and risks are different.
- Comparing WDC and SNDK requires separating technology roadmaps, financial metrics, and valuation expectations.
What Is the Core Difference Between WDC and SNDK After the Spin-Off?
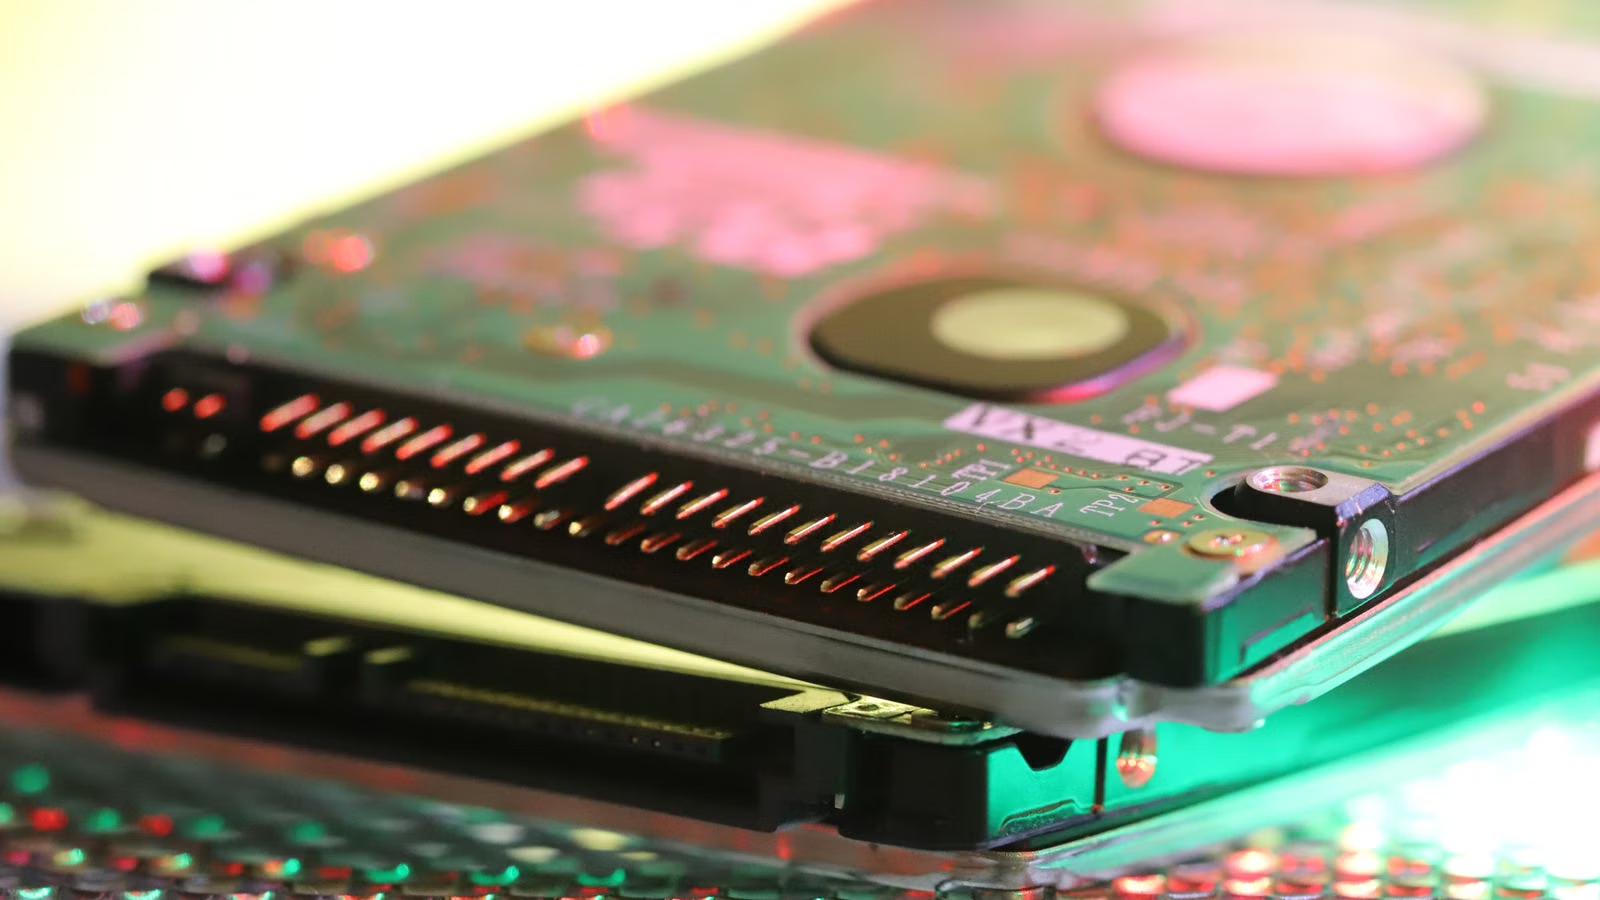
The core difference after the spin-off is that WDC retained the hard drive business, while SNDK took on the flash business. When you look at WDC, you are mainly looking at HDDs, cloud storage, and the capacity layer of data centers. When you look at SNDK, you are mainly looking at NAND Flash, SSDs, and the advanced flash memory cycle. The separation turned two business lines inside one group into two public companies with different stock drivers.
Western Digital announced in February 2025 that it had completed the separation of its Flash business. After the separation, Western Digital continued to trade under the ticker WDC, with its business focus moving toward HDDs, high-capacity storage, and data-center customers. Sandisk also announced that it had separated from Western Digital and started trading independently on Nasdaq under the ticker SNDK.
At the company level, the main benefit of the spin-off is clarity. Before the separation, WDC included both HDD and Flash operations, making it hard for investors to decide whether the company should be valued as a hard drive cycle stock, a NAND cycle stock, or a hybrid storage business. After the spin-off, WDC can be valued more directly around HDD supply-demand, cloud customer orders, margins, and free cash flow. SNDK can be valued more directly around NAND pricing, enterprise SSDs, product mix, and advanced process technology.
At the shareholder level, Nasdaq disclosed that for every 1 share of WDC, shareholders received 0.33333 share of Sandisk common stock. That ratio is not the main factor for judging the two companies’ future performance. The more important point is that, after the spin-off, their financial statements are no longer blended together, and the market can reprice them using different cycles and valuation frameworks.
| Comparison Item | WDC | SNDK |
|---|---|---|
| Post-spin positioning | HDD and data-center capacity storage | NAND Flash and SSDs |
| Ticker | WDC | SNDK |
| Core products | Nearline HDDs, enterprise HDDs, high-capacity hard drives | 3D NAND, TLC, QLC, enterprise SSDs |
| Main customers | Cloud providers, data centers, enterprise storage customers | Cloud customers, enterprise SSD buyers, edge devices, consumer electronics |
| Key variables | HDD supply-demand, TCO, long-term contracts, cash flow | NAND ASP, SSD demand, inventory cycle, advanced process nodes |
| Investment label | AI data-center capacity layer | Flash memory cycle in the AI era |
Summary: After the spin-off, WDC and SNDK should no longer be treated as the same type of storage stock. WDC is more like a data-center HDD infrastructure company. Its core question is whether AI and cloud providers will continue to drive demand for high-capacity hard drives. SNDK is more like a NAND / SSD cycle company. Its core question is whether flash pricing, enterprise SSD demand, and advanced NAND technology can sustain earnings leverage. When comparing the two, your first step is not to ask which stock has risen more, but to decide whether you are analyzing the HDD capacity cycle or the NAND performance and pricing cycle.
What Is the Difference Between HDD and NAND?
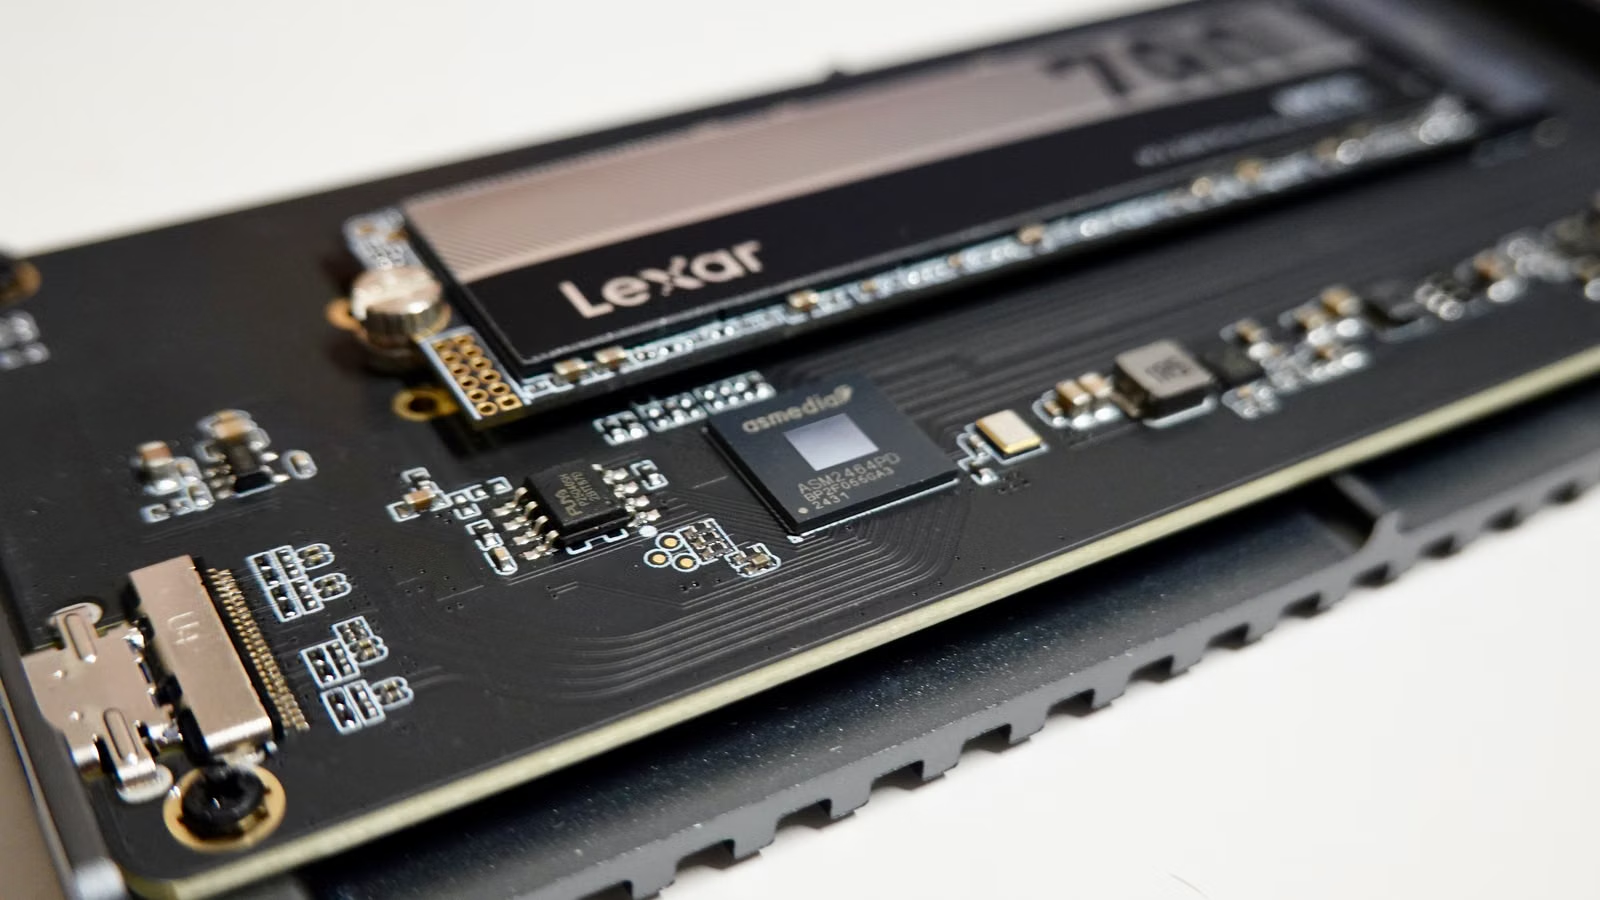
The difference between HDD and NAND is essentially the difference between capacity cost and access performance. HDDs are better suited to large-scale, long-term, cost-sensitive data storage. NAND / SSDs are better suited to low-latency, high-IOPS, high-performance read and write workloads. When comparing WDC and SNDK, the right question is not simply “which one benefits from AI,” but where AI workloads place their data within the storage hierarchy.
HDDs are mechanical storage devices. Their main advantage is cost per terabyte and large-scale capacity. AI training data, inference logs, video and image assets, data lakes, backup archives, object storage, and warm or cold data all need to be stored for long periods. Western Digital has discussed tiered storage by noting that HDDs still account for nearly 80% of capacity in hyperscale data environments. The reason is not that HDDs are faster than SSDs, but that they often offer better TCO at massive data scale.
NAND Flash is non-volatile semiconductor storage. SSDs combine NAND chips, controllers, firmware, and interfaces to deliver high-speed access. Their advantage is not simply “large capacity,” but speed, latency, power efficiency, physical footprint, and random read/write performance. AI servers, databases, model loading, retrieval-augmented generation, online inference, cache layers, and high-performance enterprise applications are more likely to use SSDs or all-flash architectures.
This is why the investment logic for WDC and SNDK has separated. The key question for WDC is whether HDDs can maintain their position as the capacity layer in the AI data explosion. The key question for SNDK is whether rising NAND prices, enterprise SSD adoption, and advanced process upgrades can translate revenue growth into profit growth. Both companies are part of the AI storage chain, but they sit in different value layers.
| Dimension | HDD | NAND / SSD |
|---|---|---|
| Core advantage | Low cost per unit of capacity; suitable for massive data | Low latency, high performance, strong random read/write |
| Main uses | Data lakes, backup, archives, object storage, warm and cold data | Enterprise SSDs, hot data, model loading, databases |
| Key metrics | Cost per TB, exabyte shipments, nearline HDD demand | NAND ASP, bit growth, SSD shipments |
| Technology constraints | Mechanical structure, power use, density improvements | Cost, endurance, process technology, capital intensity |
| Related companies | WDC, Seagate, Toshiba | SNDK, Micron, Samsung, SK hynix, Kioxia |
AI will not simply eliminate HDDs, and it will not make NAND prices rise forever. A more realistic outcome is tiered storage inside data centers: hot data and performance-sensitive workloads go to SSDs; massive long-term datasets go to HDDs; extremely cold data may move to even lower-cost media. The more AI grows, the more important storage tiering becomes. It does not mean all data will be placed on one type of storage.
Summary: HDD and NAND are not simple substitutes; they are complementary storage layers. HDDs solve the problem of storing more data at lower cost, while NAND / SSDs solve the problem of accessing and processing data faster. WDC’s value comes from the role of HDDs in the capacity layer of AI data centers. SNDK’s value comes from the role of NAND Flash in high-performance storage and SSD markets. Comparing WDC and SNDK is essentially comparing capacity economics with performance economics.
Why Does WDC Look More Like an AI Data-Center HDD Company After the Spin-Off?

After the spin-off, WDC’s core story is that it has become a more focused HDD company. AI data centers need to store training data, inference logs, user-generated content, model versions, and enterprise data assets. Rising demand from cloud providers for high-capacity nearline HDDs makes WDC’s revenue, margins, and cash flow more directly exposed to the data-center expansion cycle.
WDC’s latest results already show this shift. Its fiscal Q3 2026 results reported revenue of $3.337 billion, up 45% year over year; GAAP gross margin of 50.2%; non-GAAP gross margin of 50.5%; operating cash flow of $1.12 billion; and free cash flow of $978 million. For an HDD-focused company, gross margin above 50% indicates a strong combination of supply-demand conditions and product mix.
The market is paying attention to WDC not simply because it sells hard drives, but because AI has brought hard drives back into the discussion as a core layer of data-center infrastructure. Reuters reported that WDC’s next-quarter revenue forecast came in above Wall Street expectations, driven by AI storage demand and stronger demand for high-capacity hard drives. After separating the Flash business, WDC’s narrative is also more focused: it no longer needs to explain the NAND cycle at the same time, and can instead focus on the long-term position of HDDs in cloud and AI environments.
The technology roadmap also matters. At its 2026 Innovation Day, WDC said that its 40TB UltraSMR ePMR HDD had entered qualification with two hyperscale customers, with volume production planned for the second half of 2026. Its HAMR HDDs were also in qualification with two hyperscale customers, with volume ramp planned for 2027 and a roadmap toward 100TB+. This means WDC’s competitive focus is not consumer hard drives, but enterprise-grade HDDs that deliver high capacity, low TCO, and hyperscale deployability.
| WDC Monitoring Dimension | Key Question |
|---|---|
| Demand | Are cloud providers and AI data centers still increasing high-capacity HDD purchases? |
| Pricing | Can HDD ASPs remain strong, and do long-term contracts improve revenue visibility? |
| Technology | Are ePMR, UltraSMR, HAMR, and the 100TB+ roadmap progressing as planned? |
| Financials | Are gross margin, free cash flow, dividends, buybacks, and debt improving? |
| Risks | Could cloud CAPEX slow, customer concentration rise, or technology transitions be delayed? |
WDC’s advantage is that AI-driven data growth has long-term characteristics. Generative AI, video models, enterprise knowledge bases, inference logs, and compliance retention all create massive amounts of data that need to be stored. Its risk is also concentration: if large cloud customers slow capital spending, delay projects, or renegotiate long-term purchasing arrangements, WDC’s revenue leverage could change quickly.
Summary: WDC looks more like an AI data-center HDD company after the spin-off not because HDDs have suddenly become high-performance chips, but because AI keeps expanding demand for data capacity. High-capacity HDDs still have a role in cost per terabyte, large-scale deployment, and long-term data retention. When analyzing WDC, you should focus on cloud customer demand, nearline HDD shipments, gross margin, free cash flow, and the HAMR roadmap instead of using NAND or consumer electronics logic.
Why Does SNDK Look More Like a NAND Flash Cycle Stock After the Spin-Off?
SNDK’s core story after the spin-off is that it has become a clearer NAND Flash and SSD stock. When you analyze SNDK, the focus is not HDD capacity demand, but NAND pricing, data-center revenue, enterprise SSD adoption, advanced 3D NAND technology, and product mix. During an upcycle in flash memory, SNDK may show stronger revenue and margin leverage. During a downturn, inventory pressure and price declines may also appear more quickly in its results.
Sandisk’s fiscal Q3 2026 results reported revenue of $5.95 billion, up 97% sequentially and 251% year over year, with GAAP gross margin of 78.4%. By end market, Datacenter revenue was $1.467 billion, up 233% sequentially and 645% year over year; Edge revenue was $3.663 billion; and Consumer revenue was $820 million. These numbers show a clear change in both cycle position and customer mix, with AI and data-center demand raising the value of high-performance storage.
SNDK’s logic is closer to “pricing + technology + product mix.” When NAND prices rise, the same bit shipments can generate higher revenue. When enterprise SSDs become a larger share of the business, margins and customer quality may improve. When advanced process technology advances, unit cost, density, and power efficiency affect long-term competitiveness. Compared with WDC, SNDK may offer stronger upside during an upcycle, but it is also more sensitive to NAND ASPs, inventories, and competitor capacity additions.
On technology, Sandisk announced in July 2026 that its BiCS10 1Tb TLC 3D NAND had begun sampling. The company said BiCS10 TLC can reach NAND interface speeds of up to 4.8Gb/s, improve bit density by 59% compared with BiCS8, and reduce input and output power consumption. For SNDK, this type of roadmap is not just a branding point. It directly affects competitiveness in enterprise SSDs, data-intensive applications, and AI storage workloads.
| SNDK Monitoring Dimension | Key Question |
|---|---|
| Cycle | Are NAND ASPs still rising, and are inventories healthy? |
| Products | Are enterprise SSDs, TLC, QLC, and BiCS10 improving product mix? |
| Customers | Are AI infrastructure, cloud, edge, and consumer demand all improving? |
| Financials | Are margins, operating profit, EPS, and cash flow sustainable? |
| Risks | Could NAND prices reverse, competitors expand capacity, or customer orders fluctuate? |
SNDK, Micron, Samsung, SK hynix, and Kioxia are all affected by NAND industry supply-demand. But after becoming independent, SNDK is a more direct window into Flash. You can think of it this way: if you are bullish on NAND pricing, SSD demand, and advanced NAND technology, SNDK gives you a more direct exposure. If you are worried that flash pricing has become overheated, SNDK’s volatility may also be more direct.
Summary: SNDK looks more like a NAND Flash cycle stock after the spin-off because its key variables are concentrated in flash pricing, SSD demand, customer mix, and the advanced 3D NAND roadmap. It may show stronger earnings leverage during an upcycle, but it is also more exposed to price reversals, inventory corrections, and competitive capacity expansion. When analyzing SNDK, you should look beyond the broad label of “AI storage” and keep tracking NAND ASPs, data-center revenue, enterprise SSD demand, and the BiCS roadmap.
How Should Ordinary Investors Compare WDC and SNDK?
Ordinary investors should first decide which storage cycle they want exposure to. WDC is more exposed to the HDD capacity cycle, making it more relevant to cloud data centers, AI data retention, long-term contracts, and cash flow. SNDK is more exposed to the NAND pricing cycle, making it more relevant to enterprise SSDs, flash supply-demand, advanced process technology, and margin leverage. Both can benefit from AI, but they do not offer the same risk-reward profile.
The first layer of comparison is demand source. WDC benefits from high-capacity HDD purchases by cloud providers and hyperscalers, so its logic is closer to data-center infrastructure. SNDK benefits from NAND Flash and SSD demand, so its logic is closer to the semiconductor pricing cycle. One asks: how much data needs to be stored, for how long, and at what cost per terabyte? The other asks: how fast does the data need to be accessed, how low must latency be, and how much performance is required?
The second layer is financial metrics. For WDC, you should track nearline HDD shipments, HDD ASPs, gross margin, free cash flow, buybacks, and debt. For SNDK, you should track Datacenter / Edge / Consumer revenue mix, NAND pricing, SSD adoption, gross margin, and inventories. Do not look only at one quarter of revenue growth, because storage price cycles can make short-term profit swings unusually large.
The third layer is valuation. WDC and SNDK may rise at the same time within the AI storage trade, and they may also fall together when the sector takes profits. But valuation resets can happen for different reasons. WDC is more vulnerable to a slowdown in cloud CAPEX or easing HDD supply-demand. SNDK is more vulnerable to NAND prices peaking, excessive inventory replenishment, or competitor capacity expansion. You need to separate a strong business trend from a stock price that may already reflect that trend.
| Comparison Dimension | More Important for WDC | More Important for SNDK |
|---|---|---|
| Demand source | AI data retention and cloud storage capacity | Enterprise SSDs, AI servers, edge and consumer electronics |
| Core metrics | HDD ASPs, exabyte shipments, free cash flow | NAND ASPs, data-center revenue, SSD shipments |
| Profit leverage | High-capacity HDD mix and supply discipline | NAND pricing and high-value customer mix |
| Technology roadmap | ePMR, UltraSMR, HAMR, 100TB+ | BiCS, 3D NAND, TLC, QLC |
| Main risks | Cloud CAPEX slowdown, customer concentration, technology delays | NAND downcycle, inventory reversal, price competition |
If you are following popular U.S. storage stocks, trading costs and volatility should also be part of the same decision process. WDC and SNDK can both move sharply around earnings, AI CAPEX expectations, industry pricing, and sector sentiment. When using a multi-asset trading wallet such as Biya to follow U.S. equities, you should look not only at stock prices and earnings, but also at order costs, execution details, and applicable rules. U.S. stock trading fees show that Biya charges $0 commission for U.S. stock trades, while platform fees, external agency fees, and other costs are subject to the fee center and order display. For fractional-share orders below one share, the actual fee should also be confirmed on the order screen.
Summary: Comparing WDC and SNDK is not about asking which stock is definitely better. It is about deciding which variable you want exposure to. WDC is better analyzed through AI data-center capacity, HDD supply-demand, and cash flow. SNDK is better analyzed through NAND pricing, enterprise SSD demand, and advanced process technology. At the trading level, valuation, volatility, fees, and personal risk tolerance also matter. A single quarter of earnings or a short-term price move should not be the only basis for judgment.
What Are the Main Risks After the Spin-Off?
The spin-off makes WDC and SNDK easier to understand, but it does not remove cyclicality. WDC’s risks come from HDD supply-demand, cloud customer concentration, and execution of its technology roadmap. SNDK’s risks come from NAND price reversals, inventory cycles, and competitive capacity expansion. Both companies may benefit from AI storage enthusiasm, but when market expectations become too high, even strong earnings can lead to volatility.
WDC’s first risk is cloud customer demand. AI data centers require large amounts of high-capacity HDD storage, but cloud CAPEX does not move in a straight line. If major customers slow purchases, delay projects, or renegotiate long-term contracts, WDC’s revenue visibility and pricing power could be affected. The second risk is technology execution. If 40TB UltraSMR, ePMR, HAMR, or the 100TB+ roadmap faces production delays, market confidence in future capacity density improvements may weaken.
SNDK’s first risk is the strong cyclicality of NAND. When NAND prices rise, SNDK’s gross margin can expand quickly. When prices fall, inventory write-downs, customer order cuts, and margin compression can also appear quickly. The second risk is competition. Samsung, SK hynix, Micron, and Kioxia are all pushing advanced NAND and enterprise SSDs. If supply growth exceeds demand, pricing pressure can return.
The shared risk is an overcrowded AI storage trade. WDC, SNDK, Seagate, Micron, and other storage names may be grouped together by the market as AI infrastructure stocks. When capital flows into the theme, valuations can price in years of growth in advance. When expectations around AI ROI, data-center power availability, cloud CAPEX, or semiconductor sentiment change, these stocks may also pull back together. Reuters also noted that WDC is more focused on data centers after the spin-off, but the market can still reassess both above-consensus quarterly revenue guidance and prior share-price gains.
| Risk Category | How It Affects WDC | How It Affects SNDK |
|---|---|---|
| Demand risk | Cloud CAPEX slows and HDD orders decline | Enterprise SSD and consumer electronics demand weakens |
| Pricing risk | HDD ASPs fall or long-term contracts are renegotiated | NAND ASPs decline and inventory pressure rises |
| Technology risk | HAMR / UltraSMR progress disappoints | BiCS10 ramp or cost improvements fall short |
| Competition risk | Seagate and Toshiba compete on capacity roadmaps | Samsung, Micron, SK hynix, and Kioxia expand supply |
| Market risk | AI storage valuation becomes overheated | NAND cycle trade becomes crowded |
Summary: After the spin-off, WDC and SNDK can be priced more directly, but each company is also more exposed to its own cycle. WDC’s key risks are HDD demand, cloud customer procurement, and technology execution. SNDK’s key risks are NAND pricing, inventories, and competitive capacity expansion. When analyzing the two companies, you should separate business trends, financial quality, cycle position, and market expectations. Strong AI storage demand does not automatically mean there is no stock-price risk.
How Should You Put WDC and SNDK on Your Watchlist?
WDC and SNDK can both sit on an AI storage watchlist, but they should carry different labels. WDC should be labeled as “AI data-center capacity layer and HDD supply-demand.” SNDK should be labeled as “NAND Flash, enterprise SSDs, and flash pricing cycle.” If you are new to the space, building a tracking framework is more useful than rushing into a buy-or-sell judgment.
For WDC, you can track five metrics each quarter: revenue growth, gross margin, free cash flow, nearline HDD shipments, and technology roadmap progress. You should also watch cloud CAPEX, AI data-center buildouts, and Seagate’s earnings signals. The HDD industry is relatively concentrated, so peer results can help you judge whether the industry remains tight.
For SNDK, you can track five metrics each quarter: NAND ASPs, data-center revenue, enterprise SSD demand, Edge / Consumer mix, and BiCS technology progress. You should also watch the supply strategies of Micron, Samsung, SK hynix, and Kioxia. When NAND enters an expansion phase and prices start falling, it is difficult for any single company to fully escape the industry cycle.
You can also place WDC, SNDK, and other storage stocks into one comparison table. Compare WDC with Seagate for HDD exposure. Compare SNDK with Micron for NAND exposure. Pure Storage, NetApp, Dell, and HPE are more related to enterprise storage systems and solutions. This approach helps prevent you from mixing up “storage chips,” “hard drive makers,” and “enterprise storage systems” as if they were the same category.
| Your Focus | Prioritize | Why |
|---|---|---|
| Long-term AI data retention | WDC | HDDs are one of the core assets in the capacity layer |
| Enterprise SSDs and high-speed storage | SNDK | NAND / SSDs are more sensitive to performance and latency |
| Semiconductor pricing cycle | SNDK | NAND ASPs and inventory changes are more important |
| Free cash flow and buybacks | WDC | HDD supply-demand and long-term customers matter more |
| Data-center TCO | WDC | Cost per TB and capacity density are more important |
| Flash technology upgrades | SNDK | BiCS, TLC, QLC, and controller roadmaps are more direct |
Summary: WDC and SNDK should not be tracked under the same label. WDC is the AI data-center capacity layer, so you should follow HDD supply-demand, cloud customers, gross margin, and free cash flow. SNDK is the NAND / SSD cycle exposure, so you should follow flash pricing, enterprise SSDs, data-center revenue, and advanced NAND roadmaps. When building a watchlist, separate the company, storage medium, customer scenario, and financial metrics. That is the best way to avoid being misled by the broad label of “AI storage.”
When tracking WDC, SNDK, MU, STX, and other U.S.-listed storage companies, you can put earnings dates, stock volatility, industry pricing, fee structures, and trade records into one workflow. U.S. stock information search can help with early screening of companies and tickers, while order costs and risk disclosures should be reviewed before trading. Biya supports U.S. stocks, Hong Kong stocks, digital assets, and multi-asset trading, and also supports payments in more than 40 local currencies. Service availability depends on the user’s location, identity verification result, platform rules, and applicable laws and regulations. Public market information and fee structures can help with preparation, but they do not replace independent judgment. For further use, Download App provides access to account, order, and applicable rule details.
FAQ
Are WDC and SNDK still the same company after the spin-off?
No. WDC and SNDK are now two separate listed companies after the spin-off. WDC retained the hard drive and data-center capacity storage business, while SNDK took on the NAND Flash and SSD business. Their financial statements, valuation logic, and risks should be analyzed separately.
Why is WDC still considered an AI storage stock after spinning off SNDK?
WDC is still considered an AI storage stock because AI data centers need large-capacity HDDs to store training data, inference logs, backups, and object storage. Its AI exposure is not about high-performance chips, but about capacity, TCO, long-term procurement, and cloud customer demand. Any judgment should still be based on financial reports and industry supply-demand.
How is SNDK different from Micron’s NAND business?
SNDK is a more direct standalone NAND / Flash exposure, while Micron includes DRAM, HBM, and NAND. When comparing the two, you should separate product mix, AI exposure, pricing cycles, and customer structure. SNDK is more directly tied to the NAND and SSD cycle, while Micron is also affected by DRAM and HBM.
Will HDD and NAND replace each other in AI data centers?
No, HDD and NAND are unlikely to simply replace each other. NAND / SSDs are better for low-latency, high-performance access, while HDDs are better for large-capacity, long-term, cost-sensitive storage. AI data centers usually use tiered storage rather than placing all data on one medium. The actual configuration depends on performance, cost, and the data lifecycle.
What should ordinary investors look at first when comparing WDC and SNDK?
Ordinary investors should first identify the different business drivers. For WDC, focus on HDD supply-demand, cloud customers, gross margin, and free cash flow. For SNDK, focus on NAND pricing, enterprise SSDs, data-center revenue, and inventory cycles. Valuation, trading fees, and personal risk tolerance should also be considered.
Which is riskier, WDC or SNDK?
The risk types are different, so one is not automatically riskier than the other. WDC is more exposed to cloud CAPEX slowdowns, HDD supply-demand reversals, and technology roadmap delays. SNDK is more exposed to NAND price declines, excessive inventory rebuilding, and competitive capacity expansion. Any trade should be based on public filings, platform rules, and personal risk tolerance.
*This article is provided for general information purposes and does not constitute legal, tax or other professional advice from BiyaPay or its subsidiaries and its affiliates, and it is not intended as a substitute for obtaining advice from a financial advisor or any other professional.
We make no representations, warranties or warranties, express or implied, as to the accuracy, completeness or timeliness of the contents of this publication.
Related Blogs of

Binance Hot Wallet Outflows: User Funds, Loss Coverage, and Withdrawal Updates


Best Crypto Apps for Beginners: Fees, Security, and Ease of Use


Crypto Off-Ramp Services vs. Exchanges: Fees, Payouts, and Trade-Offs


Choose Country or Region to Read Local Blog
 Australia
 Austria
 Belgium
 Canada
 Cyprus
 Czech Republic
 Denmark
 Estonia
 Finland
 France
 Germany
 Greece
 Hong Kong
 India
 Indonesia
 Ireland
 Italy
 Japan
 Latvia
 Lithuania
 Luxembourg
 Malaysia
 Malta
 Morocco
 Nepal
 Netherlands
 New Zealand
 Norway
 Pakistan
 Philippines
 Poland
 Portugal
 Romania
 Singapore
 Slovakia
 Slovenia
 South Africa
 South Korea
 Spain
 Sweden
 Thailand
 United States
 Turkey
 United Arab Emirates
 United Kingdom
 Vietnam