
Micron MU vs NVIDIA NVDA: How Are the Investment Logic of AI Chips and AI Storage Different?





Micron MU and NVIDIA NVDA are both important companies in the AI supply chain, but you should not compare them using the same framework. NVDA is primarily an AI compute platform, with revenue leverage coming from GPUs, AI systems, networking, the CUDA ecosystem, and AI factory buildouts. MU is primarily an AI storage cycle company, with revenue leverage coming from HBM, DRAM, NAND, data center SSDs, and the memory pricing cycle. In simple terms, NVDA represents the “AI compute gateway,” while MU represents “AI memory and storage leverage.”
Key Takeaways:
- NVDA is an AI chip platform story, while MU is an AI storage cycle story.
- NVDA depends more on Data Center revenue; MU depends more on HBM, DRAM, and NAND.
- NVDA is valued more like a platform growth company; MU is more affected by the memory cycle.
- NVDA’s risks center on competition and expectations; MU’s risks center on pricing and supply.
- Both benefit from AI capex, but their stock drivers and earnings indicators differ.
- Investors should compare revenue quality, margin sources, and cycle positioning.
MU vs NVDA: AI Compute Platform vs AI Storage Cycle
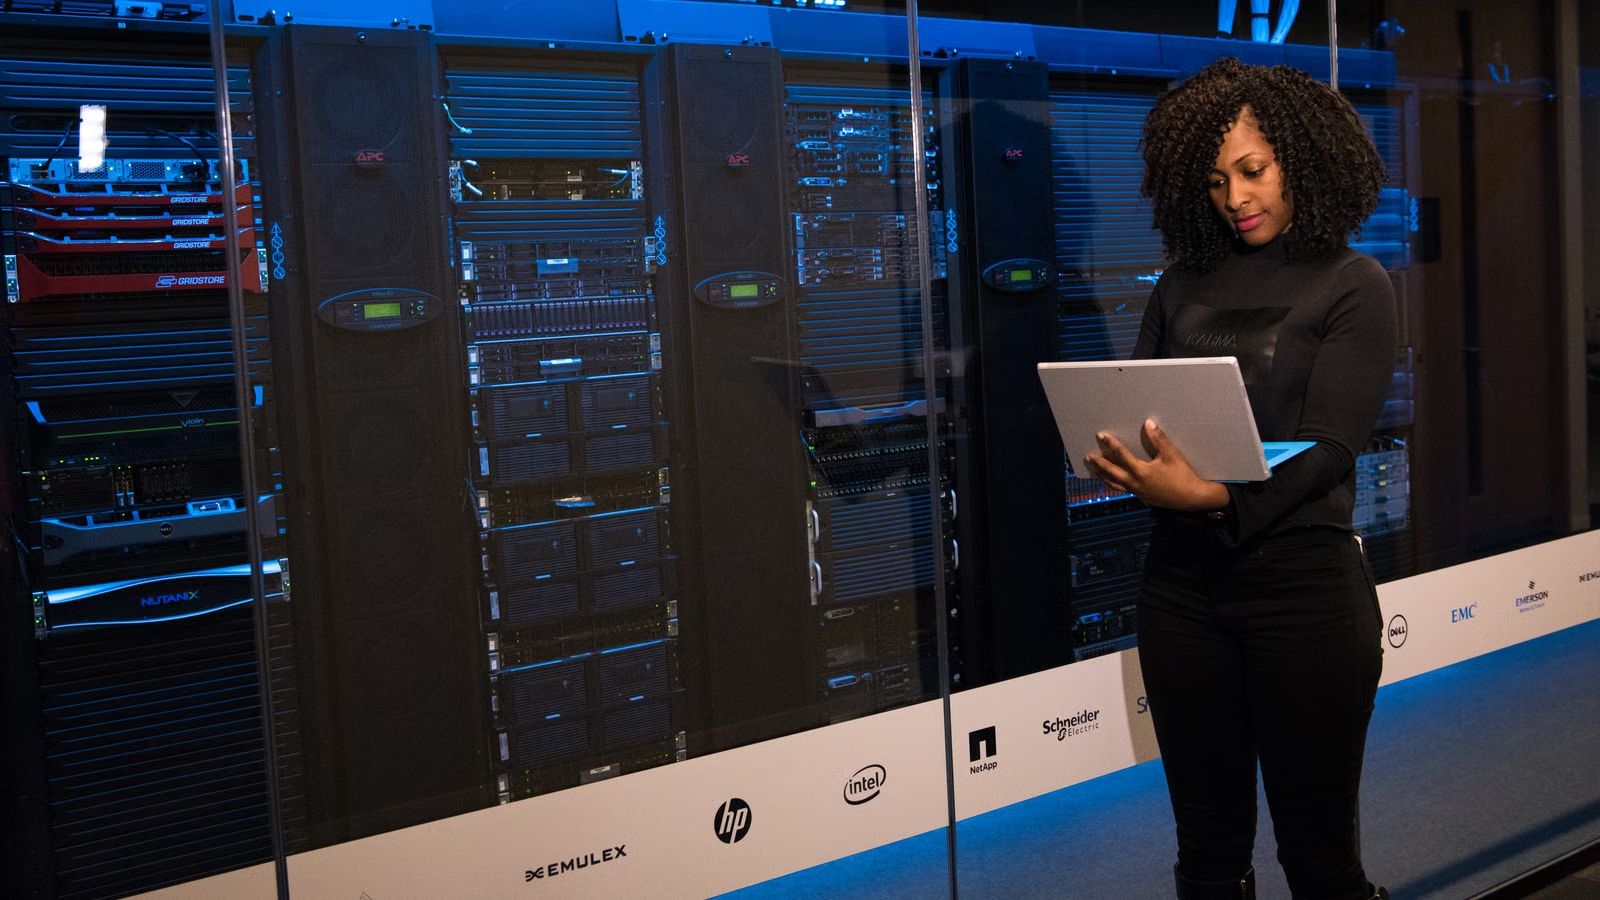
The core difference between MU and NVDA is that NVDA sells the AI compute platform, while MU provides the memory and storage required inside AI servers. When comparing the two companies, you should not only ask “which one benefits more from AI.” The more important question is how AI demand flows into each company’s financials. NVDA has a shorter transmission path: AI model demand directly turns into GPU, system, and networking orders. MU’s transmission path runs through HBM, DRAM, NAND supply-demand, and pricing cycles, which can create strong upside but also more visible cyclicality.
Why NVDA Looks More Like an AI Platform
NVIDIA is no longer just a GPU company. Today, NVDA looks more like an AI infrastructure platform company. Its core assets include data center GPUs, AI systems, networking, the CUDA ecosystem, Blackwell, Vera Rubin, and system-level solutions for AI factories. In its FY2027 Q1 financial results, NVIDIA reported quarterly revenue of $81.6 billion, with Data Center revenue reaching $75.2 billion, up 92% year over year. This shows that NVDA’s revenue structure is now heavily concentrated in AI data centers.
NVDA’s stock logic is not about whether AI exists. It is about whether AI infrastructure buildout can continue expanding, whether Blackwell, Blackwell Ultra, and Vera Rubin can keep shipping at scale, and whether hyperscalers, AI clouds, enterprises, and sovereign AI customers continue increasing capital expenditure. NVIDIA’s discussion of Blackwell Ultra further reinforces its market narrative: the company is moving from a chip supplier to an AI factory platform supplier.
Why MU Looks More Like an AI Storage Cycle
Micron’s positioning is different. MU is a memory and storage company. Its core products include HBM, DRAM, NAND, and data center SSDs. It does not directly sell AI GPUs, but AI servers cannot operate without high-bandwidth memory, server memory, SSDs, and storage components. In Fiscal Q3 2026, Micron reported revenue of $41.456 billion, including $13.769 billion from Cloud Memory Business Unit and $11.524 billion from Core Data Center Business Unit, showing that AI data center-related businesses have become core contributors.
The difference can be summarized as follows:
| Comparison Dimension | NVDA | MU |
|---|---|---|
| Core positioning | AI compute platform | AI memory and storage |
| Main products | GPUs, AI systems, networking, software ecosystem | HBM, DRAM, NAND, data center SSDs |
| Revenue driver | AI training, inference, AI factory buildout | AI server memory, HBM, enterprise SSDs |
| Key earnings indicators | Data Center revenue, gross margin, guidance | HBM revenue, ASP, bit supply, gross margin |
| Core risks | Competition, export restrictions, valuation expectations | Memory pricing, inventory, supply expansion |
Summary: MU and NVDA are both AI beneficiaries, but they are not the same type of asset. NVDA is driven by compute platformization. The market focuses on whether it can continue controlling AI accelerators, networking, software ecosystems, and system-level infrastructure. MU is driven by memory cycle repricing. The market focuses on whether HBM, DRAM, NAND, and data center SSDs remain undersupplied. NVDA’s advantage is that it sits closer to AI compute demand, making revenue leverage more direct. MU’s advantage is that when AI memory and storage supply-demand tightens, margins and earnings can expand sharply. You should not simply treat MU as a “cheaper NVDA,” nor assume that MU is automatically more attractive just because NVDA has already risen significantly. The two companies require different valuation frameworks, risk frameworks, and earnings-tracking methods.
Revenue Structure Comparison: NVDA Relies on Data Center, MU Relies on Memory and Storage Mix

NVDA has a more concentrated revenue structure, with Data Center already becoming the dominant core. MU has a more diversified revenue structure. AI-related businesses are growing rapidly, but the company still has mobile, client, automotive, and embedded exposure. This difference determines how you should read their earnings. For NVDA, the first question is whether Data Center continues to beat expectations. For MU, you need to break down Cloud Memory, Core Data Center, Mobile and Client, and Automotive and Embedded, then judge whether AI storage is contributing strongly enough to overall performance.
NVDA’s Revenue Structure Is Centered on Data Center
In NVIDIA FY2027 Q1, total quarterly revenue was $81.615 billion, Data Center revenue was $75.2 billion, Data Center compute revenue was $60.4 billion, and Data Center networking revenue was $14.8 billion. This means NVDA is no longer mainly driven by the traditional gaming GPU narrative. It is now driven by AI data centers, cloud customers, AI systems, and networking infrastructure.
The advantage of this revenue structure is directness: as long as global AI capex continues, NVDA’s financials benefit strongly. The downside is also directness: if the market starts worrying about AI data center return on investment, customer-designed chips, export restrictions, or slower growth, the stock can quickly reflect those concerns.
MU’s Revenue Structure Is More Affected by Product Mix and Cycles
MU’s revenue is also strongly driven by AI, but it is not a single-platform revenue story. According to Micron’s Fiscal Q3 2026 data, Cloud Memory revenue was $13.769 billion, Core Data Center revenue was $11.524 billion, Mobile and Client revenue was $11.521 billion, and Automotive and Embedded revenue was $4.634 billion. This means AI data center business is extremely important, but mobile, client, automotive, and embedded markets still influence total revenue.
More importantly, MU’s revenue quality also depends on product mix. Micron disclosed that HBM4 has entered high-volume shipments, HBM4E is expected to ramp into volume production in 2027, and products such as G9 PCIe Gen6 high-performance SSDs and 245TB QLC SSDs are also progressing. These high-end products improve AI storage purity, but investors still need to monitor whether they can offset volatility in traditional end markets.
| Revenue Dimension | NVDA | MU |
|---|---|---|
| Main revenue engine | Data Center | Cloud Memory + Core Data Center + terminal businesses |
| AI directness | Extremely high | High, but affected by the memory cycle |
| Revenue visibility | Depends on GPU, system orders, and customer capex | Depends on HBM orders, DRAM/NAND pricing, and customer agreements |
| Non-AI influence | Edge, PC, robotics, and gaming are relatively smaller | Mobile, Client, and Auto still matter |
| Key focus | Data Center revenue, gross margin, Q2 guidance | HBM revenue, ASP, bit shipments, gross margin |
Summary: NVDA’s revenue structure looks more like an AI infrastructure platform, while MU’s revenue structure looks more like AI storage cycle layering. NVDA’s Data Center share is extremely high, so AI capex has a more direct impact on its financials, and the market is more willing to value it as a platform growth company. MU’s AI-related businesses are also growing strongly, but it remains a memory company. Its revenue and profit are affected by DRAM, NAND, HBM, SSDs, mobile, PCs, automotive, and other variables. When comparing the two companies, you should not only look at total revenue growth. You should examine revenue stability, AI directness, product mix, and cycle sensitivity. For NVDA, the question is whether high growth can continue. For MU, the question is whether high-end memory and storage demand can outweigh cyclical volatility.
Growth Drivers: NVDA Depends on Compute Expansion, MU Depends on HBM and Storage Supply-Demand

NVDA’s growth drivers come from rising AI compute demand. MU’s growth drivers come from AI memory and improving storage supply-demand. You can view NVDA as the “front-end gateway” of AI compute expansion, and MU as the “back-end leverage” from higher memory and storage content inside AI servers. When models become larger, inference workloads grow, and data centers expand, both companies benefit. But NVDA more directly trades GPU and system orders, while MU more directly trades HBM, DRAM, NAND, and SSD pricing and shipments.
NVDA Growth Comes from AI Compute Demand Upgrades
NVDA’s growth sources include Blackwell/Rubin platform iteration, hyperscaler and AI cloud purchasing, networking, expanding inference workloads, CUDA ecosystem stickiness, and AI factories expanding from training into inference, enterprise applications, and robotics. In its coverage of NVDA’s second-quarter revenue guidance, Reuters noted that the company expected Q2 FY2027 revenue of around $91 billion, while investors had begun shifting their focus from “can it keep beating expectations” to “can AI buildout continue into 2027–2028.”
This shows that NVDA’s growth logic has entered a higher stage. The market is not only asking how many GPUs it sold. It is also asking whether the company can combine CPUs, GPUs, networking, storage infrastructure, and software stack into a complete platform. NVIDIA’s Q1 results also mentioned the Vera Rubin platform, showing that the company continues to expand the boundary of its AI system platform.
MU Growth Comes from AI Memory and Data Center SSDs
MU’s growth depends more on memory and storage supply-demand. AI accelerators need HBM. AI servers need DDR5/RDIMM. Model serving requires data center SSDs. Inference logs and caches need NAND. Data center customers can also improve visibility through long-term supply agreements. Micron’s prepared remarks noted that HBM4 12-high production is ramping faster than HBM3E 12-high, and that the company had shipped more than $1 billion of HBM4 revenue.
MU’s growth is not just about “AI excitement.” It is the combined result of AI demand, tight memory supply-demand, high-end product mix, and customer agreements. This logic can create strong upside, but if DRAM/NAND pricing reverses, customers adjust inventory, or capacity expansion exceeds demand, earnings volatility can also expand quickly.
| Transmission Chain | NVDA | MU |
|---|---|---|
| First-layer demand | AI model training and inference | AI server memory and storage capacity |
| Second-layer products | GPUs, AI systems, networking | HBM, DRAM, NAND, SSDs |
| Third-layer financial result | Data Center revenue, platform gross margin | ASP, bit shipments, margin recovery |
| Fourth-layer stock variable | Competitive landscape, order continuity, valuation | Pricing cycle, inventory, supply discipline |
| Leading indicators | Hyperscaler capex, Blackwell/Rubin shipments | HBM orders, DRAM/NAND pricing, inventory days |
Summary: NVDA is a compute expansion story, while MU is a memory and storage supply-demand story. For NVDA, the core question is whether global AI training, inference, enterprise deployment, and sovereign AI construction can continue supporting high growth in GPUs, systems, networking, and software platforms. For MU, the core question is whether demand for HBM, DRAM, and SSDs in AI servers can continue driving ASP, product mix, and margin improvement. Both companies benefit from AI capex, but they benefit at different points. NVDA stands at the front end of AI infrastructure procurement, while MU sits in the critical layer of AI server bill-of-materials expansion and storage upgrades. If you value platform growth and ecosystem barriers, NVDA is more relevant. If you value cycle leverage and AI memory revaluation, MU deserves more attention.
Gross Margin and Cyclicality: NVDA Is More Platform-Like, MU Is More Cyclical
NVDA and MU have both delivered very high gross margins, but the market interprets them differently. NVDA’s margin is more often viewed as the result of platform pricing power, GPU scarcity, software ecosystem value, and system-level solutions. MU’s margin is more often viewed as the result of rising memory prices, premium HBM product mix, tight supply-demand, and cycle recovery. Seeing high margins in both companies does not mean they deserve the same valuation logic.
NVDA Margin Comes from Platform Strength
NVIDIA’s FY2027 Q1 GAAP and non-GAAP gross margins were 74.9% and 75.0%, respectively. This level of margin is not only about higher chip pricing. It reflects GPU scarcity, the CUDA ecosystem, system-level solutions, networking value, customer switching costs, and AI platform pricing power.
However, high margins attract competition. Google TPU, Amazon Trainium, AMD Instinct, Intel, and custom ASICs will challenge NVDA’s pricing power in different workloads. NVDA’s risk is not that short-term demand disappears. The longer-term question is whether it can sustain platform share and pricing power.
MU Margin Comes from Pricing Cycles and Product Mix
Micron’s FY2026 Q3 GAAP gross margin was 84.6%, while non-GAAP gross margin was 84.9%. This is a very strong figure, but its economic meaning is different from NVDA’s. MU’s margin is more affected by HBM, DRAM, NAND pricing, product mix, and supply-demand tightness. Premium HBM, server DRAM, and data center SSDs can improve mix, but the memory industry is inherently cyclical.
If DRAM/NAND supply expands in the future, customer inventories normalize, or end-market demand falls short of expectations, MU’s margin could come under pressure more quickly. In other words, NVDA’s high margin reflects platformization, while MU’s high margin reflects a highly favorable memory cycle plus product upgrades. They should not be compared mechanically.
| Indicator | NVDA | MU |
|---|---|---|
| Margin source | GPU scarcity, platform ecosystem, system-level value | HBM/DRAM/NAND pricing and product mix |
| Sustainability test | Competition, customer-designed chips, platform stickiness | Supply expansion, inventory, ASP cycle |
| Stock sensitivity | Whether guidance continues to beat expectations | Whether ASP peaks or margin declines |
| Investor mistake | Focusing only on AI hype while ignoring competition | Focusing only on current high profit while ignoring cycles |
Summary: NVDA and MU can both post high gross margins, but the quality of those margins differs. NVDA’s margin is more like a platform margin, driven by product scarcity, ecosystem lock-in, and system-level solutions. MU’s margin is more like a cyclical margin, driven by tight memory supply-demand, AI HBM demand, and high-end product mix. The key risk for platform margins is competition and customer substitution. The key risk for cyclical margins is price reversal and supply expansion. When evaluating NVDA, you should ask whether it can maintain platform pricing power. When evaluating MU, you should ask whether memory pricing, inventory, and HBM supply-demand remain in an upward phase. High margin alone is not the conclusion. The source of margin is what determines valuation.
Risk Comparison: NVDA Fears Competition and Expectations; MU Fears Cycles and Supply
NVDA and MU risks should not be mixed together. NVDA’s main risks are not DRAM/NAND price declines. They are competition, customer-designed chips, export restrictions, slowing AI capex, and excessive valuation expectations. MU’s main risk is not GPU market share. It is memory price reversal, rising inventories, potential HBM oversupply after expansion, NAND/DRAM cycle decline, and end-market weakness. When comparing the two companies, you must first separate the risk types.
NVDA’s Core Risks
NVDA’s most important risks are platform competition and high expectations. Major cloud companies buy NVIDIA systems while also investing in their own chips. AMD, Intel, and various ASIC solutions are also competing for inference, training, and specialized workloads. Reuters’ coverage of NVDA noted that the market has begun paying attention to competition from Google, Amazon, AMD, Intel, and others, as well as whether AI buildout can continue into 2027–2028.
Export restrictions and regional revenue uncertainty can also affect NVDA. In its Q2 FY2027 outlook, NVIDIA stated that its revenue outlook did not assume Data Center compute revenue from China. For investors, this means NVDA’s risks come not only from industry demand, but also from policy, customer structure, and regional markets.
MU’s Core Risks
MU’s risks are more typical of the memory cycle. If DRAM/NAND ASPs fall, if customers adjust inventory, if HBM supply is released too quickly over the next few years, MU’s margins and valuation can come under pressure. Micron’s long-term supply agreement with GM shows that AI data center demand is tight enough to affect automotive semiconductor supply, but it also highlights the strong supply-demand swings in memory cycles.
| Risk Type | Impact on NVDA | Impact on MU |
|---|---|---|
| AI capex slowdown | Directly affects GPU and system orders | Indirectly affects HBM and server memory demand |
| Customer-designed chips | High | Medium |
| DRAM/NAND price decline | Low to medium | High |
| HBM supply expansion | Medium | High |
| Export restrictions | High | Medium |
| High valuation | High | Medium to high |
Summary: NVDA’s main risk is whether its platform share and growth durability can hold. MU’s main risk is whether pricing cycles and supply-demand balance can keep moving upward. These are two completely different frameworks. NVDA can still be volatile even with strong short-term demand if competition intensifies, customers accelerate in-house chip development, or valuation becomes too stretched. MU can still decline even with strong AI memory demand if memory supply expands, inventory adjusts, or ASPs peak. You should not group both companies under “AI stocks” and only watch share price movements. Build separate checklists. For NVDA, track Data Center revenue, gross margin, Blackwell/Rubin, competitive dynamics, and export restrictions. For MU, track HBM shipments, DRAM/NAND pricing, inventory, bit supply, and margin trends.
How Investors Should Choose: AI Chip Platform, AI Storage Leverage, or Both
If you care more about AI infrastructure platform share, ecosystem barriers, and ongoing GPU system shipments, NVDA fits your framework better. If you care more about AI memory, HBM, tight DRAM/NAND supply, and memory-cycle revaluation, MU fits your framework better. A more balanced approach is not to treat the two as simple substitutes. Place NVDA in the AI compute platform framework and MU in the AI storage cycle framework, then verify each through earnings and valuation.
When NVDA Fits Your Framework Better
If you believe AI model training, inference, agentic AI, robotics, AI factories, and sovereign AI will continue expanding, NVDA deserves close attention. Key indicators include Data Center revenue, Q2/Q3 guidance, Blackwell/Rubin shipments, networking, gross margin, hyperscaler capex, and the competitive landscape.
NVDA is more like a long-term platform growth asset. Its advantages are direct AI exposure, deep ecosystem barriers, and a broad customer base. Its downside is that market expectations are already very high. Any growth slowdown, competitive change, or policy disruption can create valuation volatility.
When MU Fits Your Framework Better
If you believe the memory and storage content inside AI servers will keep rising, HBM will remain undersupplied, and DRAM/NAND pricing will stay in an upward cycle, MU deserves close attention. Key indicators include HBM4/HBM4E, Cloud Memory, Core Data Center, data center SSDs, NAND ASP, DRAM bit supply, inventory days, and gross margin.
MU is not a cheaper substitute for NVDA. It is another AI infrastructure route. Its advantage is strong cycle leverage: AI memory demand can meaningfully improve profitability. Its weakness is that memory stocks are volatile, and pricing cycles and supply expansion can quickly change market expectations.
| Question to Monitor | NVDA | MU |
|---|---|---|
| Is AI demand still expanding? | Data Center revenue, Q2/Q3 guidance | Cloud Memory, Core Data Center revenue |
| Is the product cycle on track? | Blackwell/Rubin, networking, AI systems | HBM4, HBM4E, DDR5, data center SSDs |
| Is margin sustainable? | Platform pricing power, competition pressure | ASP, inventory, supply discipline |
| Has valuation priced in the risk? | Are high growth expectations too full? | Is the cycle peak underpriced or overpriced? |
| More suitable logic | Long-term platform growth | Cycle leverage + AI memory revaluation |
Trading Costs and Rules Also Matter
If you follow MU, NVDA, or semiconductor ETFs at the same time, you should compare not only AI chip and AI storage logic, but also actual trading costs. U.S. stock trading costs may include more than commissions. They can also include platform fees, external institution fees, transaction activity fees, and order-related charges. Biya charges $0 commission for U.S. stock trading, while platform fees, external institution fees, and other costs are subject to the U.S. stock trading fee structure and the order page. Service availability depends on the user’s location, identity verification result, platform rules, and applicable laws and regulations.
If you want to keep MU, NVDA, AMD, Broadcom, semiconductor ETFs, and AI storage companies in the same market view, Biya can help you monitor U.S. stocks, Hong Kong stocks, and crypto markets together. However, public market information, trading rules, and fee structures should only be used as research inputs and do not constitute investment advice. Before trading, always confirm the order page, statement details, and local regulatory requirements.
Summary: Choosing between NVDA and MU is not about which company is “more AI.” It is about which type of risk you want to take and which type of return driver you want exposure to. NVDA fits an AI platform growth framework, with focus on compute demand, ecosystem barriers, system delivery, and competitive landscape. MU fits an AI storage cycle framework, with focus on HBM, DRAM, NAND, SSDs, ASP, and inventory cycles. You can study them separately or track both together, but you should not treat them as interchangeable. NVDA’s valuation tolerance depends on continued upside surprises. MU’s valuation tolerance depends on whether the memory cycle continues rising. For retail investors, the most important task is to put earnings indicators, industry cycles, trading costs, and personal risk tolerance into the same framework, rather than focusing only on AI theme popularity.
Comparing MU and NVDA is not about deciding which company is more popular. It is about comparing two different AI paths: the AI chip platform path and the AI storage cycle path. NVDA represents the front-end gateway of AI compute infrastructure. MU represents cycle leverage from rising memory and storage content inside AI servers. Users who meet the relevant service conditions can register an account to track U.S. stocks, Hong Kong stocks, semiconductor ETFs, and related earnings events, or download the app to check market data and account features. Public market information, fee structures, and trading rules are for research purposes only and do not constitute investment advice. Actual trading should follow platform rules, order pages, statement details, and local regulatory requirements.
FAQ
Which Benefits More Directly from AI, MU or NVDA?
NVDA benefits more directly from AI compute demand, while MU benefits more directly from AI memory, HBM, and data center storage demand. NVDA’s revenue is closer to GPUs, AI systems, and data center capex. MU’s revenue is more affected by HBM, DRAM, NAND, and SSD supply-demand. Both benefit from AI, but they do not follow the same investment logic.
Can Micron MU Be Viewed as a Substitute for NVIDIA NVDA?
MU should not be viewed simply as a substitute for NVDA. NVDA is an AI chip platform story, focused on GPUs, networking, software ecosystems, and Data Center revenue. MU is an AI memory and storage cycle story, focused on HBM, DRAM/NAND pricing, data center SSDs, and gross margin. Their valuation methods and risk sources are different.
Which Risk Is Bigger: NVDA’s High Valuation or MU’s Cyclicality?
The two risks are different in nature, so one is not automatically bigger than the other. NVDA’s risks come more from excessive expectations, stronger competition, customer-designed chips, and slower AI capex. MU’s risks come more from DRAM/NAND price reversal, rising inventories, and supply expansion. Investors should judge based on their own risk tolerance.
How Can Retail Investors Track MU and NVDA Together?
Retail investors can place NVDA in an AI compute platform framework and MU in an AI storage cycle framework. For NVDA, focus on Data Center revenue, gross margin, Blackwell/Rubin, and guidance. For MU, focus on HBM, Cloud Memory, Core Data Center, DRAM/NAND ASP, inventory, and margin trends.
What Are the Most Important Earnings Metrics for MU and NVDA?
For NVDA, the most important metrics are Data Center revenue, gross margin, Q2/Q3 guidance, Blackwell/Rubin shipments, and networking growth. For MU, the most important metrics are HBM shipments, Cloud Memory, Core Data Center, DRAM/NAND ASP, data center SSDs, inventory changes, and margin sustainability.
Can Semiconductor ETFs Cover Both MU and NVDA?
Some semiconductor ETFs can hold both MU and NVDA, but their weights, expense ratios, index rules, and industry exposures differ. ETFs with heavier NVDA exposure are more tilted toward AI platform growth, while ETFs with larger MU or memory exposure are closer to the AI memory cycle. Before investing, review ETF holdings and fee rules.
*This article is provided for general information purposes and does not constitute legal, tax or other professional advice from BiyaPay or its subsidiaries and its affiliates, and it is not intended as a substitute for obtaining advice from a financial advisor or any other professional.
We make no representations, warranties or warranties, express or implied, as to the accuracy, completeness or timeliness of the contents of this publication.
Related Blogs of

US to Portugal Online Money Transfer Limits: Per-Transaction Caps Explained


Buying US Stocks from Overseas: Broker Options, Funding, and Costs




Choose Country or Region to Read Local Blog
 Australia
 Austria
 Belgium
 Canada
 Cyprus
 Czech Republic
 Denmark
 Estonia
 Finland
 France
 Germany
 Greece
 Hong Kong
 India
 Indonesia
 Ireland
 Italy
 Japan
 Latvia
 Lithuania
 Luxembourg
 Malaysia
 Malta
 Morocco
 Nepal
 Netherlands
 New Zealand
 Norway
 Pakistan
 Philippines
 Poland
 Portugal
 Romania
 Singapore
 Slovakia
 Slovenia
 South Africa
 South Korea
 Spain
 Sweden
 Thailand
 United States
 Turkey
 United Arab Emirates
 United Kingdom
 Vietnam