Steady Investment Strategies for the S&P 500 Index Amid High-Level Volatility


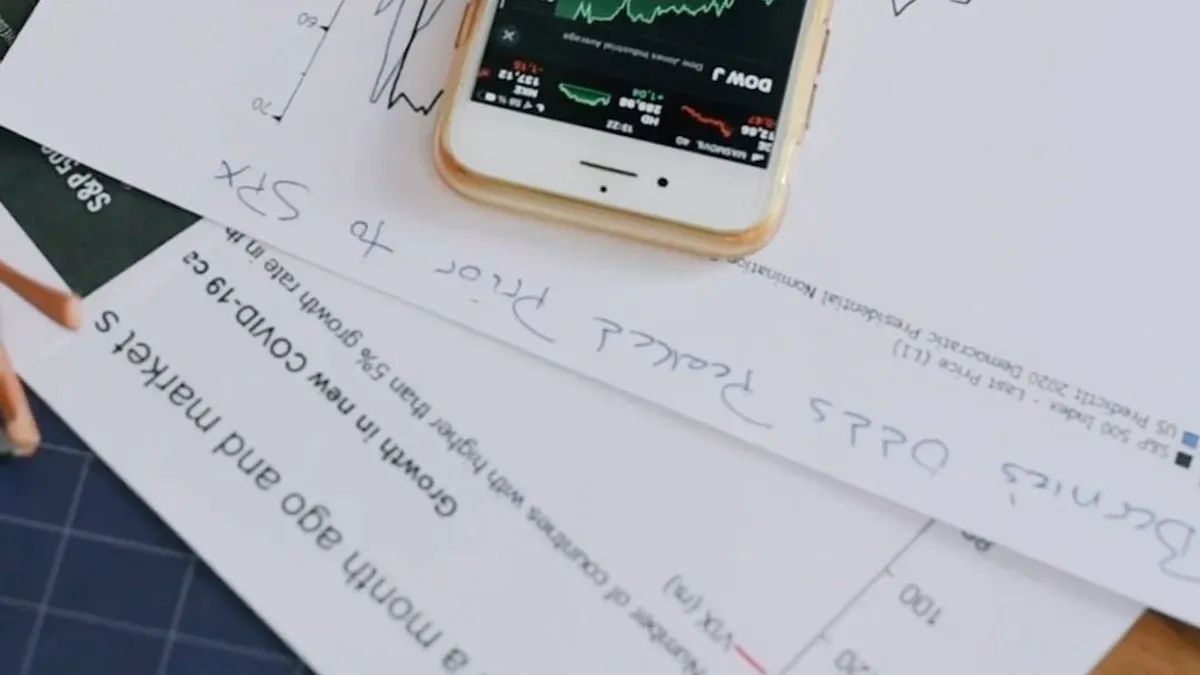
Image Source: pexels
You may be facing conflicting signals in the 2025 market. On one hand, there are optimistic expectations from institutions; on the other, the S&P 500 Index is at historical highs with intense volatility early in the year.
JPMorgan data shows that current market valuations are 2.3 standard deviations above the 25-year historical average, falling into the “strongly overvalued” range.
Against a backdrop of both opportunities and challenges, we recommend adopting a steady strategy of “systematic dollar-cost averaging as the core, combined with dynamic adjustments and diversified allocation.” This approach aims to help you navigate short-term volatility rather than predicting market tops, thereby steadily sharing in the long-term growth dividends of the US economy.
Key Points
- When the market is at highs, regularly investing in S&P 500 Index funds is the best method. It can help you make money over the long term.
- You can adjust investments based on market changes. When the market falls, you can buy more.
- Don’t put all your money in one place. You can invest in gold or markets in other countries for greater safety.
- Even with significant market volatility, stick to your investment plan. Long-term persistence leads to good results.
Investing in the S&P 500 Index: Why Dollar-Cost Averaging Is the Cornerstone
Facing a market operating at highs and full of uncertainty, attempting to precisely “time” entries is nearly impossible. Even professional investors struggle to consistently outperform the market. Fortunately, you don’t need to be a market prediction expert. Investing legend Warren Buffett has long pointed ordinary investors toward a simple and effective path.
Buffett’s Long-Term Investment Advice
- Buy S&P 500 Index Funds: No need to deeply research individual stocks; index funds provide diversified exposure to America’s top companies.
- Hold Long-Term: Historical data shows that even after drawdowns, the S&P 500 Index typically recovers and generates returns within a few years.
- Resist the Urge to Sell: Maintain discipline during market turbulence and avoid irrational decisions driven by panic.
The essence of this advice is to abandon timing attempts and embrace long-termism. Human psychological biases, such as “loss aversion” (fear of losses far outweighing joy from equivalent gains) and “anchoring bias” (fixating on the initial purchase price), often lead us to make buy/sell decisions at the wrong times. Systematic regular investing (dollar-cost averaging) is a powerful tool to overcome these psychological traps.
Dollar-Cost Averaging’s Risk-Smoothing Mechanism Amid High-Level Volatility
Regular investing, or dollar-cost averaging (DCA), is a strategy of investing a fixed amount at fixed intervals (e.g., monthly) regardless of market ups and downs. Its core advantage is automatically buying more shares when prices are low and fewer when prices are high, effectively lowering your average holding cost over the long term.
Let’s understand this mechanism with a specific example. Suppose you planned to invest $1,000,000 in early 2020 in a fund tracking the S&P 500 Index.
- Lump-Sum Investment: If you invested all funds on January 21 at $331.30 per share, you would buy about 3,018 shares.
- Regular Investment: If you divided the funds into five parts, investing $200,000 monthly, the situation would differ significantly.
| Date | Investment Amount | Price per Share | Shares Purchased |
|---|---|---|---|
| January 21, 2020 | $200,000 | $331.30 | 604 |
| February 20, 2020 | $200,000 | $336.95 | 593 |
| March 20, 2020 | $200,000 | $228.80 | 874 |
| April 20, 2020 | $200,000 | $281.59 | 710 |
| May 20, 2020 | $200,000 | $296.93 | 673 |
Through dollar-cost averaging, you ultimately obtained 3,454 shares at an average cost of $294.99. Compared to lump-sum investing, your share count increased by 14%. When the market plummeted in March due to pandemic panic, your fixed investments automatically captured more low-priced shares, laying a solid foundation for subsequent recovery gains.
Historical data repeatedly validates dollar-cost averaging’s defensive value during market downturns. For example, during the 2008 financial crisis, losses with dollar-cost averaging were significantly lower than those from lump-sum investing at market highs.
| Market Downturn Period | Investment Strategy | Investment Period | Final Value ($10,000 Initial Investment) |
|---|---|---|---|
| 2008 Great Recession | Dollar-Cost Averaging | June 2008 - April 2009 | Approx. $9,738 |
| 2008 Great Recession | Lump-Sum | June 2008 | Approx. $8,191 |
Dollar-cost averaging enforces discipline, helping you continue buying during market panic when others are selling, truly achieving “be greedy when others are fearful.”
2025 Dollar-Cost Averaging in Practice: Frequency, Amounts, and Fund Choices
Powerful theory ultimately requires action. To build an effective dollar-cost averaging plan, you need to clarify three elements: investment frequency, investment amount, and investment vehicle.
“Dollar-cost averaging may be the most effective strategy for all investors at all levels most effective strategy. It’s one of the simplest ‘set it and forget it’ methods, but you do need to pay attention to what you’re investing in.” — Financial Planner LaFleur
1. Setting Frequency and Amounts
- Determine Budget: First, assess your cash flow and set an amount you can sustain even during financial tightness, such as $250 or $500 monthly.
- Choose Frequency: The most common is monthly, often aligning with your paycheck cycle. Weekly or quarterly works too; the key is consistency.
- Utilize Automation: Most brokers and platforms offer automatic investment features. Once set, the system deducts from your bank account on a fixed date each month and buys the designated fund. This minimizes emotional interference and ensures strict plan execution.
2. Choosing Investment Vehicles Your goal is the S&P 500 Index; the most direct way is buying ETFs (exchange-traded funds) or mutual funds tracking it. The key to selection is low expense ratios, as fees directly erode long-term returns.
Once you’ve locked in the “frequency, amount, and vehicle,” the next step is making execution frictionless. For example, you can use BiyaPay’s Stock Info Search to sanity-check the basics and price context of common choices like VOO/IVV/SPY, then use the FX Rate Converter to translate your funding currency into an estimated USD cost—helpful in volatile periods when FX assumptions can quietly shift your DCA cadence. After that, you can Register and go through the Trading Entry to execute according to your plan.
If you also deal with cross-border cash flows (income, tuition, or multi-currency budgeting), keeping “conversion—investing—cash management” in one workflow can make tracking and review easier. BiyaPay positions itself as a multi-asset wallet across payments, investing, and trading, with compliance footprints such as U.S. MSB registration and New Zealand FSP registration; you can also check the Event Center for any product guidance or onboarding-related entries that help you set up a repeatable process from day one.
Here are some popular, low-cost options on the market:
| Fund Name | Type | Expense Ratio | Features |
|---|---|---|---|
| Vanguard S&P 500 ETF (VOO) | ETF | 0.03% | One of the largest S&P 500 ETFs by assets |
| iShares Core S&P 500 ETF (IVV) | ETF | 0.03% | Similarly low-fee and large-scale industry leader |
| Schwab S&P 500 Index Fund (SWPPX) | Mutual Fund | 0.02% | Extremely low expense ratio, ideal for mutual fund preferences |
| SPDR S&P 500 ETF Trust (SPY) | ETF | 0.095% | The oldest ETF with excellent liquidity |
| Fidelity ZERO Large Cap Index (FNILX) | Mutual Fund | 0% | Zero-fee fund, maximizing cost reduction |
For investors seeking to simplify the process, some modern fintech platforms offer convenient solutions. For example, through apps like Biyapay, you can easily convert local currency to USD and set up automatic dollar-cost averaging into US stock ETFs like VOO directly on the platform, integrating currency exchange and securities investment for efficient global asset allocation.
No matter which platform or fund you choose, the core principle remains: select low-cost vehicles and persist with your automated dollar-cost averaging plan. This is your cornerstone for steady progress in a high-volatility market.
Dynamic Adjustments: Leveraging Market Volatility to Enhance Returns
Image Source: pexels
While systematic dollar-cost averaging is the cornerstone of your portfolio, it’s not the only strategy. During periods of intense market volatility, dynamic adjustments can help seize opportunities and further boost returns. The market trend in early 2025 is a prime example.
| Month | Performance |
|---|---|
| March 2025 | -5.75% |
| February 2025 | -1.42% |
| January 2025 | 2.70% |
After rising in January, the market fell consecutively in February and March. Facing this rollercoaster, rigid dollar-cost averaging might cause unease. Dynamic adjustments encourage investing more than planned during downturns, more effectively lowering costs.
Value Averaging: An Advanced Version Beyond Traditional Dollar-Cost Averaging
Value Averaging is an upgraded version of traditional dollar-cost averaging. It no longer requires fixed monthly amounts but pursues steady growth in portfolio value.
How Value Averaging Works
- Set Targets: Establish a monthly portfolio value growth goal, e.g., $200 per month.
- Dynamic Investments: Check the account at month-end. If market gains exceed $200, reduce or pause investment that month. If short of $200 due to declines, invest more to bridge the gap.
This method forces heavier buying during downturns and reduced input during overheating, logically advancing beyond traditional dollar-cost averaging.
| Feature | Value Averaging | Dollar-Cost Averaging |
|---|---|---|
| Core Goal | Maintain specific target portfolio value | Regularly invest fixed amounts regardless of volatility |
| Investment Amount | Adjust based on performance | Fixed regular amounts, no adjustment for market changes |
| Focus | Portfolio value | Averaging investment costs |
| Strategy Nature | Dynamic adjustment | Fixed and unchanging |
VIX Index: A Trading Signal for Market Fear
Beyond value averaging, you can use market sentiment indicators to guide decisions. The VIX Index, or volatility index, often called the “fear index”, measures expected 30-day market volatility. When VIX spikes, it usually signals extreme market panic.
VIX Index Interpretation
- Below 20: Market sentiment is relatively calm or complacent.
- Above 40: Extreme panic, widespread selling.
Historical data shows that when VIX surges above 40, it’s often an excellent time to buy the S&P 500. Short-term declines may continue, but returns over 1, 3, and 5 years are typically strong.
Whether during the 2008 financial crisis or the 2020 pandemic, investing after extreme fear (VIX > 40) yielded positive long-term returns. Thus, view the VIX as a contrarian indicator: when fear spreads, it’s your signal to increase investments and boldly position.
Diversified Allocation: Building a Safety Net for Your Portfolio
Image Source: pexels
Relying solely on dollar-cost averaging and dynamic adjustments leaves your portfolio heavily concentrated in the US market. When analysts downgrade US market ratings to “neutral,” it reminds us that single-market risks cannot be ignored. To build a true safety net, diversify by allocating some assets to areas with low correlation to US stocks.
Defensive Assets: Short-Term Treasuries and Cash
During market turbulence, cash and short-term Treasuries act as your portfolio’s “ballast.” They preserve capital and provide valuable liquidity for bottom-fishing during declines.
Role of Defensive Assets
- Preservation: During the 2008 financial crisis and 2020 market crash, US Treasuries remained stable due to their safe-haven status as stocks plummeted.
- Liquidity Provision: Holding a portion in cash allows quick action when opportunities arise.
Financial advisors typically recommend varying cash proportions based on age. Younger investors can hold less; those nearing retirement need more.
Short-term Treasuries are superior to cash, offering interest income. Recently, even 1-month US Treasuries have provided attractive yields, making them ideal for short-term funds.
Risk Hedging: Gold and Opportunities in Other Markets
To effectively hedge US stock risks, allocate to assets with negative or low correlation. Gold, European, and mainland Chinese markets are three key directions.
1. Gold: The Traditional Safe Haven Gold typically has negative correlation with stocks. Historical data shows gold prices often rise during recessions and stock declines.
- 2007-2009 Financial Crisis: S&P 500 fell 56.8%, gold rose 25.5%.
- 1976-1978 Inflation Period: S&P 500 fell 19.4%, gold rose 53.8%.
Adding 5% to 10% gold to your portfolio can effectively smooth overall volatility.
2. European and Chinese Markets: Another Growth Pole Expanding globally is an effective risk dispersion method. European and mainland Chinese markets attract attention for low correlation with the US.
- European Markets: Benefiting from potential cyclical recovery and loose monetary policy, some European stocks show growth potential.
- Chinese Markets: A-shares have low correlation with global markets, providing valuable diversification.
You can easily allocate via ETFs tracking relevant indices, such as those for the MSCI China Index (e.g., HMCH) or European market ETFs. This captures global growth without added complexity while protecting your core US holdings.
Facing the complex 2025 market, your best path is building a steady investment system. This system centers on S&P 500 dollar-cost averaging, enhanced and protected by dynamic adjustments and diversified allocation.
You can follow this action checklist:
- Set and persist with your automated dollar-cost averaging plan.
- Monitor volatility signals and make timely micro-adjustments.
- Introduce gold or non-US assets to optimize risk defense.
Ultimately, focus on executing your established strategy. History shows market volatility is normal, while a long-term perspective and investment discipline are key to wealth growth. Ignore short-term noise and stick to your plan.
FAQ
The S&P 500 is already so high— is it too late to start dollar-cost averaging now?
Absolutely not too late. The core of dollar-cost averaging is long-term holding and cost smoothing, not predicting tops. Continuous buying allows automatic cost reduction during pullbacks, building a foundation for future growth. The key is to start and persist.
As a beginner investor, do I need to implement all strategies at once?
No need. Start with the core strategy.
- Step 1: Establish an automated dollar-cost averaging plan for an S&P 500 ETF.
- Step 2: Once familiar with market rhythms, try combining VIX for dynamic adjustments.
- Step 3: Finally, consider adding gold or other assets for diversification.
I only have a small amount monthly (e.g., $100)—is this strategy suitable?
Very suitable. Dollar-cost averaging has no minimum threshold. Many platforms support fractional shares, allowing small amounts to buy high-priced ETFs. Long-term persistence yields significant compounding. The important part is building investment discipline.
If the market crashes like 2020, should I stop dollar-cost averaging?
Quite the opposite—you should persist or even increase investments. Crashes mean buying more shares with the same money, a prime opportunity to accelerate cost reduction. Persisting through panic is where dollar-cost averaging surpasses human nature.
*This article is provided for general information purposes and does not constitute legal, tax or other professional advice from BiyaPay or its subsidiaries and its affiliates, and it is not intended as a substitute for obtaining advice from a financial advisor or any other professional.
We make no representations, warranties or warranties, express or implied, as to the accuracy, completeness or timeliness of the contents of this publication.
Related Blogs of

The Wisdom of Capital Sedimentation: After Winning U, Don’t Rush to Convert to RMB – Earn High USD Interest in a Multi-Asset Wallet


Don't Want to Expose Your Real Credit Card Information? 5 Privacy Payment Tips in the AI Era

How to Convert Cryptocurrency Donations Received by AI Open-Source Projects into Fiat Currency as Development Funds Without Loss?


From Cryptocurrency to OpenAI Bill: A 3-Minute Fiat Flash Exchange in Practice

Choose Country or Region to Read Local Blog

Contact Us


BIYA GLOBAL LLC is registered with the Financial Crimes Enforcement Network (FinCEN), an agency under the U.S. Department of the Treasury, as a Money Services Business (MSB), with registration number 31000218637349, and regulated by the Financial Crimes Enforcement Network (FinCEN).
BIYA GLOBAL LIMITED is a registered Financial Service Provider (FSP) in New Zealand, with registration number FSP1007221, and is also a registered member of the Financial Services Complaints Limited (FSCL), an independent dispute resolution scheme in New Zealand.