Why Do AI Data Centers Need Enterprise SSDs? Which NAND and SSD Stocks Benefit?




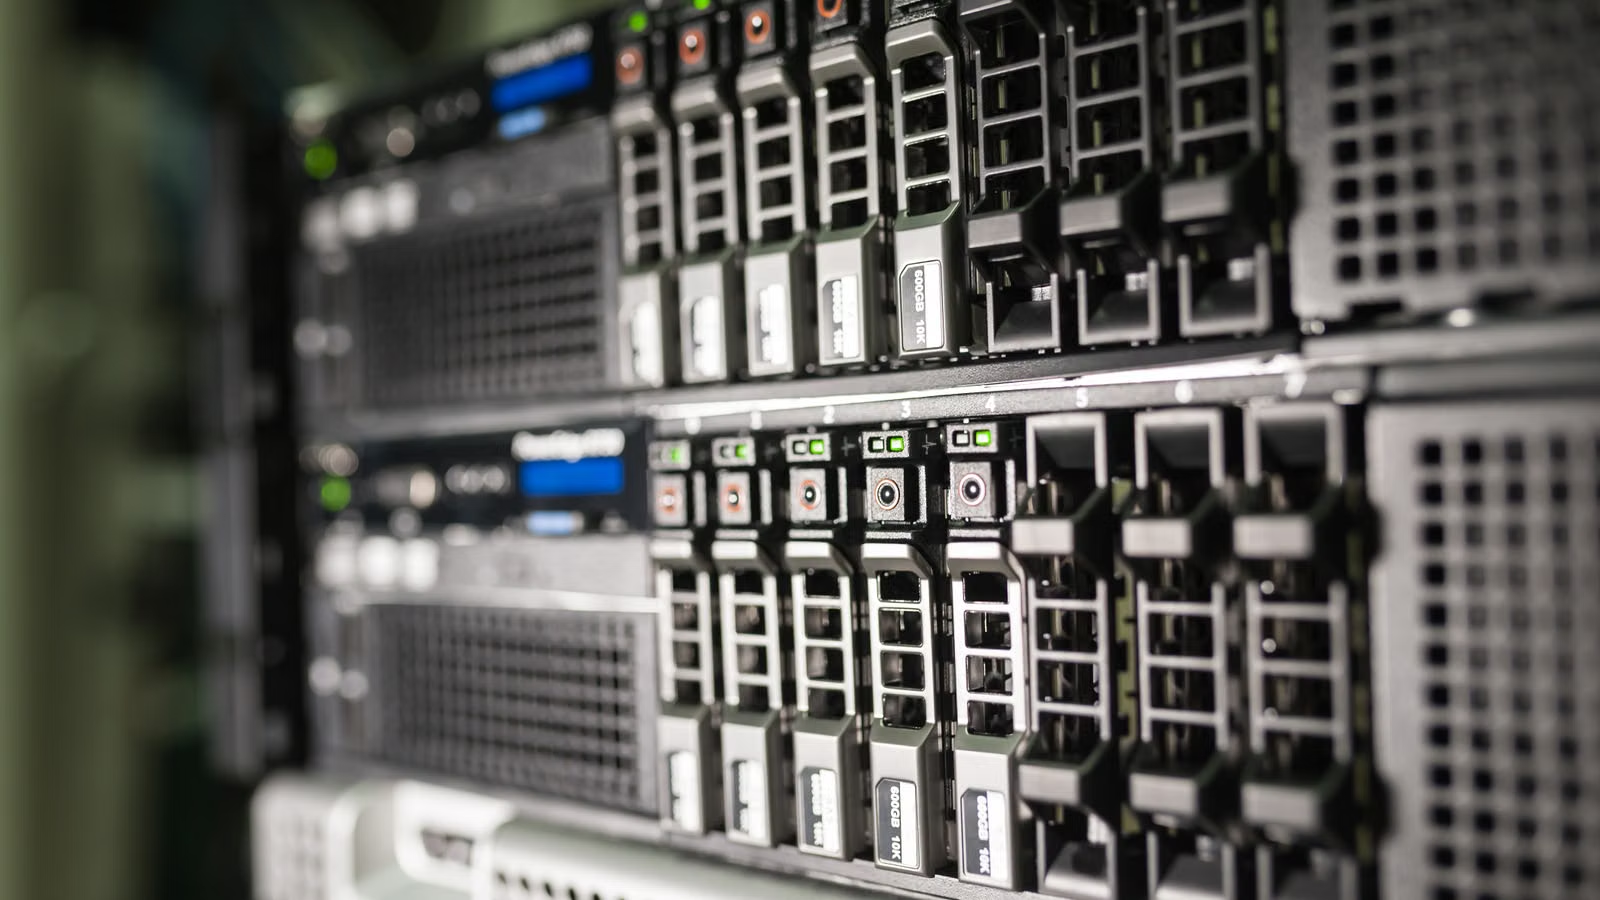
AI data centers need enterprise SSDs because GPUs are becoming faster, while data loading, model checkpointing, vector retrieval, and inference context access cannot become bottlenecks. HBM and DRAM handle the high-speed compute layer, HDDs are better suited for low-frequency cold data, and enterprise SSDs sit at the critical intersection of capacity, speed, latency, and cost. For investors, deciding whether NAND stocks or SSD stocks benefit more should not be based only on the “storage” label. The key is enterprise SSD revenue exposure, NAND self-supply capability, cloud customer qualification, product mix, and the NAND pricing cycle.
Key Takeaways
- AI data centers need SSDs so GPUs spend less time waiting for data.
- Enterprise SSD demand comes from training, inference, RAG, checkpointing, and caching.
- NAND price increases do not automatically improve every SSD company’s profit.
- Micron, Samsung, SK hynix, Kioxia, and Sandisk have different benefit paths.
- Investors should track revenue mix, customer qualification, inventory, and valuation.
Why Can’t AI Data Centers Rely Only on HBM, DRAM, and HDDs?

AI data centers cannot rely only on HBM, DRAM, and HDDs because each storage layer solves a different problem. HBM is closest to the GPU and offers extremely high bandwidth, but it is expensive and limited in capacity. DRAM has low latency, but it becomes costly when used for large context windows, vector databases, and large-scale active datasets. HDDs offer low cost per terabyte, but they are weak in random access, tail latency, and high-concurrency workloads. Enterprise SSDs fill the gap by providing a larger high-speed “hot data layer” between memory and bulk storage.
You can think of AI data center storage as a data pipeline. GPUs need to consume data continuously, but not all data can live in HBM or DRAM. If training datasets, model files, embeddings, vector indexes, and checkpoints stay in slow storage for too long, GPUs wait for I/O instead of performing computation. NVIDIA’s GPUDirect Storage reflects this industry direction: it aims to create a more direct data path between NVMe or NVMe-oF storage and GPU memory, reducing CPU staging, latency, and system overhead.
| Storage Layer | Main Role | Strength | Limitation |
|---|---|---|---|
| HBM | Data used directly by GPUs | Highest bandwidth, very low latency | Small capacity, high cost |
| DRAM | Host memory and cache | Low latency, highly flexible | Expensive to scale |
| Enterprise SSD | Hot data, models, indexes, checkpoints | Large capacity, high speed, lower cost than DRAM | Still slower than memory |
| HDD | Cold data, archive, backup | Low cost per TB | Weak random access and latency |
AI training, inference, and RAG also create different SSD requirements. Training requires high-throughput reads of large datasets and frequent writing of model checkpoints. Inference depends more on model loading, low-latency random reads, and concurrent access. RAG relies on vector databases, enterprise knowledge bases, and index queries. Kioxia’s AI storage materials also separate training, inference, RAG, and grounding workloads, showing that different AI workflows require different combinations of high capacity, high bandwidth, high IOPS, and low latency.
This explains why enterprise SSDs are no longer just accessories. They are part of AI infrastructure. The larger the AI cluster, the more expensive the GPUs. Any link that causes GPUs to wait can magnify total infrastructure cost. The value of enterprise SSDs is not only that they store more data, but that they deliver the right data to the right place at the right time.
Summary: AI data centers still need HBM, DRAM, and HDDs, but the role of enterprise SSDs is rising. HBM and DRAM solve high-speed compute and active data problems, while HDDs solve low-cost capacity problems. Enterprise SSDs provide the high-speed capacity layer for hot data, model files, vector indexes, checkpoints, and inference context. For investors, rising enterprise SSD demand reflects a broader need to upgrade the data path behind AI compute; otherwise, expensive GPUs can be slowed down by storage bottlenecks.
How Are Enterprise SSDs Different from Consumer SSDs?

The difference between enterprise SSDs and consumer SSDs is not simply larger capacity or faster interfaces. The real difference is whether the drive can maintain stable latency, predictable IOPS, data protection, and sufficient write endurance under 24/7 high-load conditions. Consumer SSDs are suitable for personal computers and light workloads, but AI data centers face continuous training, concurrent inference, log writing, index updates, and large mixed read-write workloads. Stability matters more than peak benchmark numbers.
Enterprise SSDs usually focus on several key metrics:
- Sequential read and write bandwidth: affects large model files, training datasets, and object storage reads.
- Random IOPS: affects vector retrieval, small-file access, and concurrent inference.
- Tail latency and QoS: prevents a small number of slow requests from dragging down an entire GPU cluster.
- DWPD write endurance: measures how many times the full drive capacity can be written per day.
- Power-loss protection and end-to-end data protection: reduce data corruption and abnormal shutdown risks.
- PCIe Gen5, NVMe, E1.S, and E3.S standards: affect server scalability, thermals, and maintenance.
The difference between TLC and QLC also affects how enterprise SSDs are deployed. TLC usually offers stronger write performance and endurance for mixed workloads, while QLC focuses more on capacity density and cost per terabyte. Solidigm’s D5-P5336 reaches up to 122.88TB and is positioned for read-intensive, data-intensive, and AI-related workloads. Micron’s 6600 ION links up to 245TB capacity with AI, cloud, enterprise, and hyperscale data center use cases.
| Comparison | Consumer SSD | Enterprise SSD |
|---|---|---|
| Usage environment | Intermittent workloads | Sustained high workloads |
| Performance focus | Peak read/write speed | Steady-state performance, tail latency, IOPS |
| Data protection | Basic protection | Power-loss protection, error checking, telemetry |
| Endurance | Often measured by TBW | DWPD and workload classes |
| Form factor | Mainly M.2 | U.2, E1.S, E3.S, EDSFF |
| Operations | Individual management | Fleet monitoring, hot swap, health tracking |
PCIe Gen5 enterprise SSDs are also raising the performance ceiling for data centers. Samsung’s PM1743 lists sequential read speeds of up to 14,000MB/s, while Kioxia’s CM9 Series emphasizes PCIe 5.0, NVMe 2.0, dual-port support, and different endurance classes for read-intensive and mixed-use workloads. Competition in this market is no longer only about single-drive speed. It also includes rack density, performance per watt, serviceability, and customer qualification.
Summary: Enterprise SSDs are not simply consumer SSDs with larger capacities placed into servers. They are products designed around data center reliability, sustained performance, and operational manageability. AI data centers care about a combined balance of throughput, IOPS, tail latency, endurance, power consumption, form factor, and data protection. TLC, QLC, PCIe Gen5, and ultra-high-capacity SSDs each have their own place. A single speed metric is not enough to judge whether an SSD is suitable for AI workloads.
How Does AI Demand Flow from GPU Spending to NAND and SSD Revenue?

AI demand reaches NAND and SSD revenue through several steps. Cloud providers increase AI CAPEX, GPU servers and storage nodes expand together, each server is configured with more high-capacity NVMe SSDs, enterprise SSD shipments and average selling prices rise, and only then does this flow into NAND bit demand, revenue, and gross margin. In other words, the AI theme does not automatically make every storage company a winner. Financial improvement becomes meaningful only when orders, product mix, and the pricing cycle all materialize.
The transmission path can be simplified as follows:
AI CAPEX → AI servers and storage clusters increase → SSD capacity per server rises → Enterprise SSD shipments and ASP improve → NAND bit demand increases → Product mix improves → Revenue, gross margin, and cash flow change
Industry data already reflects this trend. TrendForce reported that revenue among the top five enterprise SSD brands reached US$18.46 billion in the first quarter of 2026, up 86.1% quarter over quarter, driven by rapid adoption of AI agent services and strong CSP procurement. Another TrendForce report showed that revenue among the top five NAND Flash suppliers rose 83.7% quarter over quarter in the same period, with enterprise SSD and AI data center demand serving as major drivers.
However, NAND price increases and SSD profit improvement are not the same thing. Vertically integrated manufacturers can benefit from both rising NAND prices and a shift toward higher-value enterprise SSDs. SSD module makers or controller companies that buy NAND externally may first face higher input costs before they can pass those costs to customers. Long-term supply agreements can improve order visibility, but they may also limit short-term pricing flexibility. Inventory cost, customer qualification, product mix, and contract terms all affect the timing of profit realization.
| Variable | Impact on NAND Suppliers | Impact on SSD Companies |
|---|---|---|
| NAND contract price increase | Raises chip revenue | Benefits self-supply players; raises costs for external buyers |
| Higher enterprise SSD mix | Improves product structure | Raises ASP and customer stickiness |
| Customer qualification completed | Supports long-term orders | Determines whether new products can scale |
| Weak consumer electronics demand | Drags total demand | Affects client SSDs |
| Capacity expansion | Increases long-term supply | May pressure pricing cycles |
| Inventory position | Affects gross margin leverage | Determines cost reset timing |
Micron’s fiscal 2026 third-quarter results also show why AI memory and data center demand have become central market variables. For investors, the real questions are whether data center SSD revenue continues to grow, whether NAND ASP rises in a healthy way, and whether gross margin improvement is driven by product mix rather than only spot price volatility.
Summary: AI data center demand reaches NAND and SSD revenue only after server deployment, storage configuration, enterprise SSD procurement, NAND bit consumption, and financial recognition. Price increases, shipment growth, revenue growth, and profit improvement are four different stages. When analyzing NAND or SSD stocks, you should focus on enterprise revenue exposure, contract pricing, product mix, inventory, and customer qualification rather than making decisions solely based on the “AI storage” label.
Which Stocks Benefit More Directly from the NAND and Enterprise SSD Supply Chain?
The companies that benefit more directly from the NAND and enterprise SSD supply chain are usually those with NAND manufacturing capacity, enterprise SSD product lines, cloud customer qualification, and high-capacity product roadmaps. The highest upside exposure is not necessarily the lowest risk. The more concentrated the business, the stronger the earnings leverage during an upcycle, but the larger the downside risk during a downturn. The more diversified the business, the more diluted the impact from AI SSDs, although volatility may be lower.
| Company | Ticker | Main Exposure | Benefit Path | Main Limitation |
|---|---|---|---|---|
| Micron | MU | DRAM, HBM, NAND, SSD | Dual exposure to data center SSDs and AI memory | SSD exposure diluted by DRAM |
| Samsung Electronics | 005930.KS | NAND, DRAM, consumer electronics | NAND scale and enterprise SSDs | Highly diversified group business |
| SK hynix / Solidigm | 000660.KS | HBM, DRAM, NAND, enterprise SSDs | Solidigm high-capacity QLC SSDs | HBM may dominate stock narrative |
| Kioxia | 285A.T | NAND, SSD | More concentrated flash exposure, AI inference sensitivity | High NAND cycle risk |
| Sandisk | SNDK | NAND, SSD | Data center NAND and high-capacity SSDs | Customer transition and product mix risk |
| Silicon Motion / Phison | SIMO / 8299.TWO | SSD controllers and solutions | Controller shipments and enterprise penetration | No direct NAND capacity ownership |
| Marvell / Pure Storage | MRVL / PSTG | Storage controllers, systems, software | Data infrastructure and all-flash systems | Not pure NAND pricing exposure |
Micron’s advantage is its broader AI memory exposure across DRAM, HBM, NAND, and data center SSDs. Samsung’s advantage lies in scale and manufacturing capability, but smartphones, displays, and consumer electronics dilute the purity of enterprise SSD exposure. SK hynix participates in high-capacity enterprise SSDs through Solidigm while also being a key HBM player, so its stock can be influenced more heavily by HBM expectations.
Kioxia and Sandisk have more concentrated flash exposure. Kioxia’s AI inference era growth strategy highlights investment around AI market opportunities. Sandisk and Kioxia continue to work around BiCS technology, making high-capacity data center products important for future revenue structure. Controller and system companies are more indirect beneficiaries. Silicon Motion and Phison benefit through SSD controller and solution value, Marvell benefits from data infrastructure chips, and Pure Storage’s all-flash storage is more tied to systems, subscriptions, and enterprise storage solutions.
If you follow U.S.-listed names such as MU, SNDK, MRVL, and PSTG, you can use U.S. stock information lookup to compare basic stock information, market performance, and trading sessions before returning to company filings for data center revenue, gross margin, and inventory. Where your location, identity verification, and applicable rules allow, Biya also supports U.S. stock and Hong Kong stock trading, helping you keep AI storage supply-chain names in one watchlist instead of focusing only on one stock’s short-term price moves.
Trading costs also matter when you follow popular semiconductor stocks. U.S. stock trading costs usually include more than commissions; they may also include platform fees, external agency fees, and trading activity fees. Biya’s U.S. stock commission is US$0, while platform fees, external agency fees, and other charges are subject to U.S. stock trading fees and the order page. Public market information and fee structures can help you understand trading conditions, but they do not replace individual stock research and do not constitute investment advice.
Summary: The benefit level of NAND and enterprise SSD stocks should be judged through business purity, product mix, customer qualification, self-supply capability, valuation, and cycle risk. Micron, Samsung, SK hynix, Kioxia, and Sandisk are more direct storage-chain names, while controller, interface chip, and all-flash system companies are more indirect beneficiaries. More direct exposure does not mean lower risk, and diversification does not mean no upside. The key is whether AI data center demand truly enters revenue and profit.
What Indicators and Risks Should Investors Track?
To judge whether the AI enterprise SSD cycle can continue, you should not look only at NAND spot prices or one-day stock moves. A more useful approach is to track demand, pricing, product mix, inventory, capital expenditure, and valuation at the same time. If enterprise SSD revenue grows, gross margin improves, inventory falls, and customer qualification progresses together, the logic is stronger. If prices rise while shipments weaken, cycle peak risk becomes more important.
Key indicators include:
- Data center SSD revenue and quarter-over-quarter or year-over-year growth.
- Data center and enterprise business as a percentage of total revenue.
- NAND bit shipments, ASP, and contract price trends.
- Product mix across TLC, QLC, and high-capacity SSDs.
- Cloud AI CAPEX, server deliveries, and storage procurement.
- New product qualification, mass-production timing, and long-term supply agreements.
- Gross margin, inventory days, free cash flow, and capital expenditure.
- Semiconductor index valuation, ETF flows, and market crowding.
| Indicator | Positive Signal | Weakening Signal |
|---|---|---|
| Enterprise SSD revenue | Keeps growing and outpaces consumer business | Growth slows sharply |
| NAND ASP | Rises moderately with shipment growth | Price rises while shipments decline |
| Data center mix | Continues to increase | Still relies on smartphone and PC recovery |
| Gross margin | Improves due to product mix | Mainly benefits from low-cost inventory |
| Customer agreements | Multi-year orders or minimum volume commitments | Concentrated and cancellable orders |
| Capital expenditure | Matched with visible demand | Industry-wide aggressive expansion |
| Inventory | Stable or falling | Inventory days rise again |
Risks also matter. First, NAND is a highly cyclical industry. If major suppliers expand capacity at the same time, supply can again exceed demand. Second, if AI CAPEX slows, enterprise SSD procurement may be delayed. Third, HDDs still have a clear cost-per-terabyte advantage in cold data layers and will not be fully replaced by SSDs. Fourth, QLC is suitable for large-capacity and read-intensive use cases, but it is not ideal for all high-write workloads. Fifth, customer qualification cycles are long, and there may be a time lag between product launch and revenue recognition.
Valuation is also part of the risk. The more fully the market prices in the AI storage story, the more future earnings reports must prove that revenue and profit are materializing. You can divide storage stocks into three groups: companies with higher NAND and enterprise SSD purity, broader AI memory beneficiaries, and indirect beneficiaries in controllers, systems, and infrastructure. Their upside logic is different, and so are the reasons they may pull back.
Summary: The sustainability of the AI enterprise SSD cycle depends on demand quality, pricing quality, product mix, inventory position, and valuation digestion. Positive signals include rising data center SSD revenue, gross margin improvement driven by high-value products, healthy inventory, and better customer order visibility. Warning signs include aggressive capacity expansion, slower shipments, valuation pull-forward, and delayed AI CAPEX. For ordinary investors, a repeatable tracking framework is more useful than trying to predict short-term price moves.
If you want to add the AI data center storage supply chain to your watchlist, start with company filings and product mix, then compare actual exposure across U.S. stocks, Hong Kong stocks, or semiconductor ETFs. Biya is a global multi-asset trading wallet that supports U.S. stocks, Hong Kong stocks, and digital asset trading, as well as payments in more than 40 local currencies. Service availability depends on your location, identity verification results, platform rules, and applicable laws and regulations. Before using download App, check trading fees, order types, account rules, and your own risk tolerance. AI storage is a long-term industry trend, but NAND and SSD stocks remain highly cyclical. Any trading decision should be based on public disclosures, billing details, and local regulatory requirements.
FAQ
Why Does Customer Qualification Affect Enterprise SSD Revenue?
Customer qualification determines whether an enterprise SSD can enter large-scale procurement lists at cloud providers and server vendors. The process usually tests performance, endurance, firmware stability, data protection, compatibility, and long-term supply capability, so a new product launch does not necessarily translate into meaningful revenue in the same quarter.
Is QLC NAND Suitable for AI Data Center Training and Inference?
QLC NAND is suitable for high-capacity, read-intensive, and cost-sensitive AI data center scenarios, but it is not ideal for every high-write workload. Model storage, data lakes, some inference caches, and RAG indexes can use QLC, while frequent checkpointing and mixed read-write workloads may be better suited to TLC or higher-endurance products.
Which Matters More for SSD Profit, NAND Contract Price or Spot Price?
For large NAND and enterprise SSD companies, profitability is usually more affected by contract prices. Spot prices can reflect short-term sentiment and channel inventory, but enterprise customers often purchase through contracts, so shipment volume, inventory cost, product mix, and long-term agreements must also be considered.
Does Higher Enterprise SSD Market Share Make a Stock More Attractive?
Higher enterprise SSD market share only reflects one part of a company’s competitive position and does not mean the stock is automatically attractively valued. Investors still need to compare gross margin, customer concentration, capital expenditure, inventory, debt, business diversification, and whether the current share price already reflects high-growth expectations.
Can Semiconductor ETFs Cover the NAND and Enterprise SSD Supply Chain?
Some semiconductor ETFs hold Micron, Samsung, SK hynix, or related storage companies, but actual exposure to NAND and enterprise SSDs depends on constituent weights. Before investing, check the fund’s latest holdings, expense ratio, regional exposure, and rebalancing methodology.
How Can Retail Investors Track AI Storage Stock Risk?
Retail investors can track data center SSD revenue, NAND ASP, inventory days, gross margin, capital expenditure, and cloud AI investment trends. If prices rise while shipments slow, inventory builds, or valuations already reflect strong growth, volatility risk in AI storage stocks may increase.
*本文仅供参考,不构成 BiyaPay 或其子公司及其关联公司的法律,税务或其他专业建议,也不能替代财务顾问或任何其他专业人士的建议。
我们不以任何明示或暗示的形式陈述,保证或担保该出版物中内容的准确性,完整性或时效性。
其他BiyaPay博客内容

Will PayPal Accept Stripe’s Offer? Three Major Obstacles: Board Approval, Financing, and Regulation


Where Will IBM Stock Go After Q2 Earnings? Three Scenarios Based on Revenue, Red Hat, and Free Cash Flow


What Does ASML’s Guidance Upgrade Mean for TSMC, Nvidia, and U.S. Semiconductor Equipment Stocks?


Is ASML’s Valuation Overextended After Earnings? Backlog and 2026 Guidance Risks

选择国家或地区,阅读当地博客
 澳大利亚
澳大利亚 奥地利
奥地利 比利时
比利时 加拿大
加拿大 塞浦路斯
塞浦路斯 捷克
捷克 丹麦
丹麦 爱沙尼亚
爱沙尼亚 芬兰
芬兰 法国
法国 德国
德国 希腊
希腊 香港
香港 印度
印度 印度尼西亚
印度尼西亚 爱尔兰
爱尔兰 意大利
意大利 日本
日本 拉脱维亚
拉脱维亚 立陶宛
立陶宛 卢森堡
卢森堡 马来西亚
马来西亚 马耳他
马耳他 摩洛哥
摩洛哥 尼泊尔
尼泊尔 荷兰
荷兰 新西兰
新西兰 挪威
挪威 巴基斯坦
巴基斯坦 菲律宾
菲律宾 波兰
波兰 葡萄牙
葡萄牙 罗马尼亚
罗马尼亚 新加坡
新加坡 斯洛伐克
斯洛伐克 斯洛文尼亚
斯洛文尼亚 南非
南非 韩国
韩国 西班牙
西班牙 瑞典
瑞典 泰国
泰国 美国
美国 土耳其
土耳其 阿联酋
阿联酋 英国
英国 越南
越南
联系我们



