How to Judge a Company’s Stock Potential with Earnings Per Share (EPS)?


Image Source: pexels
Wondering if Earnings Per Share (EPS) can help you gauge a company’s stock potential? EPS is indeed a key tool for assessing profitability, but you need to combine it with other factors for a comprehensive analysis.
- Research shows a significant relationship between EPS and stock prices, with EPS positively impacting stock prices over the long term.
- The Price-to-Earnings (P/E) ratio is also correlated with stock prices, commonly used by investors to determine if a company’s valuation is reasonable.
When analyzing, you should also consider analyst EPS expectations and the company’s future growth trends, as these significantly influence stock performance.
Key Points
- Earnings Per Share (EPS) is a critical indicator for assessing profitability, with a strong positive correlation to stock prices over the long term.
- Analyst EPS expectations directly impact stock prices, with positive earnings surprises typically driving price increases and negative surprises causing declines.
- When analyzing EPS, pay attention to non-recurring items, as they may distort a company’s true profitability and affect investment decisions.
- Combining historical EPS growth rates with analyst future projections enables more accurate assessments of stock potential, enhancing decision-making.
- Relying solely on EPS for investment decisions is insufficient; combine it with P/E ratios, industry dynamics, and other financial metrics for a holistic evaluation of financial health.
EPS Basics

Image Source: pexels
Definition and Calculation
When analyzing a company’s profitability, you often encounter the “Earnings Per Share” metric. EPS represents the net profit per share of common stock attributable to shareholders. You can calculate it using the following formulas:
| Formula Type | Calculation Formula | Description |
|---|---|---|
| Basic EPS | (Net Income - Preferred Dividends) / Weighted Average Shares Outstanding | Reflects profit allocation to common shareholders |
| Diluted EPS | (Net Income - Preferred Dividends) / Diluted Shares Outstanding | Accounts for convertible securities and options |
| Adjusted EPS | (Net Income - Preferred Dividends) / Weighted Average Shares Outstanding | Excludes non-core profits, focusing on core operations |
Here’s a simple example:
- A U.S. company has a net income of USD 1,000,000.
- It pays USD 250,000 in preferred dividends.
- The weighted average shares outstanding are 11,000,000.
- EPS is calculated as (1,000,000 - 250,000) / 11,000,000 = USD 0.068.
This indicates each common share generates USD 0.068 in profit for shareholders.
Types and Comparison
When reviewing financial reports, you’ll notice companies often report multiple EPS types:
- Basic EPS, based on actual shares outstanding, reflects the most direct profitability.
- Diluted EPS accounts for convertible securities and options, providing a more conservative profit estimate.
- Adjusted EPS excludes non-recurring items, better reflecting core business performance.
By comparing EPS across companies in the same industry, you can identify which companies have stronger profitability. Higher EPS often indicates a healthier company with greater potential to create shareholder value. Investors commonly use this metric, alongside other financial data, to assess a company’s competitive position in its industry.
Tip: Reporting basic EPS is mandatory, enabling fairer comparisons of profitability across companies.
EPS and Stock Price
EPS Growth and Stock Performance
When analyzing stocks, you’ll often find EPS growth closely tied to stock performance. Historical data shows that earnings growth significantly contributes to total stock market returns. For example, in the U.S. market, earnings growth contributions to annual total returns are shown below:
| Year | Total Return (%) | Earnings Growth Contribution (%) | Valuation Expansion Contribution (%) | Dividend Yield Contribution (%) |
|---|---|---|---|---|
| 2023 | 26.5 | 5.4 | 19.4 | N/A |
| 2024 | 24.5 | 10.5 | 12.5 | N/A |
| 2003 | 29.9 | 18.0 | 9.8 | 2.1 |
| 2004 | N/A | 15.9 | N/A | N/A |
| 2005 | N/A | 12.9 | N/A | N/A |
The table shows that earnings growth (EPS improvement) varies in its impact on stock returns across years but remains a key driver of price increases. The chart below further illustrates the contribution trends of earnings growth and valuation expansion over different years:
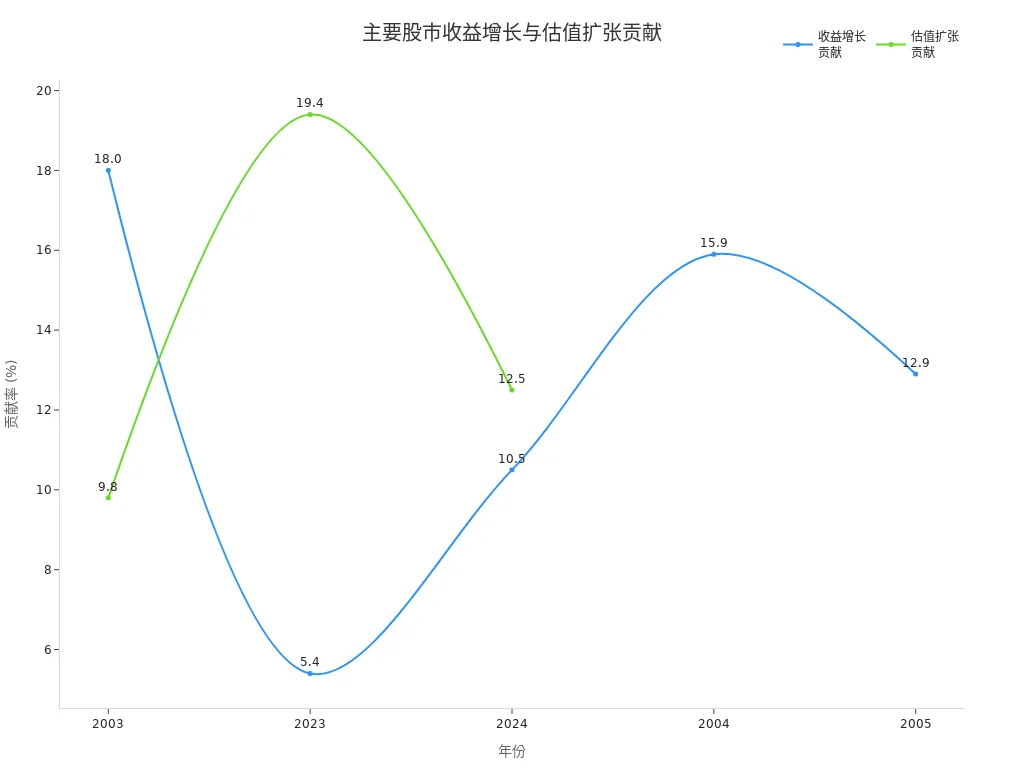
In practice, you’ll notice that sustained EPS growth often attracts more investor attention, driving stock price increases. Conversely, declining EPS typically negatively impacts stock prices.
During earnings seasons, stock price volatility is more pronounced around EPS announcements:
- Stock prices are typically more volatile in the days before and after earnings reports.
- When earnings exceed expectations, stock prices may rise after market open, though declines are also possible.
- During earnings calls, the timing of reports (e.g., “pre-market” or “post-market”) affects investor reactions and stock volatility.
The table below shows how actual EPS versus analyst expectations impacts stock prices:
| Type | Stock Price Reaction |
|---|---|
| Positive Earnings Surprise | Stock prices typically rise 2-10% |
| Negative Earnings Surprise | Stock prices typically fall 5-15% |
| Short-Term Reaction | Occurs within 24 hours of announcement |
| Long-Term Performance | Positive surprises yield 12-15% higher returns over 12 months |
You’ll find that positive earnings surprises (actual EPS exceeding expectations) often lead to rapid stock price increases, while negative surprises may cause significant declines. These reactions are most evident within 24 hours of the announcement, with some companies achieving higher long-term returns over 12 months.
Analyst Expectations Impact
When focusing on EPS, you must also consider analyst expectations. Analysts predict future EPS based on historical performance, industry trends, and market conditions, influencing investor sentiment and stock prices.
Analyst expectation changes directly affect stock prices:
- From 1992 to 2009, U.S. market data showed stocks with upward earnings revisions experienced positive returns, while downward revisions led to negative returns.
- This effect is more pronounced in stocks with high information uncertainty.
- Even after controlling for market conditions, seasonality, and risk, this phenomenon persists, suggesting investors often underestimate public information.
- Analysts may overemphasize private information when updating forecasts, especially when issuing favorable estimates relative to consensus.
- This behavior ties to analyst incentive structures, sometimes leading to overly optimistic or pessimistic estimates.
You’ll also notice that markets are highly sensitive to EPS surprises:
- There’s a significant positive correlation between market reactions and EPS surprises, especially during earnings shocks.
- Without earnings shocks, market reactions are driven by non-earnings factors.
- Stock price jumps can serve as proxies for earnings information shocks, indicating rapid market responses to unexpected earnings data.
When investing, don’t focus solely on EPS absolute values; consider analyst expectations and market reactions. Only through comprehensive analysis can you accurately assess a company’s stock potential.
EPS Analysis Considerations
Non-Recurring Items
When analyzing EPS, pay special attention to non-recurring items, which can distort profitability data and affect your judgment of a company’s true earnings capacity. Common non-recurring items include:
- Restructuring costs
- Legal fees
- Emergency expenses
- Asset impairments or write-offs
- Gains or losses from asset sales
- Purchase of new office buildings or manufacturing facilities
- Equipment and vehicle purchases
- Severance payments after layoffs
- Repair costs following natural disasters
Excluding these non-recurring items helps you see a company’s ongoing operational performance. Non-recurring items may skew true profitability, leading to misleading conclusions. Focusing on recurring earnings enables wiser investment decisions.
Historical and Growth Trends
When evaluating a company, don’t focus solely on a single year’s EPS. Examine the EPS growth rate over the past 3 to 5 years. The table below shows the EPS compound annual growth rates for select leading U.S. companies:
| Company Name | EPS CAGR (%) |
|---|---|
| Casey’s | 16% |
| Another Company | 29% |
| Third Company | 13% |
You’ll notice that sustained high growth rates often indicate stronger profitability and market competitiveness. Some companies maintain healthy growth despite high dividend payouts. When analyzing, combine historical data and growth trends to assess future potential.
Industry and Financial Metrics
When comparing EPS across companies, consider industry characteristics. Each industry has unique capital intensity, profit margins, and growth prospects. Industry norms and benchmarks also affect EPS comparisons, requiring industry-specific evaluations rather than simplistic cross-industry comparisons.
Additionally, combine other financial metrics to analyze company value, such as:
- Price-to-Earnings (P/E) Ratio
- Return on Investment (ROI)
- Dividend Yield
- Net Present Value (NPV)
Adjusted EPS helps you better understand financial health, especially when companies have significant one-time expenses or gains. However, don’t rely solely on adjusted EPS; use it alongside other financial data for a comprehensive assessment. EPS is a key reference but not the sole basis for investment decisions.
EPS Growth Trends

Image Source: unsplash
Longitudinal Comparison
When analyzing EPS, use longitudinal comparisons to observe a company’s profitability changes over time. This helps identify sustained growth or potential warning signs. Review EPS data over the past five or ten years to determine if the company is on an upward or downward trend.
- By analyzing historical EPS trends, you gain insights into profitability and growth potential.
- Observing EPS trajectories helps assess management effectiveness and the foundation for long-term growth.
- EPS is a key indicator of per-share profitability, reflecting profit allocation to common shares.
- Calculate annual EPS percentage changes to better understand financial health.
- Identifying trends helps uncover consistent growth patterns or recurring financial issues.
Longitudinal analysis not only reveals recent performance but also helps determine if it aligns with broader long-term trends. Prioritize companies with sustained EPS growth, as they typically have stronger market competitiveness.
Future Expectations
When assessing future stock potential, combine historical EPS growth rates with analyst projections. Historical data provides context, but future expectations drive stock price trends.
- Focus on analyst EPS forecasts to gauge a company’s sustained growth potential.
- If a company’s EPS has grown consistently over recent years and analysts predict continued increases, it often signals high investment value.
- Use the P/E ratio alongside EPS for valuation. The P/E ratio is calculated by dividing the stock price by EPS, showing the relationship between stock price and earnings.
| Metric | Formula | Purpose |
|---|---|---|
| P/E Ratio | Market Price per Share / EPS | Shows how much investors pay per dollar of earnings |
| EPS Growth Rate | (Current EPS - Prior EPS) / Prior EPS | Reflects the speed of profitability growth |
By combining P/E and EPS growth rates, you can assess whether a company’s valuation is reasonable. A high P/E with strong EPS growth suggests market confidence in future growth, while a high P/E with slow EPS growth warrants caution for potential overvaluation.
Tip: Combining historical data and future projections enhances the accuracy of stock potential assessments, improving investment decisions.
EPS Analysis Pitfalls
Risks of Focusing Solely on EPS
Focusing only on EPS when analyzing a company can lead to pitfalls. While EPS reflects profitability at a given moment, it doesn’t capture the full picture. Many investors overlook inflation’s impact, assuming EPS growth indicates business expansion or efficiency gains. In reality, some EPS growth stems from inflation rather than operational improvements.
You may also encounter companies with high EPS but equally high stock prices, leading to elevated P/E ratios, indicating potential overvaluation. Relying solely on EPS for valuation may cause you to miss a company’s true market potential. Many view EPS and P/E as core valuation metrics, but they don’t directly reflect future cash flows or growth prospects.
Professional investors typically combine EPS with P/E, ROI, and other metrics to comprehensively assess profitability and growth. Avoid relying on a single metric to prevent a narrow perspective.
Common pitfalls include:
- Ignoring inflation’s impact on EPS
- Focusing on high EPS while overlooking high valuation risks
- Assuming EPS and P/E fully reflect company value
- Neglecting future cash flows and growth potential
Ignoring Industry and Environment
Ignoring industry cycles and macroeconomic conditions when analyzing EPS can lead to misjudgments. Different industries have unique profit models and cycle characteristics, with industry cycles significantly impacting stock valuations. The table below outlines key factors affecting EPS analysis:
| Factor | Description |
|---|---|
| Industry Cycles | Industry cycle changes affect profitability, and overlooking them may lead to misjudgments. |
| Financial Components | Financial structures impact EPS differently across business cycles. |
| Economic Uncertainty | Macroeconomic fluctuations influence investor decisions, and ignoring them may lead to portfolio misadjustments. |
You must also consider market conditions and industry benchmarks. Professional investors combine EPS growth, industry performance, and market conditions to assess sustained growth potential. Research shows expected EPS growth rates are critical in value investment strategies, but relying on a single forecasting method may introduce bias. Use recurring EPS and other financial metrics alongside multi-dimensional data to enhance investment judgment accuracy.
When investing, only by analyzing EPS, industry cycles, market conditions, and other financial data can you accurately assess a company’s true stock potential, avoiding common analysis pitfalls.
When investing, you can use EPS as a key reference for judging stock potential:
- EPS helps evaluate financial health and profitability, with investors typically focusing on EPS growth and reasonable valuations.
- Be aware that EPS may be influenced by non-recurring events, failing to fully reflect all business performance.
- Changes in accounting standards affect EPS comparability across companies and periods, requiring additional context.
- Combine analyst expectations, growth trends, and industry conditions to enhance the scientific rigor of investment decisions.
FAQ
Can EPS alone determine stock prices?
You cannot judge stock prices solely with EPS. It’s a reference for profitability, but you must also analyze P/E ratios, industry trends, and growth potential.
Why do some companies have high EPS but low stock prices?
You may find companies with high EPS but poor industry prospects or low market confidence, leading to low stock prices. Consider market conditions and future growth comprehensively.
What’s the relationship between EPS and P/E ratio?
You can use the P/E ratio to gauge valuation, calculated as stock price divided by EPS. A high P/E suggests market confidence in future growth but may indicate overvaluation risks.
Does EPS growth always indicate improved company performance?
When you see EPS growth, don’t assume improved performance. EPS may be affected by one-time gains or accounting adjustments. Exclude non-recurring items to focus on core business performance.
How do you compare EPS across industries?
You cannot directly compare EPS across industries due to differing profit models. Use industry averages and characteristics to assess a company’s competitiveness within its sector.
Analyzing a company’s stock price potential through earnings per share (EPS) empowers you to make informed investment decisions. However, global investing often comes with challenges like high remittance fees, exchange rate volatility, and concerns about platform reliability, which can diminish returns or complicate transactions.
BiyaPay offers a seamless solution to these hurdles. Our platform provides real-time exchange rate queries, ensuring transparent conversions between fiat and digital currencies across a wide range of options. With remittance fees as low as 0.5%, covering most countries worldwide and enabling same-day transfers, BiyaPay guarantees efficiency and trust. Plus, you can invest in US and Hong Kong stocks via our stocks feature without needing an overseas account, enhancing your EPS-driven investment strategy. Sign up with BiyaPay today to streamline your global investments and maximize your stock analysis potential!
*This article is provided for general information purposes and does not constitute legal, tax or other professional advice from BiyaPay or its subsidiaries and its affiliates, and it is not intended as a substitute for obtaining advice from a financial advisor or any other professional.
We make no representations, warranties or warranties, express or implied, as to the accuracy, completeness or timeliness of the contents of this publication.
Related Blogs of

Enterprise Overseas Payroll Compliance and Tax Planning: How to Use Multi-Asset Payroll Platforms to Reduce Cross-Border Employment Costs?


Pay for Perplexity Pro Subscription with USDT: Bypass Regional Payment Restrictions


Patreon/OnlyFans and Other Overseas Creator Platforms Payout: Ultimate Tricks to Bypass Domestic Bank Forex Review for Withdrawal


How Do European International Students Pay the Final Installment for a Used Car? Digital Payment Methods to Avoid SEPA Transfer Delays Caused by Weekend Bank Closures

Choose Country or Region to Read Local Blog

Contact Us


BIYA GLOBAL LLC is registered with the Financial Crimes Enforcement Network (FinCEN), an agency under the U.S. Department of the Treasury, as a Money Services Business (MSB), with registration number 31000218637349, and regulated by the Financial Crimes Enforcement Network (FinCEN).
BIYA GLOBAL LIMITED is a registered Financial Service Provider (FSP) in New Zealand, with registration number FSP1007221, and is also a registered member of the Financial Services Complaints Limited (FSCL), an independent dispute resolution scheme in New Zealand.