How the Fear and Greed Index Impacts US Pre-Market Action: Complete Market Sentiment Analysis


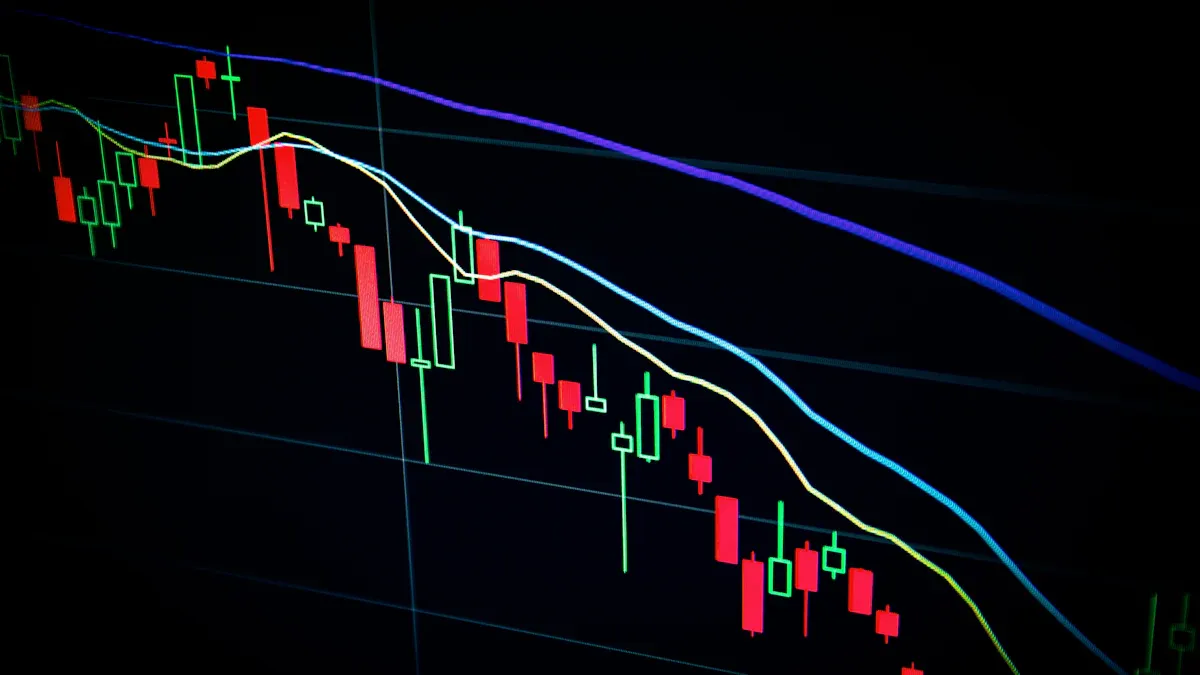
Image Source: unsplash
In US stocks pre-market, when your holdings gap sharply higher, should you add to the position or take profits? When the price drops, is it a panic sell-off signal or a bargain-hunting opportunity? The answers to these decisions are often hidden in the market’s collective sentiment. The “Fear and Greed Index” is the key to interpreting these pre-market signals. Many traders overlook that pre-market moves do not necessarily carry through after the open.
Trader’s Note: Pre-Market Signal Traps
- Low-volume price gaps often reverse after the opening bell.
- Only combining pre-market volatility with high volume reveals more reliable trading opportunities.
This article provides a clear analytical framework to help you combine market sentiment with price-volume data for more rational decisions.
Key Takeaways
- The Fear and Greed Index acts as a thermometer for market sentiment, helping you time entries and exits.
- Extreme fear can signal buying opportunities; extreme greed warns of an overheated market.
- Combining overall market sentiment with individual stock price-volume changes creates more effective strategies.
- Price rising on shrinking volume is a warning sign — upward momentum may be insufficient.
- When market sentiment diverges from an individual stock’s movement, hidden opportunities often appear.
Understanding Market Sentiment: Fear and Greed Index Basics
Image Source: unsplash
Before analyzing pre-market action, you must first learn to read the market’s “temperature,” and CNN’s “Fear and Greed Index” is your thermometer. The index ranges from 0 (extreme fear) to 100 (extreme greed), giving you a clear snapshot of current market mood.
Think of it as a composite score that averages seven key market indicators with equal weighting to assess whether investors are fearful or greedy.
- Stock Price Momentum: The S&P 500’s position relative to its 125-day moving average.
- Stock Price Strength: Number of NYSE stocks hitting 52-week highs versus lows.
- Stock Price Breadth: Volume in rising stocks versus falling stocks.
- Put/Call Options: Put-to-call volume ratio.
- Junk Bond Demand: Yield spread between investment-grade and junk bonds.
- Market Volatility: Performance of the VIX index.
- Safe Haven Demand: Stocks versus Treasury bonds performance.
Pre-Market Signals in Extreme Fear Zones
When the index falls into the 0–25 “extreme fear” range, the market is engulfed in extreme pessimism. This typically occurs after a sharp sell-off. Historical data shows many long-term market bottoms form here, such as during the 2008 financial crisis and early 2020 pandemic.
Trader’s Note: Contrarian Opportunity When the US pre-market shows extreme fear on the index but your stock shows signs of stabilizing, it may not be a panic sell signal — instead, it can be a prime buying opportunity for brave investors.
Pre-Market Signals in Extreme Greed Zones
Conversely, when the index surges to 75–100 “extreme greed,” market sentiment is extremely optimistic and investors are aggressively taking risk. However, this can also signal overheating. For example, in January 2020 the index briefly exceeded 90, and shortly afterward the market corrected sharply due to the pandemic.
Warning ⚠️ When the index is in extreme greed, the market may already be overbought. Chasing highs carries extreme risk — consider taking profits in stages rather than blindly adding.
Interpreting Neutral Zone Signals
When the index lingers in the 25–75 neutral range, sentiment is relatively balanced between fear and greed. In this case, the index has lower predictive value. Your decisions should rely more on individual stock fundamentals, earnings performance, and technical patterns rather than over-relying on a single sentiment gauge.
Building US Pre-Market Response Strategies
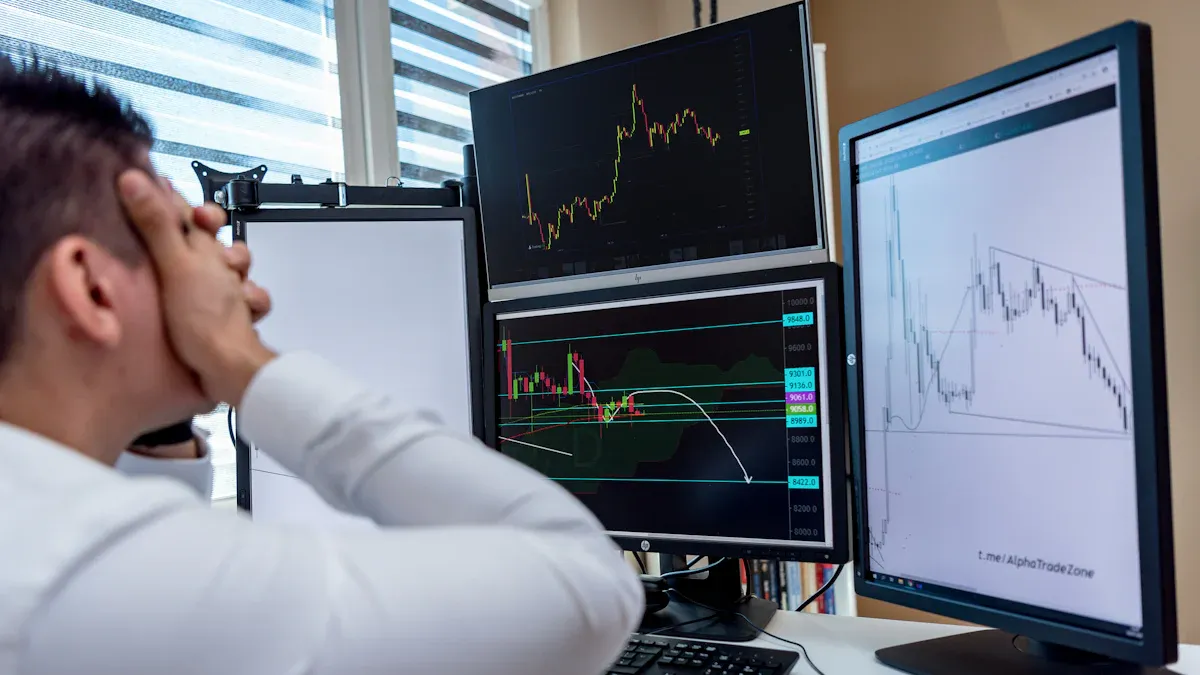
Image Source: pexels
Once you can read the market’s temperature, the next step is turning sentiment data into concrete trading strategies. Simply knowing the market is fearful or greedy is not enough — you must combine it with pre-market price-volume behavior to create actionable plans. The following four strategies teach you how to assess risk and find opportunities in different scenarios.
Strategy 1: Price Falling on Rising Volume in Fear
Warren Buffett’s famous quote: “Be fearful when others are greedy, and greedy when others are fearful.” When the market plunges into extreme fear, that’s when you should open your eyes wide for opportunities.
Scenario: Fear and Greed Index below 25, pervasive pessimism. Your watched stock shows “price falling on rising volume” in US pre-market — price declines but volume surges significantly. “Rising volume” here means volume far exceeds its 10-day pre-market average, indicating heavy turnover.
This is a classic bull-bear battle signal. Though falling price is unsettling, expanding volume means panic selling is being absorbed by strong buying. This can be a potential bottom reversal signal.
| Analysis Dimension | Observation Indicator | Interpretation & Strategy |
|---|---|---|
| Market Sentiment | Fear and Greed Index < 25 | Market overly pessimistic, assets likely undervalued. |
| Market Volatility | VIX > 30 (even 40+) | Extreme panic, often the peak of short-term selling pressure. |
| Individual Stock Pre-Market | Price down, volume sharply higher | Heavy panic selling met by aggressive buying — signs of stabilization. |
Trader’s Note: How to distinguish “panic mispricing” from “fundamental deterioration”? Before getting greedy, take a minute to evaluate the company. Smart investors focus on fundamentals, not sentiment. Ask yourself:
- Has the long-term investment thesis changed?
- Is the business model still solid?
- Does it still hold a competitive advantage in its industry?
If the answer is yes to all, the decline is likely just market panic mispricing — offering a chance to buy quality assets at a discount.
Strategy 2: Price Rising on Rising Volume in Greed
Scenario: Fear and Greed Index above 75, extreme optimism. Your stock shows “price rising on rising volume” in pre-market — both price and volume soaring, looking bullish.
Stay highly alert. While price and volume rising together is a sign of strength, in extreme greed it can be “the final fireworks.” When everyone is bullish and chasing, upward momentum is often nearing exhaustion and correction risk is building fast.
| Analysis Dimension | Observation Indicator | Interpretation & Strategy |
|---|---|---|
| Market Sentiment | Fear and Greed Index > 75 | Market overly optimistic, assets likely overvalued, chasing risk extreme. |
| Market Volatility | VIX < 20 | Low-volatility complacency, easy to ignore hidden risks. |
| Individual Stock Pre-Market | Price up, volume sharply higher | Euphoria high, but may be the final push before momentum fades. |
Warning Signs ⚠️ Overheating Indicators When you see these, consider taking profits in stages instead of adding:
- Index overstretched: S&P 500 far above its long-term moving average (e.g., 125-day).
- Sector-wide overbought: Not just your stock — entire tech or related sectors are technically extremely overbought.
- Media hype: When mainstream financial media are all covering the rally, retail is usually fully in — the top is near.
Strategy 3: Price Rising on Shrinking Volume Warning
Scenario: Sentiment can be anywhere, but a stock rises in pre-market while volume fails to follow or is even lower than usual.
This is a highly cautionary signal known as “price-volume divergence.” Rising price without volume support means buying conviction is weak and participation low. Such gains are often unsustainable — like a sandcastle that collapses easily once regular-hours volume arrives.
- Weak conviction: Low-volume gains show little market agreement at higher prices.
- Lack of momentum: Not enough buying power to sustain the uptrend — reversal possible anytime.
- Potential trap: Could be intentional pumping by large players to distribute at the open.
In pre-market, where overall volume is already thin, “price rising on shrinking volume” demands extra caution. It suggests the day’s gains may lack a solid foundation.
Strategy 4: Handling Sentiment vs Price Divergence
The most interesting opportunities arise when market sentiment and individual stock price action “diverge.” These divergence signals help uncover mispriced opportunities.
| Divergence Type | Market Sentiment (Fear & Greed) | Individual Stock Pre-Market Action | Interpretation & Strategy |
|---|---|---|---|
| Bullish Divergence | Extreme Fear (broad sell-off) | Your stock flat or slightly up with decent volume support | Stock shows strong internal support, unaffected by panic. Likely to lead when sentiment rebounds — excellent buy signal. |
| Bearish Divergence | Extreme Greed (broad rally) | Your stock flat or down, lagging the market | Internal issues (e.g., upcoming bad news) keeping money away. Potential sell/avoid signal — do not chase. |
When you spot divergence, it’s the perfect time to dig into the company’s fundamentals. It often foreshadows an upcoming trend change.
Real-World Application and Advanced Techniques
Theory must be validated in practice. After learning the strategies, let’s review real cases and how to combine other indicators for more complete analysis.
Historical Case Review
Reviewing history is the best teacher. The March 2020 COVID-19 market crash is a textbook example. Global markets collapsed on pandemic fear, with Bitcoin dropping over 50% in days.
That collective panic was directly reflected in the index. The Fear and Greed Index fell to a historic low of 8, with doomsday despair everywhere. Yet that extreme pessimism created a once-in-a-lifetime opportunity.
History’s Lesson In March 2020, when the index showed “extreme fear,” Bitcoin bottomed around $3,782. Just months later, a massive recovery began, eventually reaching all-time highs in 2021. This perfectly proves the wisdom of “be greedy when others are fearful.”
Strengthen Judgment with the VIX Index
Although the Fear and Greed Index already includes the VIX, observing VIX separately gives sharper insight into “real-time panic.” Think of the Fear and Greed Index as a chronic illness indicator and VIX as an acute attack alarm.
When you see a pre-market signal, combine them like this:
| Indicator | Characteristics | How to Interpret |
|---|---|---|
| Fear and Greed Index | Comprehensive, slower | Provides macro sentiment background and market phase. |
| VIX Index | Focused, fast-reacting | Measures expected 30-day volatility — instant panic gauge. |
When Fear and Greed is low and VIX simultaneously spikes above 30 or 40, it’s a powerful market bottom reversal signal — far more reliable than either alone.
Risk Reminder: Limitations of Sentiment Indicators
Before adding the Fear and Greed Index to your toolkit, understand its limitations. No indicator is perfect — it’s an auxiliary tool, not the sole decision basis.
Keep these points in mind:
- It reflects the past: The index is calculated from historical data — it summarizes past sentiment, not a reliable crystal ball for the future.
- It’s short-term biased: Highly sensitive to news and short-term swings, which can produce inconsistent signals in long-term trends.
- Not for every strategy: Very useful for short-term traders. Long-term investors who over-focus on daily sentiment swings may make decisions that stray from their goals.
Ultimately, smart traders combine market sentiment, technical analysis, and company fundamentals for the most complete judgment.
Successful trading decisions come from blending macro market sentiment (Fear and Greed Index) with micro individual stock price-volume behavior, not relying on just one.
The four strategies in this article help you handle “extreme fear,” “extreme greed,” and “divergence” scenarios. Starting today, add the “Fear and Greed Index” to your analysis toolbox and track it via platforms like Grafana to practice reading sentiment and turn it into your trading edge.
FAQ
Should I check this index every day?
Not necessarily. It’s more valuable for short-term traders. Long-term investors who obsess over daily sentiment swings may end up making decisions that deviate from their long-term goals.
Where can I find the index?
You can find the latest “Fear & Greed Index” directly on the CNN Business website. Many financial data platforms and charting software also integrate it for easy real-time tracking.
Does this index only apply to the broad US market?
Yes, the index primarily reflects overall US stock market sentiment, especially the S&P 500. It does not directly apply to evaluating individual stocks or non-US markets.
How long does the index stay at extreme levels?
There’s no fixed answer. Sentiment can remain extreme for days or even weeks. Do not treat extreme readings as immediate reversal signals — view them as warning or opportunity zones and combine with other tools for judgment.
*This article is provided for general information purposes and does not constitute legal, tax or other professional advice from BiyaPay or its subsidiaries and its affiliates, and it is not intended as a substitute for obtaining advice from a financial advisor or any other professional.
We make no representations, warranties or warranties, express or implied, as to the accuracy, completeness or timeliness of the contents of this publication.
Related Blogs of

Want to Predict A-Share Market Moves? Understanding These 5 Macro Signals Is Enough


Like a Snowball: Let Shanghai Stock Market Index Make Your Money Work for You


In-Depth Review: After ChiNext Dropped Over 1% and Rebounded, Who Will Be Tomorrow’s A-Share Leader?


How to Wire Transfer USD from Industrial and Commercial Bank of China to OCBC Singapore? This Guide is All You Need

Choose Country or Region to Read Local Blog

Contact Us


BIYA GLOBAL LLC is a licensed entity registered with the U.S. Securities and Exchange Commission (SEC No.: 802-127417); a certified member of the Financial Industry Regulatory Authority (FINRA) (Central Registration Depository CRD No.: 325027); regulated by the Financial Industry Regulatory Authority (FINRA) and the U.S. Securities and Exchange Commission (SEC).
BIYA GLOBAL LLC is registered with the Financial Crimes Enforcement Network (FinCEN), an agency under the U.S. Department of the Treasury, as a Money Services Business (MSB), with registration number 31000218637349, and regulated by the Financial Crimes Enforcement Network (FinCEN).
BIYA GLOBAL LIMITED is a registered Financial Service Provider (FSP) in New Zealand, with registration number FSP1007221, and is also a registered member of the Financial Services Complaints Limited (FSCL), an independent dispute resolution scheme in New Zealand.