Read US Stock Charts Like a Pro: Candlestick Patterns Are Your Wealth Map


Image Source: pexels
Have you ever chased highs and cut lows in the stock market, feeling helpless watching realized losses?
In fact, every US stock chart is speaking to you. Candlestick patterns are the language of the market. Once you learn to interpret them, your trading will shift from guesswork to evidence-based decisions. This article gives you the most practical buy and sell signals directly, helping you build a clear trading logic without needing to learn complex and difficult theories.
Key Takeaways
- Candlestick charts show the battle between buyers and sellers; green candles represent gains, red candles represent losses.
- Long shadows indicate price encountering resistance or support — a potential reversal signal.
- Hammer, morning star, and bullish engulfing are common bottom buy signals.
- Hanging man, evening star, and bearish engulfing are common top sell signals.
- Combining volume, support/resistance lines, and moving averages significantly improves judgment accuracy.
Candlestick Chart Basics: Understanding Bullish and Bearish Forces
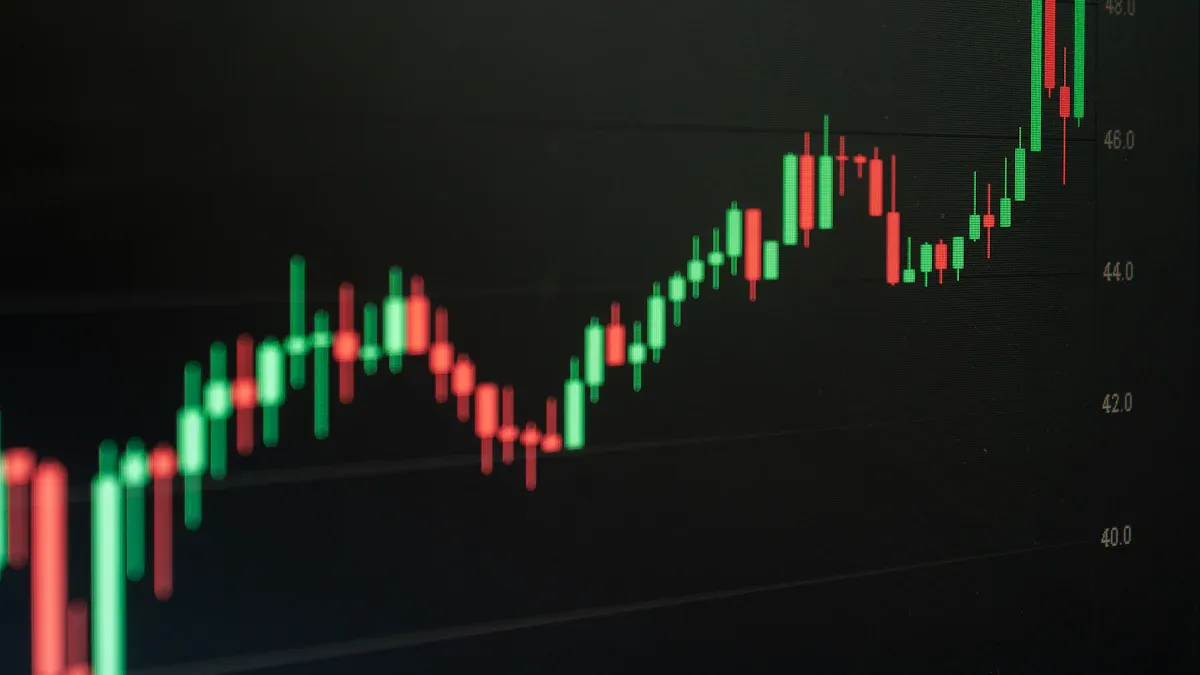
Image Source: pexels
Before learning any complex trading strategy, you must first master the most basic element: a single candlestick. Each candlestick is a microcosm of the fierce battle between bulls and bears within a specific time frame (e.g., one day or one hour). Understanding it gives you the foundation for analyzing US stock charts.
Anatomy of a Single Candlestick: Open, High, Low, Close
A candlestick consists of a “body” and “wicks” (shadows), recording four key prices that together tell a price story:
- Open: The first traded price when the period begins.
- Close: The last traded price when the period ends.
- High: The highest price reached during the period.
- Low: The lowest price touched during the period.
The body is formed by the open and close prices, while the wicks extend to the high and low.
Green vs Red Candles: US Stock Market Convention
In the US market, the color convention is opposite to that of the Taiwanese market — remember this well:
- Green candle: Represents an up day. The close is higher than the open, meaning buyers dominated.
- Red candle: Represents a down day. The close is lower than the open, meaning sellers were stronger.
Just remember “US stocks: green up, red down” and you won’t confuse market direction.
What Shadows Tell You: Signals of Pressure and Support
Shadows are the traces left after the tug-of-war between buyers and sellers, revealing important market signals.
- Long upper shadow: Price was pushed higher by buyers but eventually forced back strongly by sellers. This indicates selling pressure overhead, especially in an uptrend — a potential reversal warning.
- Long lower shadow: Price was beaten down by sellers, but buyers stepped in aggressively at the lows and pushed it back up. This shows strong buying support below, suggesting a potential bullish opportunity.
You can quickly judge the meaning of shadows with the table below:
| Shadow Type | Position | Market Signal | Trading Implication |
|---|---|---|---|
| Upper shadow | Above body | Sellers in control | Possible reversal in an uptrend |
| Lower shadow | Below body | Buyers in control | Possible reversal in a downtrend |
Key Buy Signals: 3 Major Bottom Reversal Patterns
After learning the language of single candlesticks, the next step is to combine them to read stronger market narratives. When a stock has been falling for some time, what you need most are “bottom reversal” signals. These candlestick combinations are the market telling you: “The downward momentum may be exhausted, and the bulls are preparing a counterattack.”
Important Concept: These buy signals become much more reliable when they appear in a known “key support zone.” Support zones act like a floor for the price. When a reversal signal forms on that floor, it shows strong defensive intent from buyers.
Next, we introduce the three most classic and effective bottom reversal patterns in US stocks.
Buy Signal 1: Hammer and Inverted Hammer
The hammer and inverted hammer are single-candle reversal signals that suggest exhaustion of selling pressure.
- Hammer: Has a long lower shadow and a small body. It looks like a hammer, telling you the market is “hammering out” a bottom. During the session, sellers pushed the price sharply lower, but buyers fought back strongly before the close, pulling the price near the open.
- Inverted Hammer: The opposite appearance — long upper shadow and small body. It suggests buyers tried to push the price higher but were pushed back; however, sellers lacked the strength to create a new low.
How to Identify a Valid Hammer?
Confirm a valid hammer by checking these characteristics:
- Location: Appears after a clear downtrend.
- Body: Small body located at the top of the candle’s range.
- Lower shadow: Very long, at least twice the length of the body.
- Upper shadow: Almost none or very short.
- Color: A green-bodied hammer (close > open) gives a stronger bullish signal than a red one, but both are valid.
Pro Tip: Statistically, when a hammer appears at a key support level, its reversal success rate can reach up to 85%. This is a powerful signal you cannot ignore.
Real-World Example: In Tesla ($TSLA) historical charts, inverted hammers have appeared, signaling a pause in a downtrend followed by a rebound.
Buy Signal 2: Morning Star
The morning star is a powerful three-candle bottom reversal pattern. Its appearance is like dawn after a dark night, signaling the market is about to brighten.
This pattern tells a clear psychological turning story:
- First candle (Night): A large red candle — the market is dominated by pessimism, sellers fully in control.
- Second candle (Star): A very small-bodied candle (can be red or green) that gaps down from the first. This shows selling momentum has stalled, the market enters hesitation and uncertainty, with bulls and bears briefly balanced.
- Third candle (Dawn): A strong green candle that closes well into the body of the first red candle (usually more than halfway). This shows buyers have taken control and sentiment has turned positive.
Special Note: If the middle candle is a “doji” (open ≈ close), the indecision is even stronger, making the entire morning star pattern more reliable!
Real-World Example: In late December 2018, Best Buy ($BBY) formed a classic morning star. After a large red candle on Dec 21, a small-body candle appeared on Dec 24, followed by a large green candle on Dec 26 that recovered most of the loss, leading to a significant rally.
Buy Signal 3: Bullish Engulfing
The bullish engulfing is a two-candle reversal pattern with strong visual impact, directly declaring an overwhelming victory for buyers.
The formation is straightforward: in a downtrend, a small red candle is followed by a large green candle, whose body completely covers or “engulfs” the body of the previous red candle.
How to Identify a Bullish Engulfing?
Judge according to these rules:
- Trend: Must appear in a downtrend.
- First candle: A down (red) candle.
- Second candle: An up (green) candle.
- Engulfing relationship: The green candle’s body must completely cover the red candle’s body — meaning the green candle opens lower than the red candle’s close and closes higher than the red candle’s open.
Judgment Tip: Only focus on the bodies. Even if the first candle’s shadows extend beyond the second candle, as long as the body is fully engulfed, the pattern is valid.
When a bullish engulfing appears at a known support level, it’s like buyers launching a full-scale attack on a critical defense line — the reliability of this buy signal increases dramatically.
Clear Sell Signals: 3 Major Top Reversal Patterns
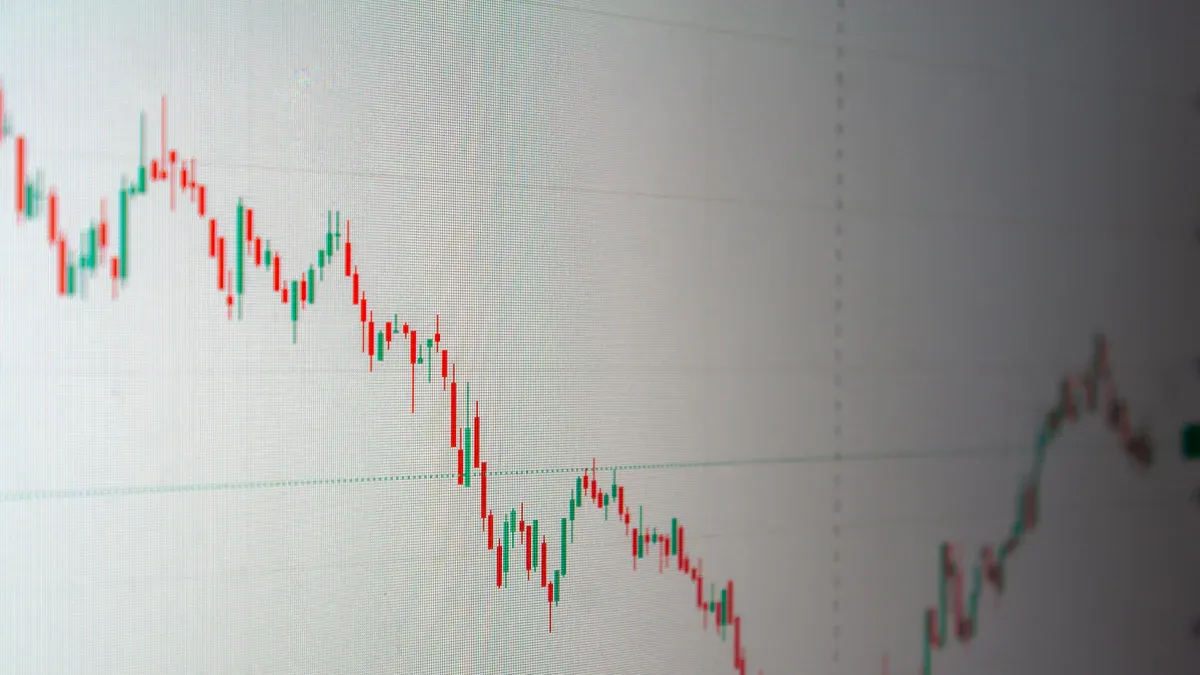
Image Source: unsplash
Learning to find buying opportunities at bottoms is only half the battle. A successful trader must also recognize risk at tops. After a rally, stay vigilant and look for signals that suggest “the party may be ending.” These top reversal patterns are the market’s warning lights telling you to consider taking profits or reducing positions.
Trading Mindset: Successful trading is not just about buying right — it’s even more about selling smart. Ignoring sell signals can turn paper profits into nothing.
Next, we introduce the three most common and critical top reversal patterns in US stocks.
Sell Signal 1: Hanging Man and Shooting Star
The hanging man and shooting star are powerful single-candle reversal warnings. They look almost identical to the hammer and inverted hammer you’ve learned, but their location and meaning are completely opposite.
- Hanging Man: Appears after an uptrend, looks like a hammer (small body, long lower shadow). It suggests that although buyers tried to hold the price during the session, heavy selling pressure emerged, indicating possible exhaustion of bullish strength.
- Shooting Star: Appears after an uptrend, looks like an inverted hammer (small body, long upper shadow). It paints a picture of buyers attempting to charge higher but being brutally shot down by sellers from above — a very clear bearish signal.
Although the hanging man and hammer look the same, you must interpret them based on context. One is hope at the bottom, the other is a warning at the top.
| Feature | Hammer | Hanging Man |
|---|---|---|
| Context | After downtrend, usually near support | After uptrend, usually near resistance or after strong rally |
| Market Psychology | Buyers step in as sellers weaken | Sellers appear while buyers are strong, showing underlying weakness |
| Expected Outcome | Potential bullish reversal | Potential bearish reversal |
| Research Support | ~60% lead to bullish reversal | ~55% lead to bearish reversal |
Pro Tip: The shooting star is particularly noteworthy. Statistics show a standalone shooting star has a ~50–60% chance of predicting a decline. When combined with other factors (e.g., at key resistance with unusually high volume), success rate can rise to 60–70%.
Sell Signal 2: Evening Star
The evening star is the evil twin of the morning star — a three-candle top reversal pattern. When it appears at highs, it’s like the sun setting and night falling, signaling the market may enter a period of darkness.
The pattern clearly shows sentiment shifting from optimism to pessimism:
- First candle (Sunset): A strong green candle — the market is full of optimism, buyers in full control.
- Second candle (Star): A very small-bodied candle (red or green) that gaps higher. This shows upward momentum has suddenly stalled, with bulls and bears deadlocked at highs.
- Third candle (Night): A large red candle that closes deep into the body of the first green candle. This indicates sellers have taken over and sentiment has reversed.
As with the morning star, a doji as the middle candle makes the indecision extreme, strengthening the bearish signal of the entire evening star.
Real-World Scenario: Imagine a major tech stock that has rallied for weeks and is approaching an all-time high resistance level. A textbook evening star appears on the daily chart, with the third red candle accompanied by huge volume. This is a very strong warning that the bull run may be over.
Sell Signal 3: Bearish Engulfing
The bearish engulfing is a visually dramatic two-candle reversal. Its appearance is like the bears swallowing the bulls’ last line of defense in one bite.
Identification is very intuitive: in an uptrend, a small green candle is followed by a large red candle whose body completely engulfs the previous green candle’s body.
How to Identify a Bearish Engulfing?
- Trend: Must appear in an uptrend.
- First candle: An up (green) candle.
- Second candle: A down (red) candle.
- Engulfing relationship: The red candle’s body must completely cover the green candle’s body.
Judgment Tip: Think of it as market enthusiasm (small green candle) being instantly doused by a huge bucket of cold water (large red candle). This extreme emotional contrast is why it’s so powerful. Historical data shows that after a confirmed bearish engulfing, stocks can fall on average 5% to 10%.
In Alphabet (GOOGL) historical charts, bearish engulfing patterns have appeared, foreshadowing trend changes. When you see this signal at the top of an uptrend, especially near key resistance, stay highly alert.
Practical Application: Optimize Your US Stock Chart Analysis
You’ve now learned to recognize key candlestick reversal signals, but the difference between pros and beginners is that pros never rely on a single signal. True professional analysis combines candlestick patterns with other tools for multi-dimensional confirmation. This filters out noise and lets you act only when the odds are highest.
Technique 1: Use Volume to Confirm Signal Strength
Volume is an amplifier of market sentiment — it reveals the real power behind a signal. A candlestick pattern without volume support is like a performance with no audience — it lacks conviction.
Volume Confirmation Rules:
- High volume = Strong signal: When a bullish reversal pattern (e.g., bullish engulfing) appears with volume far above average (e.g., 2–3 times the average), it means heavy buying is pouring in — extremely high reliability.
- Low volume = Weak signal: Conversely, if a bearish reversal pattern (e.g., shooting star) appears at resistance but volume is quiet, it may be a false alarm — sellers lack strength to reverse the trend.
Think of volume as the gas pedal. A beautiful candlestick pattern is the steering wheel, but only pressing the gas (high volume) makes the car go fast and far.
Technique 2: Combine Support and Resistance Lines to Find Key Levels
Candlestick reversal signals are not equally effective everywhere. Their power multiplies when they appear at “key levels”. These key levels are the support and resistance lines you must learn to draw.
- Support Line: Connect past price lows (valleys) to form a price floor.
- Resistance Line: Connect past price highs (peaks) to form a price ceiling.
Pro Strategy: When a bullish “hammer” forms exactly on a repeatedly tested strong support line, it is an extremely high-quality buy signal. It tells you buyers not only stopped further decline but launched a counterattack on a critical strategic line.
Technique 3: Use Moving Averages to Boost Win Rate
Moving averages help you quickly determine the long-term trend direction, allowing you to trade with the trend instead of against it. When analyzing US stock charts, pay special attention to the 50-day and 200-day moving averages.
Follow this simple rule:
| Price vs MA Relationship | Trend Meaning | Trading Strategy |
|---|---|---|
| Price above 200-day MA | Long-term uptrend | Prioritize executing “buy signals” |
| Price below 200-day MA | Long-term downtrend | Prioritize executing “sell signals” |
Powerful Confirmation Signal: Golden Cross — when the shorter-term MA (e.g., 50-day) crosses above the longer-term MA (e.g., 200-day), it’s a strong bullish signal indicating a potential long-term bull market. Bottom reversal candlesticks appearing after a golden cross have significantly higher success rates.
You have now mastered core signals like hammer, morning star, and engulfing patterns, giving you a high-probability decision framework. Although studies show these patterns have decent success rates, candlesticks alone are not enough for a complete trading plan.
The real key is comprehensive judgment combining volume, support/resistance, and moving averages. Open your charting software now, practice identifying the patterns you learned today on real US stock charts, and turn knowledge into real trading skills!
FAQ
Can I consistently profit just by using candlestick patterns?
No. Candlestick patterns are an important basis for decision-making, but never the only one. You must combine volume, support/resistance, and moving averages for comprehensive judgment to significantly increase your win rate.
When is the best time to enter after a candlestick signal appears?
A conservative and effective method: wait for the next candle after the signal. If the next candle confirms the direction (e.g., a green up candle after a morning star), then enter. This filters out many false signals.
What if a candlestick reversal signal fails?
Signal failure is part of trading. This is exactly why setting a “stop-loss” is crucial. When price moves against you and breaks your stop-loss level, exit decisively to control losses.
Do these candlestick patterns work on all timeframes?
Yes. Whether you’re analyzing daily, weekly, or even hourly charts, the interpretation logic is the same. However, signals on longer timeframes (daily, weekly) are generally more reliable than those on shorter timeframes.
*This article is provided for general information purposes and does not constitute legal, tax or other professional advice from BiyaPay or its subsidiaries and its affiliates, and it is not intended as a substitute for obtaining advice from a financial advisor or any other professional.
We make no representations, warranties or warranties, express or implied, as to the accuracy, completeness or timeliness of the contents of this publication.
Related Blogs of

Volume-Price Rising Together or Diverging? Complete A-Share Practical Trading Strategy Guide


How to Wire Transfer USD from Industrial and Commercial Bank of China to OCBC Singapore? This Guide is All You Need


Another Major Drop! Why Is the A-Share Index Falling Non-Stop – Where Exactly Is the Problem?


Like a Snowball: Let Shanghai Stock Market Index Make Your Money Work for You

Choose Country or Region to Read Local Blog

Contact Us


BIYA GLOBAL LLC is a licensed entity registered with the U.S. Securities and Exchange Commission (SEC No.: 802-127417); a certified member of the Financial Industry Regulatory Authority (FINRA) (Central Registration Depository CRD No.: 325027); regulated by the Financial Industry Regulatory Authority (FINRA) and the U.S. Securities and Exchange Commission (SEC).
BIYA GLOBAL LLC is registered with the Financial Crimes Enforcement Network (FinCEN), an agency under the U.S. Department of the Treasury, as a Money Services Business (MSB), with registration number 31000218637349, and regulated by the Financial Crimes Enforcement Network (FinCEN).
BIYA GLOBAL LIMITED is a registered Financial Service Provider (FSP) in New Zealand, with registration number FSP1007221, and is also a registered member of the Financial Services Complaints Limited (FSCL), an independent dispute resolution scheme in New Zealand.