- EasyCard
- Trade
- Help
- Announcement
- Academy
- SWIFT Code
- Iban Number
- Referral
- Customer Service
- Blog
- Creator
How To Trade SPY And Top Tech Stocks Using Technical Analysis


Image Source: pexels
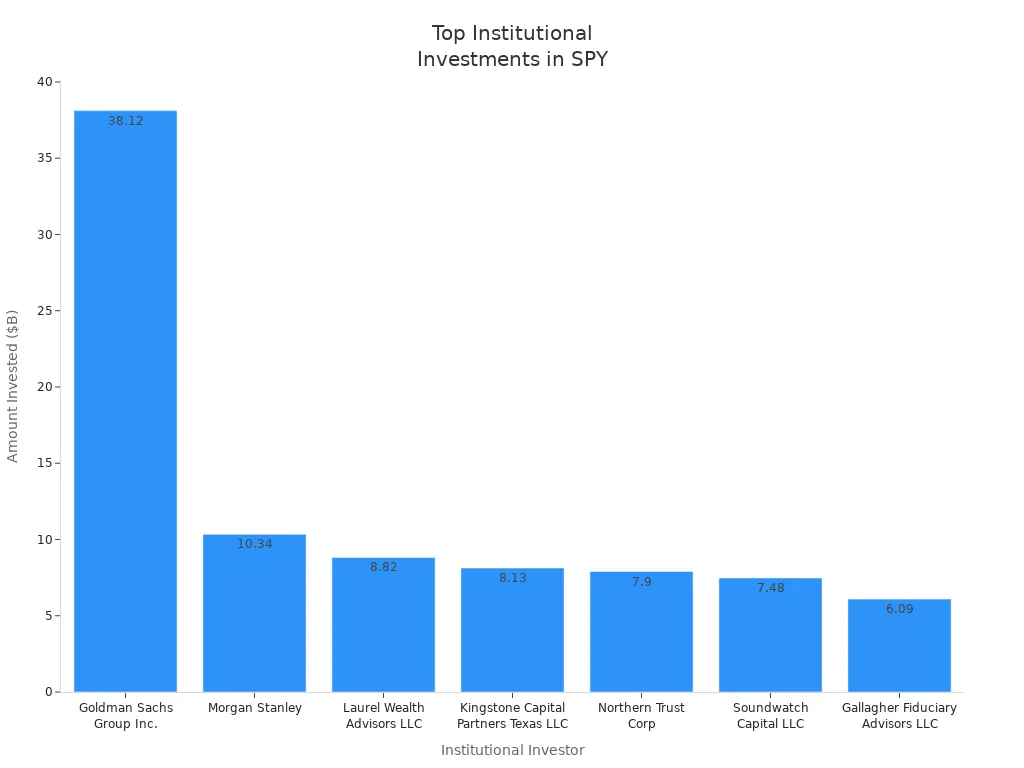
You can trade SPY and top tech stocks by using technical analysis to spot key price levels and trends. Support and resistance help you see where prices might reverse. Moving averages, MACD, and RSI show you if a stock is strong or weak. Stop-loss orders protect you from big losses. SPY attracts high trading volume from both retail and institutional investors. For example, Goldman Sachs Group Inc. has invested over $38 billion in SPY, which shows strong interest from large players.
| Institutional Investor | Amount Invested ($B) |
|---|---|
| Goldman Sachs Group Inc. | 38.12 |
| Morgan Stanley | 10.34 |
| Laurel Wealth Advisors LLC | 8.82 |
| Kingstone Capital Partners Texas LLC | 8.13 |
| Northern Trust Corp | 7.90 |
| Soundwatch Capital LLC | 7.48 |
| Gallagher Fiduciary Advisors LLC | 6.09 |
| Total Institutional Ownership (%) | 63.54% |
| Total Shares Bought by Institutions | 226,612,470 |
| Total Transaction Value | $133.31B |
Key Takeaways
- Use technical analysis to identify key price levels for SPY and tech stocks. This helps you decide when to buy or sell.
- Always set stop-loss orders to protect your investments. This limits your losses if the market moves against you.
- Monitor support and resistance levels. These indicate where prices may reverse, guiding your trading decisions.
- Combine technical analysis with fundamental analysis for better trading results. This gives you a complete view of the market.
- Stay disciplined and regularly review your trading strategies. Adapting to market changes improves your chances of success.
Trade SPY
Image Source: pexels
Price Levels
You can trade SPY by watching its price closely. The current price of SPY is $645.16 USD (see exchange rate). Over the past week, SPY has dropped by 0.21%. This small change shows that SPY is moving in a tight range. Many traders use these price levels to decide when to buy or sell.
| Metric | Value |
|---|---|
| Current Price (USD) | $645.16 |
| Change Over Last Week | -0.21% |
You should always check the latest price before you trade SPY. The SPDR S&P 500 ETF Trust tracks the S&P 500 index, so its price reflects the overall market.
Support and Resistance
Support and resistance help you find where SPY might stop falling or rising. Support is a price level where buyers step in. Resistance is where sellers appear. You can use formulas to find these levels:
| Level Type | Calculation Formula |
|---|---|
| Pivot Point (PP) | (High + Low + Close) / 3 |
| 1st Resistance (R1) | (2 × PP) - Low |
| 2nd Resistance (R2) | PP + (R1 - S1) |
| 1st Support (S1) | (2 × PP) - High |
| 2nd Support (S2) | PP - (R1 - S1) |
You can use technical analysis to spot these levels. When SPY moves above resistance, you may see a strong uptrend. If SPY falls below support, you may see a downtrend. You should also watch moving averages. When SPY rises above its moving average, it shows bullish sentiment. If SPY drops below the moving average, it signals bearish sentiment. A short-term moving average crossing above a long-term moving average often means the market is turning up.
Tip: Use MACD and RSI to confirm signals from support and resistance. MACD shows momentum. RSI tells you if SPY is overbought or oversold.
Bullish and Bearish Targets
You can set targets when you trade SPY. Bullish targets are prices you expect SPY to reach if it goes up. Bearish targets are prices you expect if SPY falls. Right now, SPY is coiling around $645.29 USD, which shows a bearish bias. The Super trend indicator gives a clear sell signal. However, SPY is still in an uptrend along rising support.
- Bullish price targets:
- $637.75 USD (see exchange rate)
- $639.29 USD (see exchange rate)
- Analyst targets range from $621.00 USD to $705.54 USD, with a specific target of $712.94 USD (upside of 10.8%).
- Bearish price targets:
- Below $636.50 USD (see exchange rate)
Analysts call SPY a Moderate Buy. They expect SPY to reach $712.94 USD, which is a 10.8% upside. You should use stop-loss orders to protect yourself if SPY moves against you. If SPY drops below key support, you may want to exit your trade.
Note: Always check the latest analyst projections before you trade SPY. Use technical indicators like moving averages, MACD, and RSI to confirm your targets.
You can trade SPY by watching price levels, support and resistance, and technical indicators. You should set clear bullish and bearish targets. Always use stop-losses to manage risk. This approach helps you trade SPY and other stocks with confidence.
Top Tech Stocks
Trading top tech stocks requires you to watch price levels, support and resistance, and set clear bullish and bearish targets. You can use technical analysis to find entry and exit points. You should monitor price action and use indicators like moving averages, MACD, and RSI. Below, you will find details for Apple, Microsoft, NVIDIA Corporation, Alphabet Inc Class A, Meta, and Tesla.
Price Levels
You need to know the current price and recent movements for each stock. This helps you decide when to buy or sell. Here are the latest price levels for the top tech stocks:
Apple (AAPL)
| Key Price Levels (USD) | Description |
|---|---|
| $230.64 - $234.18 | Testing major resistance zones, potential for dips. |
| $217.86 - $219.87 | Expected dip zone. |
| $215.40 | Possible retracement support zone. |
| $230 - $234 | Major Fibonacci levels indicating potential lower high. |
Microsoft (MSFT)
| Metric | Value (USD) |
|---|---|
| Current Price | $502.04 |
| All-Time High | $534.76 |
| 52-Week High | $555.45 |
| 52-Week Low | $344.79 |
| Average Price (52 Weeks) | $437.18 |
NVIDIA Corporation (NVDA)
| Time Frame | Price Change (USD) | Percentage Change |
|---|---|---|
| Previous Session | +$1.96 | +1.09% |
| Last 4 Weeks | N/A | +2.84% |
| Last 12 Months | N/A | +41.75% |
| Forecast (End of Q) | $175.62 | N/A |
| Forecast (1 Year) | $168.71 | N/A |
Alphabet Inc Class A (GOOGL)
- Current Price: $207.14 (as of August 26, 2025)
- Previous Close Price: $208.49
- Notable Decrease: $1.35 (0.65%)
- Day Range: $205.70 - $207.85
- 52-Week Range: $140.53 - $210.52
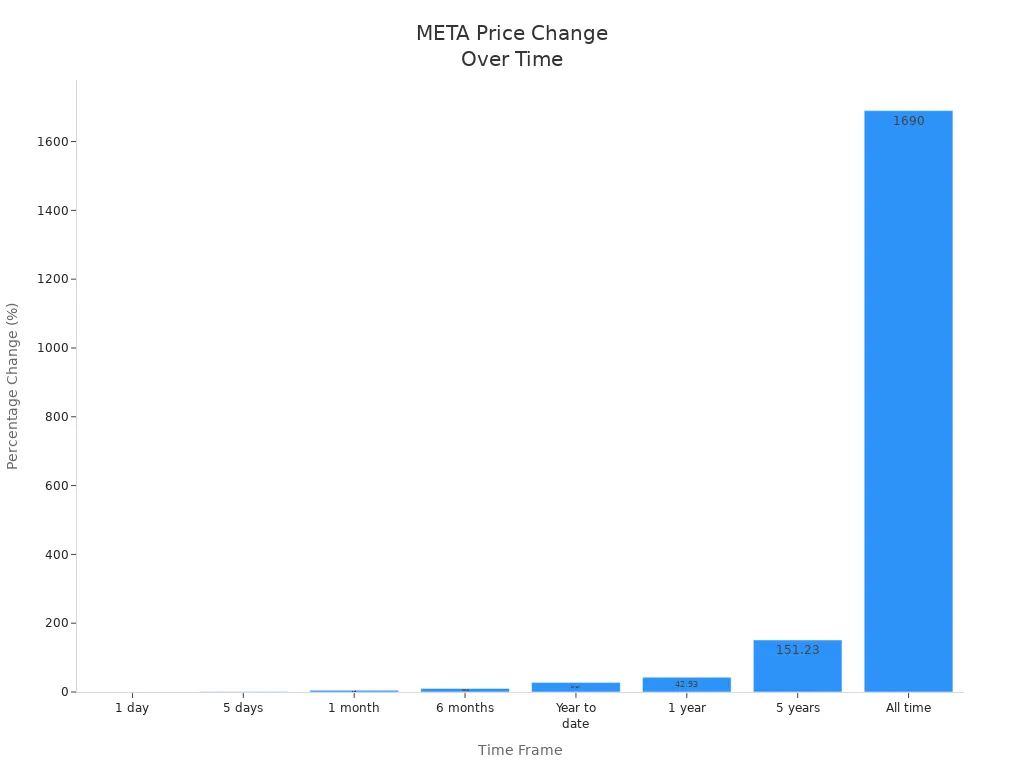
Meta (META)
| Time Frame | Percentage Change |
|---|---|
| 1 day | 0.11% |
| 5 days | 1.26% |
| 1 month | 5.19% |
| 6 months | 10.50% |
| Year to date | 27.87% |
| 1 year | 42.93% |
| 5 years | 151.23% |
| All time | 1,690% |
Tesla (TSLA)
- Current price range: $343.72 to $353.64
- Market capitalization: $1.13 trillion
- Year-to-date decline: 8% in 2025
- 52-week high: $488.54
- 52-week low: $202.59
Support and Resistance
Support and resistance levels help you spot where stocks may reverse direction. You can use these levels to set entry and exit points. Here are the key support and resistance levels for each stock:
Apple (AAPL)
| Level Type | Price (USD) |
|---|---|
| Support | $172.01 |
| Resistance | $233.33 |
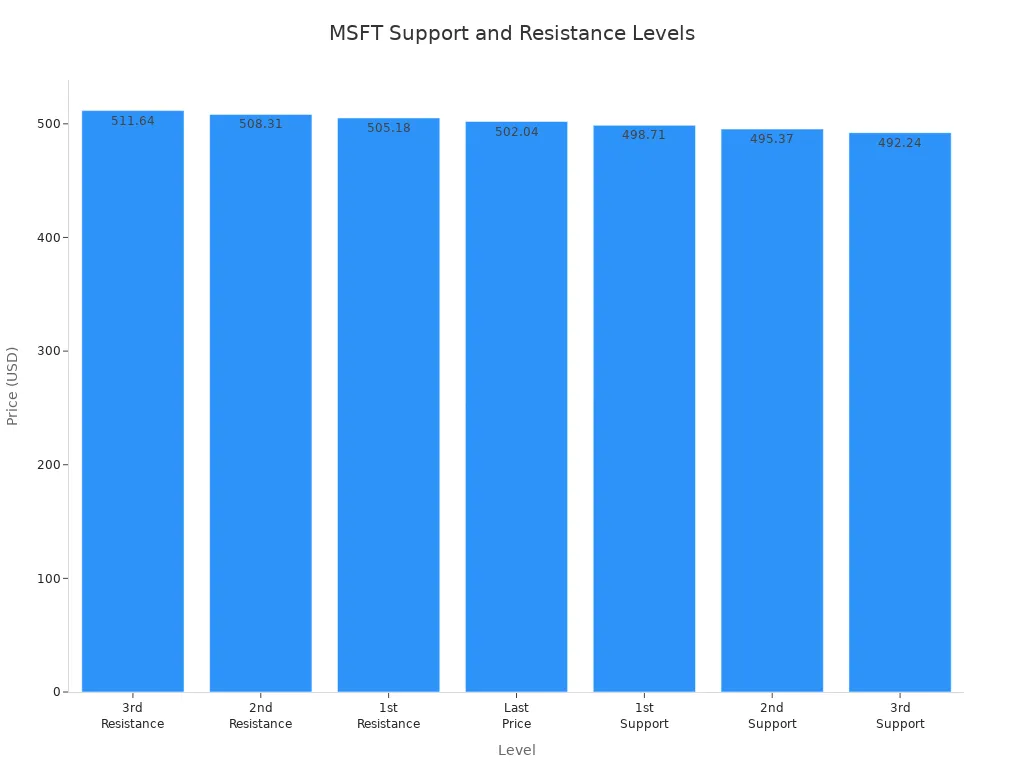
Microsoft (MSFT)
| Level Type | Price (USD) |
|---|---|
| Key Support Level | $353.33 |
| Key Resistance Level | $534.76 |
| Resistance Point | Price (USD) |
|---|---|
| 3rd Resistance Point | $511.64 |
| 2nd Resistance Point | $508.31 |
| 1st Resistance Point | $505.18 |
| Last Price | $502.04 |
| 1st Support Level | $498.71 |
| 2nd Support Level | $495.37 |
| 3rd Support Level | $492.24 |
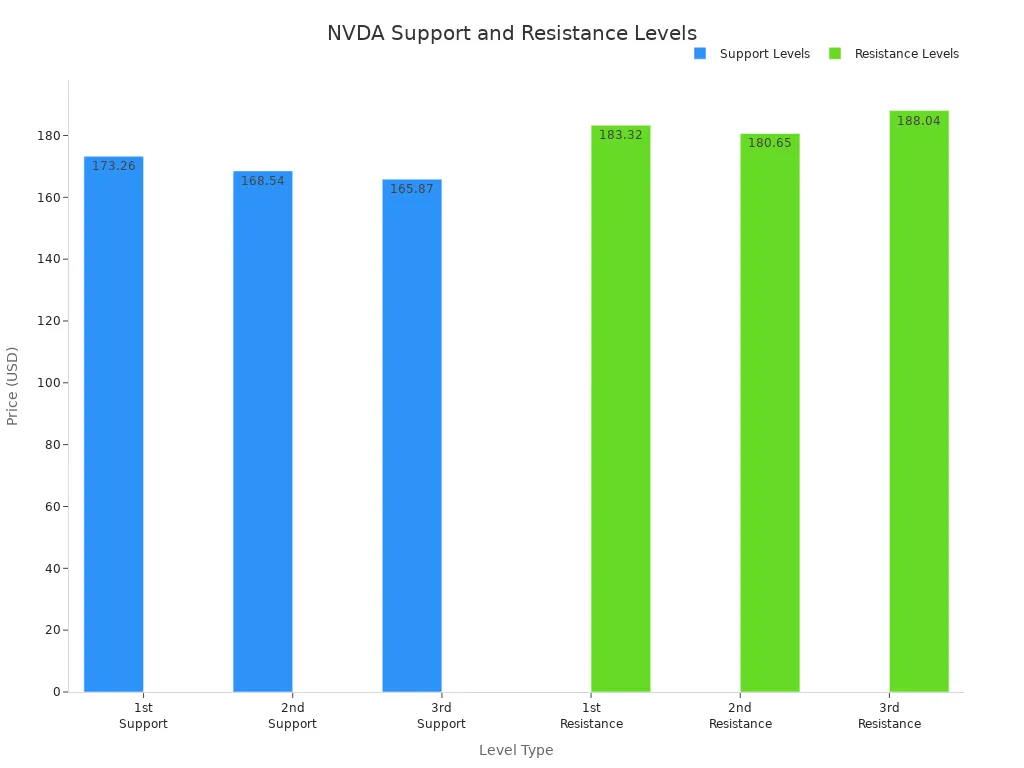
NVIDIA Corporation (NVDA)
| Level Type | Value (USD) |
|---|---|
| 1st Support Level | $173.26 |
| 2nd Support Level | $168.54 |
| 3rd Support Level | $165.87 |
| 1st Resistance Level | $183.32 |
| 2nd Resistance Level | $180.65 |
| 3rd Resistance Level | $188.04 |
Alphabet Inc Class A (GOOGL)
| Level Type | Price Level (USD) |
|---|---|
| Resistance | $194.72 |
| Support | $193.17 |
| Resistance | $197.50-$200 |
| Support | $192.50 |
| Resistance | $205 |
| Support | $187.50-$185 |
Meta (META)
| Level | Calculation |
|---|---|
| Pivot Point (PP) | (H + L + C) / 3 |
| 1st Resistance Level | (2 * PP) - L |
| 2nd Resistance Level | PP + (R1 - S1) |
| 3rd Resistance Level | H + (2 * (PP - L)) |
| 1st Support Level | (2 * PP) - H |
| 2nd Support Level | PP - (R1 - S1) |
| 3rd Support Level | L - (2 * (H - PP)) |
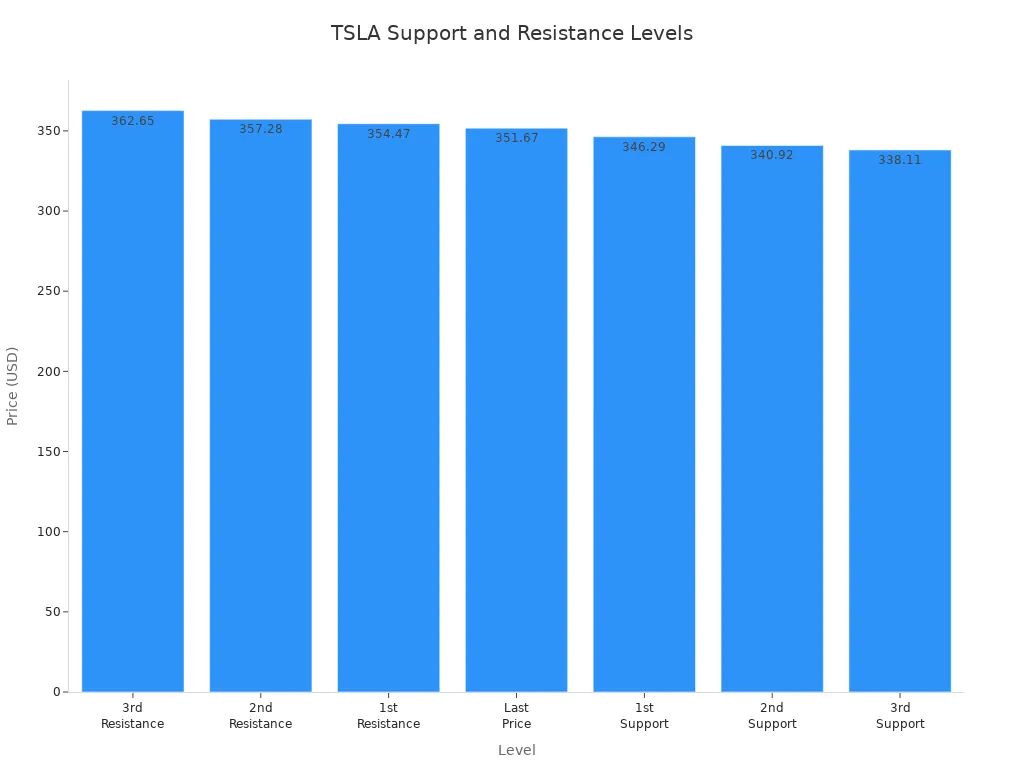
Tesla (TSLA)
| Resistance Level | Price (USD) |
|---|---|
| 3rd Resistance Point | $362.65 |
| 2nd Resistance Point | $357.28 |
| 1st Resistance Point | $354.47 |
| Last Price | $351.67 |
| 1st Support Level | $346.29 |
| 2nd Support Level | $340.92 |
| 3rd Support Level | $338.11 |
Bullish and Bearish Targets
Setting bullish and bearish targets helps you plan your trades. You should use technical analysis and monitor price action to adjust your targets. Here are the latest analyst targets for each stock:
Apple (AAPL)
| Analyst | Price Target (USD) | Recommendation |
|---|---|---|
| Bank of America | $250.00 | Buy |
| Evercore ISI | $250.00 | Buy |
| Morgan Stanley | $240.00 | Buy |
| Barclays | $180.00 | Sell |
| Highest Target | $300.00 | N/A |
| Lowest Target | $170.00 | N/A |
| Average Target | $237.01 | N/A |
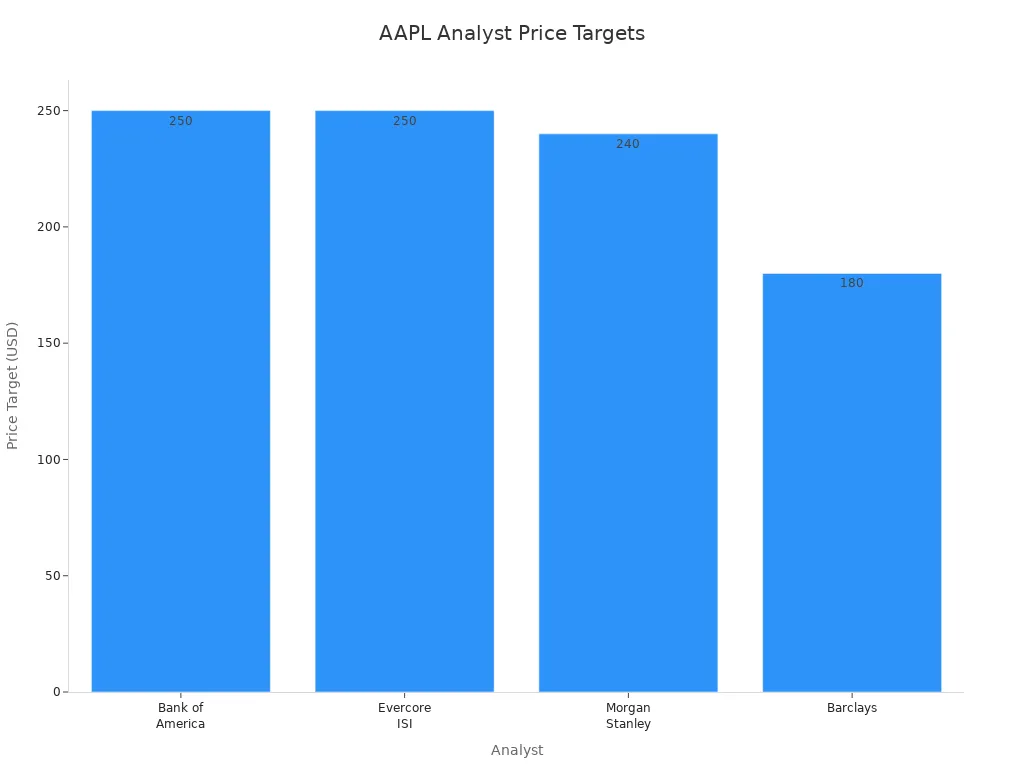
- Highest price target: $300.00
- Lowest price target: $170.00
- Average price target: $237.01
Microsoft (MSFT)
| Price Target Type | Value (USD) |
|---|---|
| Average Target | $511.12 |
| High Estimate | $605.00 |
| Low Estimate | $430.00 |
| Previous Average | $489.67 |
| Increase | 4.38% |
| Price Target Type | Value (USD) |
|---|---|
| Average Target | $539.39 |
| High Estimate | $613.00 |
| Low Estimate | $475.00 |
| Previous Average | $495.76 |
| Increase | 8.8% |
NVIDIA Corporation (NVDA)
| Price Target Type | Price Target (USD) |
|---|---|
| Bullish Target | $250.00 |
| Bearish Target | $120.00 |
| Consensus Average | $194.31 |
Alphabet Inc Class A (GOOGL)
| Price Target (USD) | Sentiment | Potential Upside |
|---|---|---|
| $240 | Bullish | 51.1% |
| $217.25 | Bullish | 4.20% |
| $215.19 | Neutral | 3.48% |
| $245.00 | Bullish | N/A |
| $171.00 | Bearish | N/A |
- 39 ‘Strong Buy’ ratings on Alphabet stock.
- Tigress Financial raised the price target to $240, citing AI innovation as a growth driver.
Meta (META)
| Price Target Type | Price (USD) |
|---|---|
| Consensus | $822.41 |
| High | $980.00 |
| Low | $600.00 |
| Current Price | $754.10 |
| Upside Potential | 9.06% |
Tesla (TSLA)
| Price Target Type | Price (USD) |
|---|---|
| Average | $303.31 |
| High | $500.00 |
| Low | $19.05 |
| Current Price | $351.67 |
| Forecasted Downside | -13.75% |
| Price Target Type | Price (USD) |
|---|---|
| Average | $305.37 |
| High | $500.00 |
| Low | $19.05 |
| Current Price | $346.60 |
| Forecasted Change | -11.90% |
You should use technical analysis tools and watch price action for each stock. You can trade SPY and top tech stocks by setting clear targets and using stop-losses. You should also track the performance of the Invesco QQQ Trust, which follows the Nasdaq 100 index and includes many top tech stocks. Monitoring Alphabet Inc Class A and NVIDIA Corporation helps you understand market trends. You can use these strategies to improve your trading results.
Technical Analysis Tips
Image Source: pexels
Indicators
You can use technical analysis to find trading opportunities in SPY and top tech stocks. Moving averages help you see the trend. If the price moves above the moving average, you may spot a bullish opportunity. MACD shows momentum. When the MACD line crosses above the signal line, you can look for investment opportunities. RSI tells you if a stock is overbought or oversold. If RSI is above 70, the stock may be overbought. If RSI is below 30, it may be oversold. Trendlines help you track price action and spot reversals.
- Microsoft Corp. (MSFT): Key support at 504.50 and resistance at 506.70.
- NVIDIA Corporation (NVDA): Notable level at 176.50 with resistance at 178.91.
- Alphabet Inc Class A (GOOGL): Support at 200.50 and resistance at 201.55.
- Meta Platforms Inc (META): Support at 745.50 and resistance at 748.21.
- Tesla Inc. (TSLA): Significant level at 328.50 with resistance at 330.78.
You should combine technical analysis with fundamental analysis. This helps you find more investment opportunities and make better trading decisions.
Patterns
You can use chart patterns to spot trading opportunities. Common patterns include double tops, double bottoms, and head-and-shoulders. A double top often signals a reversal from an uptrend to a downtrend. A double bottom may show a reversal from a downtrend to an uptrend. Head-and-shoulders patterns help you see when a trend might end. You should watch price action closely when these patterns form. Patterns can help you set entry and exit points for your trades.
Tip: Always confirm patterns with indicators like moving averages or RSI before you trade SPY or top tech stocks.
Risk Management
Risk management is important for trading. You should use stop-loss orders to protect your trades. Studies show that using stop-losses can improve returns and reduce volatility. For example, a stop-loss strategy increased average monthly returns from 1.01% to 1.73%. A trailing stop-loss with a 15% limit achieved a cumulative return of 73.91%. Setting a stop-loss at 10% helped reduce monthly losses and improved average returns.
| Strategy Type | Description |
|---|---|
| Buy-and-Hold | Ideal for long-term portfolios due to SPY’s low expense ratio and historical returns. |
| Diversification | Balancing tech exposure by complementing SPY with sector-specific ETFs. |
| AI Integration | Utilizing AI trading platforms for real-time insights and risk management. |
| Swing Trading | Capitalizing on intraday signals using AI tools, targeting specific support and resistance levels. |
| Hedging | Using inverse ETFs or put options to mitigate risks, especially if SPY drops below a certain level. |
| Monitor Macro Events | Keeping an eye on economic indicators that may trigger volatility. |
You should always use a strategy that fits your goals. Risk management helps you find more opportunities and protect your portfolio when you trade SPY and top tech stocks.
You build trading success by staying disciplined and always using stop-losses to protect your capital. Regularly review price levels and technical indicators because markets change and strategies must adapt. Studies show that reviewing your indicators and price levels helps you avoid relying on outdated methods and keeps your trading effective.
Combining technical and fundamental analysis gives you a stronger edge. You gain:
- A complete view of each stock’s value and market behavior.
- Better timing for buying and selling.
- Improved risk management.
- More confidence in your decisions.
- Flexibility to adjust as markets shift.
Keep learning and practicing. Over time, you will grow more confident in your trading strategies and decisions.
FAQ
How do you set stop-loss orders when trading SPY or tech stocks?
You choose a price below your entry point. If the stock drops to this price, your broker sells it automatically. This helps you limit losses and protect your money.
Tip: Many traders set stop-losses just below support levels.
Which technical indicators work best for beginners?
You can start with moving averages, MACD, and RSI. These indicators show trends, momentum, and if a stock is overbought or oversold. They are easy to read and help you make better decisions.
How often should you review price levels and indicators?
You should check price levels and indicators every day before trading. Regular reviews help you spot changes in trends and adjust your strategy quickly.
| Review Frequency | Benefit |
|---|---|
| Daily | Quick reaction |
| Weekly | Trend confirmation |
Can you use technical analysis for stocks listed in China?
Yes, you can use technical analysis for stocks listed in China. The same tools and strategies apply. You should check price charts, support, resistance, and indicators before making trades.
Trading SPY and top tech stocks successfully hinges on precise price analysis and effective risk management, but cross-border investing often comes with high fees and complex account setups.
BiyaPay offers a seamless solution to tackle these challenges. With real-time exchange rate tracking, you can seize the best conversion opportunities, while enjoying remittance fees as low as 0.5%, covering most countries globally with same-day transfers. No need for cumbersome overseas accounts—BiyaPay lets you trade stocks, including U.S. and Hong Kong markets, on a single platform, saving you from costly intermediaries and exchange rate losses. Plus, it supports swift conversions between fiat and cryptocurrencies, empowering you to navigate market shifts with ease. Sign up for BiyaPay now to streamline your investments and capture every trading opportunity!
*This article is provided for general information purposes and does not constitute legal, tax or other professional advice from BiyaPay or its subsidiaries and its affiliates, and it is not intended as a substitute for obtaining advice from a financial advisor or any other professional.
We make no representations, warranties or warranties, express or implied, as to the accuracy, completeness or timeliness of the contents of this publication.


Contact Us
Company and Team
BiyaPay Products
Customer Services


is a broker-dealer registered with the U.S. Securities and Exchange Commission (SEC) (No.: 802-127417), member of the Financial Industry Regulatory Authority (FINRA) (CRD: 325027), member of the Securities Investor Protection Corporation (SIPC), and regulated by FINRA and SEC.
registered with the US Financial Crimes Enforcement Network (FinCEN), as a Money Services Business (MSB), registration number: 31000218637349, and regulated by FinCEN.
registered as Financial Service Provider (FSP number: FSP1007221) in New Zealand, and is a member of the Financial Dispute Resolution Scheme, a New Zealand independent dispute resolution service provider.