- EasyCard
- Trade
- Help
- Announcement
- Academy
- SWIFT Code
- Iban Number
- Referral
- Customer Service
- Blog
- Creator
Detailed Explanation of Moving Averages (MA): Key Indicators for Mastering Trend Context


Image Source: unsplash
The moving average holds a pivotal position in financial market analysis. Many traders use it to observe price movements and grasp the main market direction. Compared to other technical indicators, the moving average, with its ability to smooth price fluctuations and simplify trend identification, helps analysts more intuitively recognize trends. The table below shows the predictive accuracy of common indicators like MACD and RSI:
| Indicator | Predictive Accuracy | Description |
|---|---|---|
| MACD | 56% | During the test period, 56% of stock prices rose. |
| RSI | >50% | Similarity in buy decisions exceeds 50%. |
Many investors find that mastering moving averages can improve the efficiency of trend identification and enhance confidence in market analysis.
Key Points
- Moving averages help traders smooth price fluctuations, identify market trends, and boost analytical confidence.
- Choosing the right type of moving average (e.g., SMA, WMA, EMA) can better suit different trading strategies.
- Combining multi-timeframe moving averages can improve the accuracy of trend identification and filter market noise.
- Golden cross and death cross signals are commonly used for buy and sell signals, and combining them with volume analysis can enhance signal reliability.
- Avoid over-reliance on moving averages; combining them with other technical indicators (e.g., RSI, MACD) can improve the scientific rigor of analysis.
Moving Average Basics
Definition and Principles
The moving average is a common technical analysis tool. It averages price data over a period to help traders observe the overall price trend.
- A moving average (also called a rolling average or running average) is a method to analyze data points by calculating the average of different selected datasets.
- Mathematically, a moving average is a type of convolution operation, often used in signal processing.
- In financial markets, moving averages can smooth short-term price fluctuations, highlighting long-term trends or cycles.
Calculation Methods
Most traders use closing prices to calculate moving averages. Common calculation methods include:
- Calculating using only closing prices (most common)
- Calculating using the average of high and low prices, i.e., (H+L)/2
- Calculating using the average of high, low, and closing prices, known as the typical price, i.e., (H+L+C)/3
- Calculating using the average of opening, high, low, and closing prices, i.e., (O+H+L+C)/4
In statistics, different types of moving averages use different weight distributions. The table below shows several common types and their weight distributions:
| Moving Average Type | Weights | Description |
|---|---|---|
| (2×4)-MA | ([1/8, 1/4, 1/4, 1/4, 1/8]) | Used to estimate trend cycles in seasonal data, smoothing seasonal variations |
| (2×m)-MA | ([1/2m, 1/m, 1/m, 1/m, 1/2m]) | Suitable for data with even-numbered seasonal cycles |
| (m)-MA | ([1/m, 1/m, …, 1/m]) | Suitable for data with odd-numbered seasonal cycles |
Main Types
Moving averages come in several types, with the most common being Simple Moving Average (SMA), Weighted Moving Average (WMA), and Exponential Moving Average (EMA).
- SMA assigns equal weight to all data points, responding more slowly to price changes.
- WMA assigns higher weight to recent data, responding faster to price changes.
- EMA assigns the highest weight to the latest prices, making it the most sensitive to price changes and capable of reflecting market trends more quickly.
The table below compares the sensitivity of the three types:
| Moving Average Type | Sensitivity Description |
|---|---|
| SMA | Responds more slowly to price changes, with equal weights for all data points. |
| WMA | Responds faster to price changes, with higher weights for recent data. |
| EMA | Responds fastest to price changes, with the highest weight for the latest prices. |
Traders can choose different types of moving averages based on their needs to better capture market trends.
Trend Identification

Image Source: unsplash
Trend Determination
Investors commonly use moving averages to determine market trends. Studies show that moving averages can effectively predict market direction when analyzing historical data. The table below summarizes key findings from related academic studies:
| Study Title | Key Findings |
|---|---|
| A Study of the Impact of Moving Averages on Predicting Stock Market Trends: A Study of NIFTY 50 | The study shows that moving averages are effective in predicting market trends, especially when analyzing historical data. Using paired sample T-tests to compare the performance of moving average crossover strategies with traditional buy-and-hold strategies, the results indicate that moving averages provide valuable insights in technical analysis. |
| Market Timing with Moving Average Distance: International Evidence | The study finds that the distance between short-term and long-term moving averages (MAD) can predict future returns in international markets. MAD portfolios can achieve abnormal profits even after accounting for transaction costs, demonstrating the effectiveness of moving averages globally. |
Investors can identify market trends through the following methods:
- When prices are above the moving average, the market is typically in a bullish trend.
- When prices are below the moving average, the market is typically in a bearish trend.
- Moving average crossover strategies help identify trend reversals, such as “golden cross” and “death cross.”
- In a bullish market, prices consistently stay above the long-term moving average, indicating a strong trend; in a bearish market, prices remain below the moving average, reflecting negative sentiment.
Cycle Selection
Different time cycles suit different trading strategies. Short-term, medium-term, and long-term moving averages each have their advantages. The table below shows common cycles and their applicable scenarios:
| Moving Average Type | Applicable Time Cycle | Applicable Scenarios |
|---|---|---|
| 10-Day Moving Average | Short-Term | Short-term trading opportunities |
| 20-Day Moving Average | Medium-Term | Overall trend identification |
| 30-Day Moving Average | Long-Term | Long-term trend identification |
| 15-Day Moving Average | Short-Term | Intraday trading |
| 50-Day Moving Average | Medium-Term | Investor holdings |
| 200-Day Moving Average | Long-Term | Investor holdings |
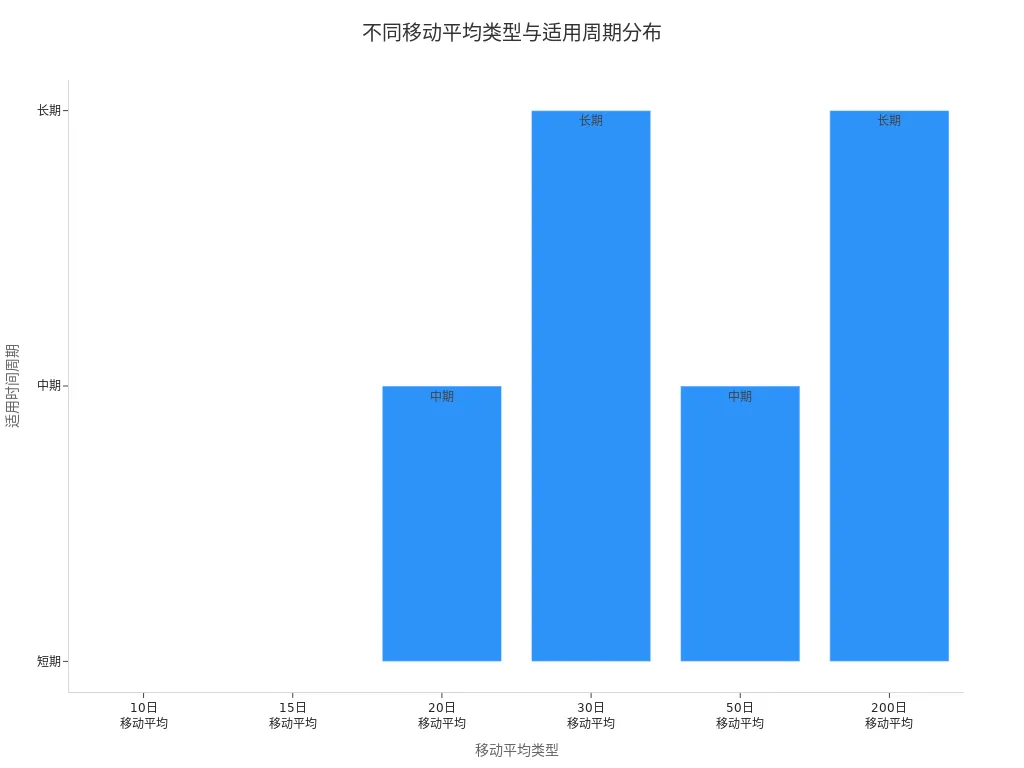
When selecting cycles, investors can refer to the following points:
- The 10-day moving average is suitable for short-term trading, responding quickly to market changes.
- The 20-day moving average is suitable for medium-term analysis, with relatively stable trend indications.
- Cycles of 30 days or more are suitable for long-term investments, reducing the impact of short-term fluctuations.
Multi-Timeframe Combinations
Combining moving averages across multiple timeframes can improve the accuracy of trend identification. The multi-timeframe combination method offers the following advantages:
- Helps traders align short-term price fluctuations with long-term trends.
- Provides a clearer view of market direction, filtering out noise.
- Generates more reliable entry and exit signals.
The multi-timeframe moving average crossover strategy uses crossover signals from different timeframes to determine trend direction. This method combines trend, momentum, and volatility indicators, making signals more reliable. By using multi-timeframe combinations, investors can gain a more comprehensive understanding of market dynamics, improving the scientific rigor of their decisions.
Moving Average Applications

Image Source: unsplash
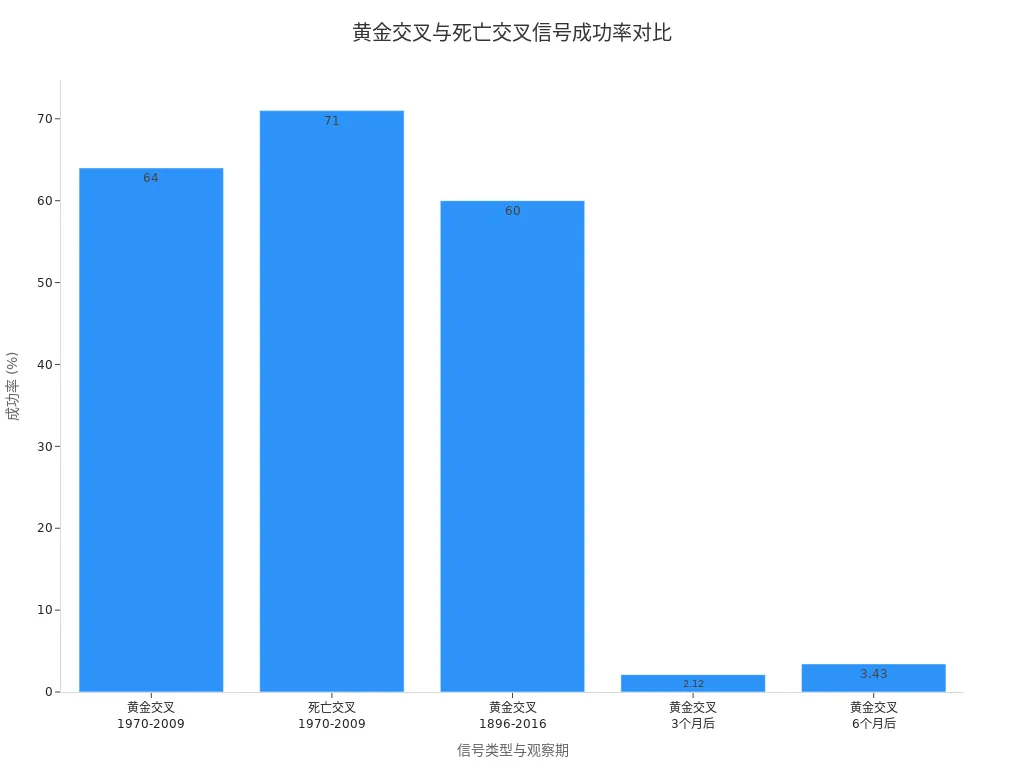
Golden Cross and Death Cross
Traders widely use golden cross and death cross signals in stock, forex, and cryptocurrency markets. A golden cross occurs when a short-term moving average breaks above a long-term moving average, typically seen as a buy signal. A death cross occurs when a short-term moving average falls below a long-term moving average, often considered a sell signal.
Statistical data shows that the golden cross had a success rate of 64% and the death cross 71% from 1970 to 2009. Ned Davis Research found that stocks experiencing a golden cross outperformed the market by an average of 1.5% over the next three months. Chart Report’s study shows an average return of 2.12% three months after a golden cross and 3.43% after six months.
| Signal Type | Success Rate (%) | Observation Period |
|---|---|---|
| Golden Cross | 64 | 1970-2009 |
| Death Cross | 71 | 1970-2009 |
| Golden Cross | 60 | 1896-2016 (60%+ profitable) |
| Golden Cross | 2.12 | 3 months later |
| Golden Cross | 3.43 | 6 months later |
Traders typically combine volume analysis to validate the effectiveness of golden cross and death cross signals. Signals are more reliable when accompanied by increased trading volume.
Golden cross and death cross signals perform better in markets with clear trends. In range-bound or volatile markets, signals may produce more false breakouts.
Support and Resistance
Moving averages are often used as dynamic support and resistance in actual trading. When prices are below the moving average, the line can act as support; when prices are above it, it becomes resistance.
- Moving averages automatically adjust based on market changes, reflecting current market conditions.
- Traders buy when prices pull back to the moving average or sell when prices rise and touch the moving average.
- In trending markets, moving averages typically serve as reliable support and resistance levels.
- In range-bound markets, prices frequently cross the moving average, increasing false signals.
In forex and cryptocurrency markets, traders also use moving averages to identify potential support and resistance zones.
Market Environment
In different market environments, moving average application strategies need flexible adjustments.
- In markets with clear trends, moving averages can effectively indicate direction and entry/exit points.
- In volatile or range-bound markets, moving average strategies are prone to false signals and should be used cautiously.
- Adaptive Moving Averages (AMA) can maintain profitability in trending markets and reduce false signals in range-bound markets.
- Advanced moving averages like HMA or ALMA can improve response speed, enhancing trading advantages.
When setting parameters, traders need to choose appropriate cycle lengths and types based on market characteristics.
- Closing prices are commonly used to calculate moving averages.
- Cycle lengths range from 8 to 200 price bars, reflecting different trends.
- Simple moving averages are suitable for beginners, while exponential moving averages are suited for traders needing faster responses.
Moving averages confirm established trends rather than predict future performance. Traders should flexibly adjust strategies based on market conditions.
Indicator Combinations
Using moving averages alone can sometimes fail to avoid false signals. Traders often combine them with other technical indicators to improve analysis accuracy.
- The Relative Strength Index (RSI) measures the speed of price changes, helping identify reversal points.
- The Moving Average Convergence Divergence (MACD) combines trend and momentum, using moving average signals to assess trend strength and direction.
- Volume analysis can validate the strength of moving average crossover signals, avoiding false signals.
- Checking momentum indicators to confirm trends and monitoring price behavior patterns near crossover points.
When a moving average indicates an uptrend, if the RSI shows overbought conditions, traders may wait for a price correction before entering the market.
Combining multi-timeframe moving averages (e.g., 50-day and 200-day) can effectively identify trend changes, and using volume and momentum indicators enhances the scientific rigor of trading decisions.
Pitfalls and Recommendations
Over-Reliance
Many traders tend to over-rely on moving averages in practice. They often believe moving averages can accurately predict future market movements, but in reality, moving averages are based solely on historical price data and cannot reflect upcoming market changes.
- Moving averages fail to account for changes in fundamental factors, potentially overlooking significant events affecting prices.
- Different types of moving averages are suited to different scenarios, and choosing the wrong type can lead to analytical errors.
- Relying solely on a single moving average can overlook the complexity and diversity of the market.
Traders should combine other technical indicators and market information, avoiding using moving averages as the sole basis for decisions.
Lagging Nature
Moving averages are typical lagging indicators. They average prices over a past period, reflecting historical trends rather than current market dynamics.
- In rapidly changing markets, moving average signals often lag, causing traders to miss optimal entry and exit points.
- Traditional moving averages perform well in stable markets, but in high-volatility environments, signal lag becomes more pronounced.
- Due to reliance on historical data, moving averages may lead traders to make decisions based on outdated information.
Investors should recognize the lagging nature of moving averages and combine real-time price behavior and other analytical tools to improve trading responsiveness.
False Signals
In range-bound or high-volatility market environments, moving averages are prone to producing false signals.
- Short-term moving averages frequently crossing long-term moving averages may not indicate true trend changes.
- Crossover traps are common during sharp price fluctuations, leading to consecutive losses.
- Choosing the wrong timeframe can amplify false signal risks, with short-term lines being overly sensitive and long-term lines reacting too slowly.
Common pitfalls include:
- Relying on a single moving average, ignoring the advantages of multi-timeframe combinations.
- Ignoring market context and acting solely on crossover signals.
- Not combining volume or momentum indicators, leading to distorted signals.
Improving Accuracy
There are several ways to improve the accuracy of moving average signals.
- Combine multi-timeframe moving averages to leverage trend information from different timeframes and filter noise.
- Use moving averages with other technical indicators (e.g., RSI, Bollinger Bands) to enhance signal effectiveness.
- Adopt dynamic trailing stops, using moving averages as a basis for stop-loss adjustments to lock in profits promptly.
- Choose appropriate parameter settings to avoid over-trading or missing opportunities. For example, short-term lines for entry signals and long-term lines for take-profit targets.
Traders should continuously optimize strategies, flexibly adjusting parameters based on market conditions to enhance the scientific rigor and practicality of technical analysis.
Moving averages, as trend indicators, help traders smooth price data and identify market trends and potential entry/exit points.
- They rely on historical data and are lagging indicators, potentially producing misleading signals in high-volatility markets.
- Professional traders often combine RSI, MACD, and other tools for comprehensive judgment to improve analysis accuracy.
| Analysis Tool | Role |
|---|---|
| Moving Average (MA) | Confirm trends and signals |
| Relative Strength Index (RSI) | Confirm trend strength and potential reversals |
| Moving Average Convergence Divergence (MACD) | Validate moving average crossover signals |
Continuously testing different types and cycles of moving averages, combined with other indicators, helps improve technical analysis capabilities.
FAQ
Which Markets Are Moving Averages Suitable For?
Moving averages are suitable for stocks, forex, and cryptocurrency markets. Many traders in the U.S. market use moving averages to analyze trends. This tool helps them identify price direction and improve the scientific rigor of trading decisions.
How to Choose the Cycle for Moving Averages?
Traders choose cycles based on their trading style. Short-term cycles like 10-day are suitable for fast trading, medium-term like 50-day for trend following, and long-term like 200-day for investor holdings. These cycles are commonly used in the U.S. market for analysis.
Can Moving Averages Predict Future Prices?
Moving averages can only reflect historical trends. They cannot predict future prices. Traders in the U.S. market often use MACD and RSI as complementary tools to improve analysis accuracy.
Are Moving Averages Effective in Range-Bound Markets?
In range-bound markets, moving average signals are prone to distortion. Traders in the U.S. market encountering range-bound conditions typically combine volume and momentum indicators to filter false signals and avoid frequent trading.
How Do Moving Averages Work with Other Indicators?
Many traders combine moving averages with MACD, RSI, and other indicators. Analysts in the U.S. market use multi-indicator combinations to improve trend identification and signal accuracy, reducing the risk of misjudgment.
You have now mastered the Moving Average (MA), recognizing it as a key indicator for identifying trends and executing Golden Cross/Death Cross signals. Whether you are using EMA for fast-paced crypto trading or SMA for tracking long-term US stock trends, efficient and low-cost execution of your strategy is crucial for ensuring profitability.
High cross-border remittance fees and opaque exchange rates can constantly chip away at the profits generated by your precise MA signals. When a market signal appears, you need a financial platform that supports immediate, zero-delay entry.
BiyaPay is your essential trend execution tool. We offer real-time exchange rate inquiry and conversion for fiat currencies, with remittance fees as low as 0.5%, and zero commission for contract limit orders, helping you maximize the net returns from every trend trade. BiyaPay allows you to seamlessly convert between various fiat and digital currencies, and trade global markets, including Stocks, all on one platform. There is no need for a complex overseas account, and you can enjoy same-day remittance and arrival. Click the Real-time Exchange Rate Inquiry now, and BiyaPay for quick registration, and use peak capital efficiency to translate your Moving Average analysis into real trading success!
*This article is provided for general information purposes and does not constitute legal, tax or other professional advice from BiyaPay or its subsidiaries and its affiliates, and it is not intended as a substitute for obtaining advice from a financial advisor or any other professional.
We make no representations, warranties or warranties, express or implied, as to the accuracy, completeness or timeliness of the contents of this publication.


Contact Us
Company and Team
BiyaPay Products
Customer Services


is a broker-dealer registered with the U.S. Securities and Exchange Commission (SEC) (No.: 802-127417), member of the Financial Industry Regulatory Authority (FINRA) (CRD: 325027), member of the Securities Investor Protection Corporation (SIPC), and regulated by FINRA and SEC.
registered with the US Financial Crimes Enforcement Network (FinCEN), as a Money Services Business (MSB), registration number: 31000218637349, and regulated by FinCEN.
registered as Financial Service Provider (FSP number: FSP1007221) in New Zealand, and is a member of the Financial Dispute Resolution Scheme, a New Zealand independent dispute resolution service provider.