How MCARY Stock Is Trending and What It Means for Your Portfolio


Image Source: pexels
MCARY stock recently showed a sharp negative trend, with a notable 14.27% decline compared to the S&P 500 over the past five days. Mercari’s stock price fluctuated between $4.91 and $9.60 in the last year, reflecting significant volatility. Understanding this current trend helps investors evaluate mercari’s ratings, price forecast, and investment risk. The table below highlights recent price changes for MCARY stock:
| Metric | Value |
|---|---|
| Last price | $7.49 |
| 52-week range | $4.91 - $9.60 |
| 1-year price change | +15.77% |
| Recent 5-day performance vs S&P 500 | -14.27% |
Mercari’s ratings and price forecast continue to shape investment decisions in this environment.
Key Takeaways
- MCARY stock has shown high volatility with recent sharp price drops and mixed signals from earnings and institutional moves.
- Analysts remain cautious with more hold and sell ratings than buy, reflecting uncertainty and risk in the stock’s outlook.
- Technical indicators suggest bearish short-term trends but some long-term support near key moving averages.
- Investors should monitor price forecasts, analyst updates, and market news closely before making buy, hold, or sell decisions.
- Using stop-loss orders, diversifying portfolios, and setting clear investment goals can help manage risks with MCARY stock.
MCARY Stock Trend

Image Source: pexels
Price Movement Overview
MCARY stock has shown considerable volatility over the past year. Investors observed sharp swings in the current price, especially around earnings report dates. The table below highlights how mercari stock responded to key earnings announcements:
| Earnings Report Date | Stock Price 1 Day Before | Stock Price 1 Day After | Price Change (%) |
|---|---|---|---|
| Nov 06, 2024 | $7.14 | $5.91 | -17.23% |
| Feb 07, 2025 | $6.29 | $7.62 | +21.14% |
| May 07, 2025 | $7.93 | $8.07 | +1.77% |
| Aug 05, 2025 | $7.93 | $7.85 | -1.01% |
Mercari stock often reacts strongly to earnings news, with the largest drop occurring after the November 2024 report. The February 2025 report led to a significant gain, showing how ratings and price forecast can shift quickly. Over the last two weeks, mcary stock lost 11.88%, and the average daily volatility reached 0.576%. On August 12, 2025, the current price increased by 2.32%, moving between $7.44 and $7.49. The expected price range for the next trading day is $7.31 to $7.67, suggesting a possible swing of 4.95%. These figures indicate that mercari stock remains highly sensitive to news and ratings, making price forecast challenging for investors.
Note: MCARY stock’s daily fluctuations highlight the importance of monitoring news and ratings. Investors should review the current price and price forecast before making buy decisions.
Key Events Impacting MCARY
Several events have shaped the trend of mcary stock. Earnings announcements stand out as major drivers of volatility, with sharp price changes following each report. Institutional investment activity also plays a crucial role. The table below summarizes recent moves by major investors in mercari stock:
| Investor | Ownership Stake (%) | Recent Move | Impact on Stock Price |
|---|---|---|---|
| BlackRock | N/A | Increased stake by 1.2% | N/A |
| Vanguard | ~12.1% | Reduced holdings by 0.9% | N/A |
| SoftBank Group Corp | ~35% | Increased stake by 3% in Q3 2023 | Shares rose by 12% |
| Wellington Management | ~4.5% | Sold 1.2% of shares in Sept 2023 | Moderate volatility observed |
| JPMorgan Chase | N/A | Initiated coverage in Aug 2023 | Increased buying activity |
Mercari stock saw a slight decrease in overall institutional ownership last quarter, dropping from 58.7% to 56.4%. However, ownership stood at about 62% in October 2023. Hedge fund investments led to an 8% uptick in mcary stock. Analysts remain cautiously optimistic, citing mercari’s potential for revenue growth and scalability in the U.S. market. Ratings and price forecast from major institutions influence buy decisions and contribute to ongoing volatility.
Recent news and ratings updates continue to impact mercari stock. Investors should track news about earnings, institutional moves, and analyst ratings to inform their buy or sell strategies. The current price and price forecast often shift in response to these events, making it essential for investors to stay informed.
Mercari Stock Forecast
Analyst Sentiment
Mercari stock forecast relies heavily on analyst recommendations and ratings. Over the past quarter, analysts have maintained a cautious stance. The latest ratings show a mix of opinions, with a slight tilt toward a buy rating but no strong buy consensus. The table below summarizes the most recent analyst recommendations:
| Analyst Recommendation | Number of Analysts |
|---|---|
| Buy | 5 |
| Hold | 3 |
| Sell | 2 |
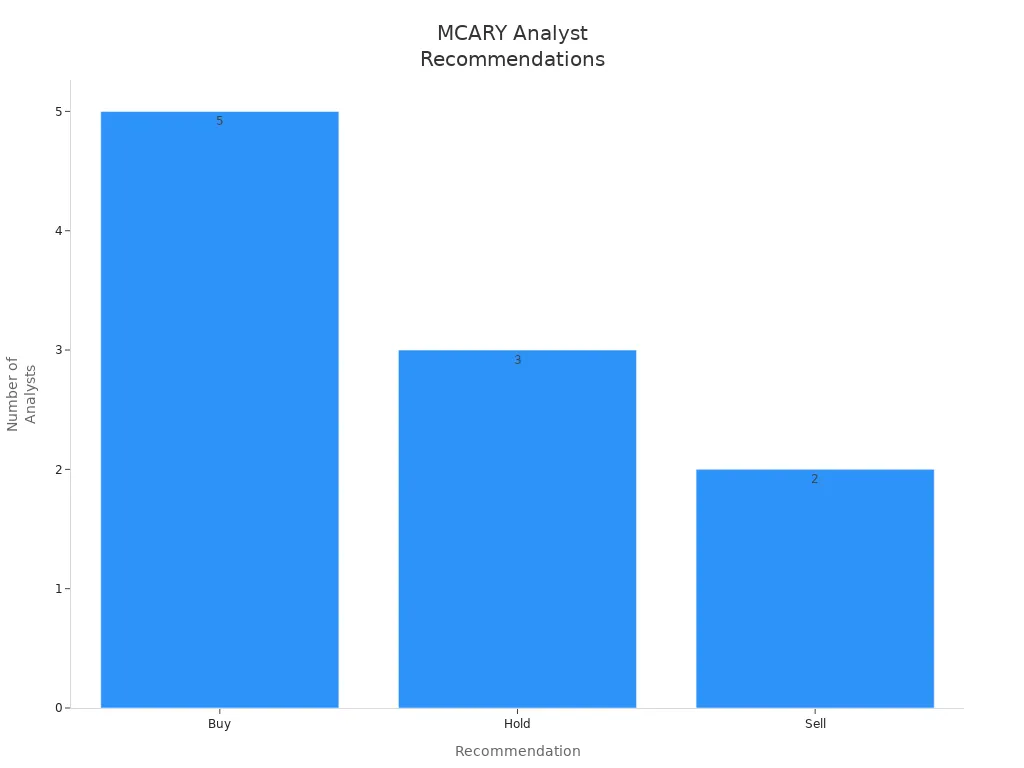
Most analysts remain hesitant to issue a strong buy rating for mercari stock. Only one Wall Street analyst assigned a buy rating in the past year, and no consensus price targets exist for either short-term or long-term periods. This lack of clear analyst forecasts and ratings signals uncertainty in the market. Investors should note that recent analyst forecasts point to increased risk and volatility.
Note: Analyst ratings and recommendations for mercari stock reflect a cautious approach. Investors should review analyst forecasts and ratings before making decisions.
Short-Term and Long-Term Outlook
Recent analyst forecasts and AI-driven stock predictions suggest a challenging road ahead for mercari. The mcary stock prediction for the next 6-12 months shows significant price swings and a bearish trend. The table below highlights AI-generated stock price predictions for mercari stock:
| Month/Year | Opening Price (USD) | Closing Price (USD) | Price Change (%) |
|---|---|---|---|
| Sep 2025 | 6.799 | 7.217 | +5.78% |
| Oct 2025 | 7.286 | 6.814 | -6.93% |
| Nov 2025 | 6.689 | 7.170 | +6.7% |
| Dec 2025 | 7.048 | 5.975 | -17.96% |
| Jan 2026 | 5.913 | 4.750 | -24.49% |
| Feb 2026 | 4.731 | 4.154 | -13.9% |
| Mar 2026 | 3.988 | 3.090 | -29.07% |
| Apr 2026 | 3.129 | 2.963 | -5.6% |
| May 2026 | 2.966 | 4.207 | +29.5% |
| Jun 2026 | 4.402 | 5.227 | +15.78% |
| Jul 2026 | 5.316 | 6.200 | +14.26% |
| Aug 2026 | 6.209 | 5.578 | -11.32% |
| Sep 2026 | 5.622 | 6.089 | +7.67% |
| Oct 2026 | 6.009 | 5.693 | -5.56% |
| Nov 2026 | 5.550 | 5.925 | +6.8% (approx.) |
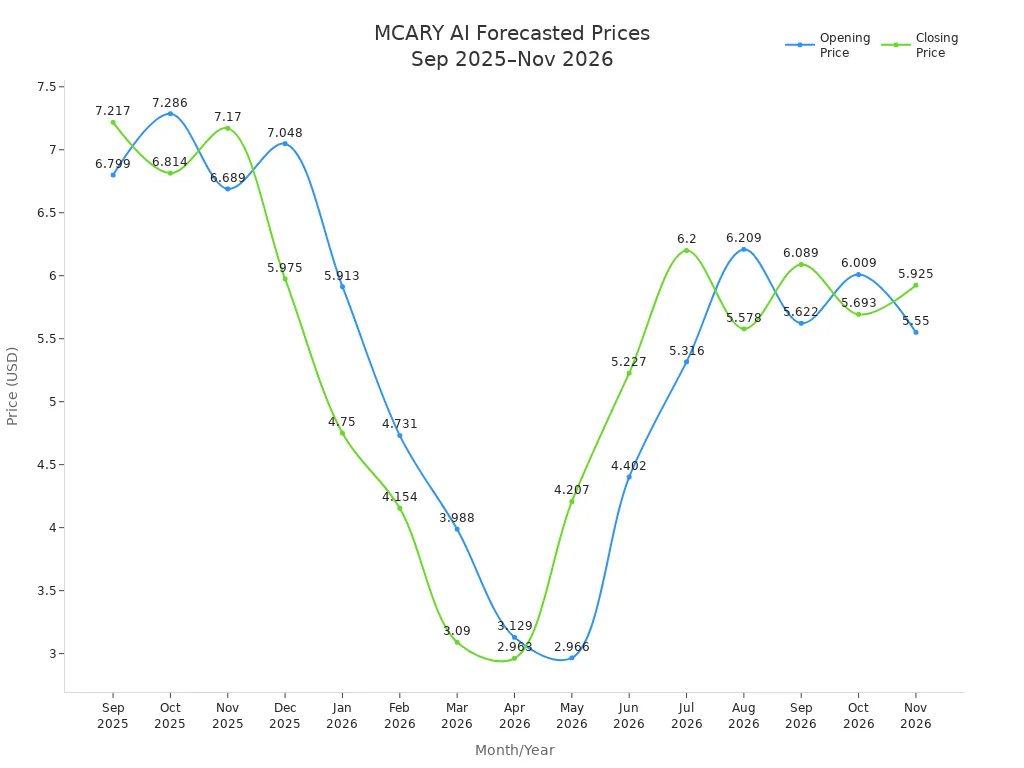
The mercari stock forecast indicates a price decline to around $6.139 over the next year. The AI model recommends avoiding mercari stock as a long-term investment due to expected negative returns and high risk. Despite modest revenue growth, stock price performance remains weak. The latest financial report shows annual revenue at $1.34 billion USD and net income at $181 million USD, but the stock price increased only 2.32% over the past year. Analyst forecasts and ratings continue to highlight volatility and risk in mercari stock predictions.
Investors should monitor price forecast updates and analyst ratings closely. The current environment favors caution over a strong buy rating.
Technical Analysis of MCARY Stock

Image Source: unsplash
Moving Averages and Volume
Technical analysis helps investors understand how MCARY stock performs against key indicators. The 50-day and 200-day simple moving averages (SMA) provide insight into the current price forecast and momentum. The table below shows how the current price compares to these averages:
| Metric | Value | Comparison to Current Price ($7.49) |
|---|---|---|
| 50-day SMA | $8.47 | Current price is below this SMA |
| 200-day SMA | $7.38 | Current price is above this SMA |
| Current Price | $7.49 | Reference value |
The current price sits below the 50-day SMA, which signals a bearish price forecast for MCARY stock. However, the price remains slightly above the 200-day SMA, suggesting some support for investors considering a buy decision. Traders often use these moving averages to guide buy or sell strategies, especially when the price forecast shows volatility.
Trading volume also plays a critical role in technical analysis. During the recent price decline from $9.07 to $8.17 between June 30 and July 15, 2025, MCARY stock saw trading volume drop to 74% of its average. Short interest decreased by 37.5%, indicating less bearish sentiment. Lower volume during a price forecast downturn often means fewer investors are willing to buy, which can lead to weaker price support.
Investors should watch moving averages and volume trends closely. These indicators help refine the price forecast and inform buy strategies for MCARY stock.
Support and Resistance Levels
Support and resistance levels help investors identify where MCARY stock might reverse direction. The current price forecast suggests that support exists near the 200-day SMA at $7.38. If the price falls below this level, the next support zone may appear near $7.00. Resistance forms at the 50-day SMA of $8.47, which aligns with recent price forecast highs. If MCARY stock breaks above this resistance, traders may consider a buy opportunity.
- Key support levels: $7.38 and $7.00
- Key resistance levels: $8.47 and $9.00
These levels guide investors on when to buy or sell based on the price forecast. Strong resistance often limits upward movement, while solid support can trigger a buy signal if the price forecast improves. Investors should use these levels with moving averages and volume data to make informed buy decisions.
Technical analysis does not guarantee future performance. Investors should combine price forecast data with other research before making buy or sell decisions on MCARY stock.
Mercari Stock Risk Factors
Volatility and Downside Risks
Mercari’s stock has experienced notable volatility over the past year. The price fluctuated between a low of $5.50 and a high of $9.90, with the current value near $6.78. These swings reflect ongoing challenges in the e-commerce sector. Increased competition from platforms like eBay and Poshmark has pressured Mercari’s market share, leading to unpredictable stock movements. Regulatory changes, such as new sales tax and privacy laws, raised operational costs and affected profitability. These factors contributed to a net loss of $30 million in Q3 2023 and a high debt-to-equity ratio of 1.5.
Analyst reports highlight that operational risks, including fulfillment challenges and cybersecurity threats, have raised costs and caused fluctuations in stock performance. Mercari responded by investing $50 million in cybersecurity and improving operational efficiency. These actions aim to reduce downside risks and stabilize the business.
Analyst sentiment remains cautious. UBS Securities recently upgraded Mercari’s rating from Neutral to Buy, raising the target price. This upgrade reflects expectations that operating profit margins will improve and growth potential exists in Mercari’s fintech business. However, most analyst forecasts still warn of high volatility and recommend careful monitoring of stock trends.
External Market Pressures
External market pressures continue to shape Mercari’s stock outlook. Slower retail e-commerce growth, with a rate of 7.7% in 2022 compared to 14.2% in 2021, reduced transaction volume and pressured stock performance. Analyst coverage points to industry competition and regulatory changes as major risks. The following table summarizes key risk factors and Mercari’s responses:
| Risk Factor | Impact on Mercari Stock and Business | Mitigation Strategy and Response |
|---|---|---|
| Industry Competition | Market share pressure, stock volatility | Enhancing user experience, marketing efforts |
| Regulatory Changes | Increased costs, affected profitability and stock performance | Compliance updates, legal consultations |
| Market Conditions | Reduced transaction volume, pressured stock | Expanding product offerings |
| Operational Risks | Raised costs, stock fluctuations | Investment in cybersecurity, operational efficiencies |
| Financial Risks | Net losses, high debt-to-equity ratio, stock volatility | Diversifying revenue streams, focusing on profitability |
Analyst upgrades, such as those from UBS Securities, indicate cautious optimism. They expect operating profit margins to improve and see growth potential in Mercari’s fintech business. Most analyst reports, however, advise investors to remain alert to sector challenges and monitor stock performance closely.
Portfolio Impact
Buy, Hold, or Sell?
Investors face a challenging decision with MCARY. The recent negative trend and volatile price forecast create uncertainty for every investment strategy. Short-term traders see frequent swings in the price forecast, which makes timing a buy or sell difficult. Long-term investors notice that the price forecast points to continued risk, with no clear upward momentum.
Growth-focused investors may hesitate to buy. The price forecast shows sharp declines and only brief recoveries. Those who already hold MCARY must weigh the risk of further losses against the chance of a rebound. The hold strategy appeals to investors who believe in Mercari’s long-term potential, but the price forecast does not support a strong recovery soon.
Value investors often look for opportunities to buy when prices drop. However, the current price forecast suggests that MCARY may not have reached its lowest point. The risk of further declines remains high. Investors who want to sell may find this an appropriate time, especially if their investment goals focus on capital preservation. The price forecast indicates that waiting for a significant rebound could take time.
The table below summarizes the impact of the current trend on different investor types:
| Investor Type | Likely Action | Rationale Based on Price Forecast |
|---|---|---|
| Short-term Trader | Sell | High volatility, unclear buy signals |
| Long-term Holder | Hold | Belief in recovery, but weak forecast |
| Value Investor | Hold/Sell | Wait for lower entry, avoid buy now |
| Growth Investor | Sell | Price forecast shows limited upside |
Note: The price forecast for MCARY remains negative. Investors should review their risk tolerance before making a buy, hold, or sell decision.
Actionable Recommendations
Investors should approach MCARY with caution. The price forecast signals ongoing volatility and downside risk. Those considering how to buy mercari stock should wait for a more stable price forecast before entering a position. The current environment does not favor aggressive buy strategies.
Here are practical recommendations for managing MCARY in a portfolio:
- Monitor the Price Forecast Daily
The price forecast for MCARY changes quickly. Investors should track updates and adjust their buy, hold, or sell strategy as new data emerges. - Set Clear Investment Goals
Investors must define their objectives. Those seeking growth may choose to sell and reallocate funds. Income-focused investors may hold, but only if they accept the risk outlined in the price forecast. - Use Stop-Loss Orders
To limit losses, investors can set stop-loss orders. This tool helps automate the sell process if the price forecast turns sharply negative. - Diversify the Portfolio
Relying on a single investment increases risk. Investors should hold a mix of assets to reduce the impact of MCARY’s negative price forecast. - Review Analyst Recommendations Regularly
Analyst recommendations and the price forecast often change after earnings or news events. Investors should check for updates before making a buy, hold, or sell move. - Avoid Emotional Decisions
The price forecast for MCARY may cause stress. Investors should base buy, hold, or sell decisions on data and recommendations, not emotions.
Tip: Investors who want to learn how to buy mercari stock should research broker platforms, review the latest price forecast, and consider analyst recommendations before placing an order.
MCARY stock shows a negative trend, with recent price drops and mixed technical signals. The table below highlights key financial indicators for long-term investors:
| Metric/Indicator | Value/Trend |
|---|---|
| 1-Year Price Change | +15.77% |
| Recent 5-Day Price Change | -14.27% vs S&P 500 |
| Dividend Yield | 0% (No dividend) |
| P/E Ratio | 13.88x |
| P/B Ratio | 3.51x |
| Market Cap | $2.4 Billion |
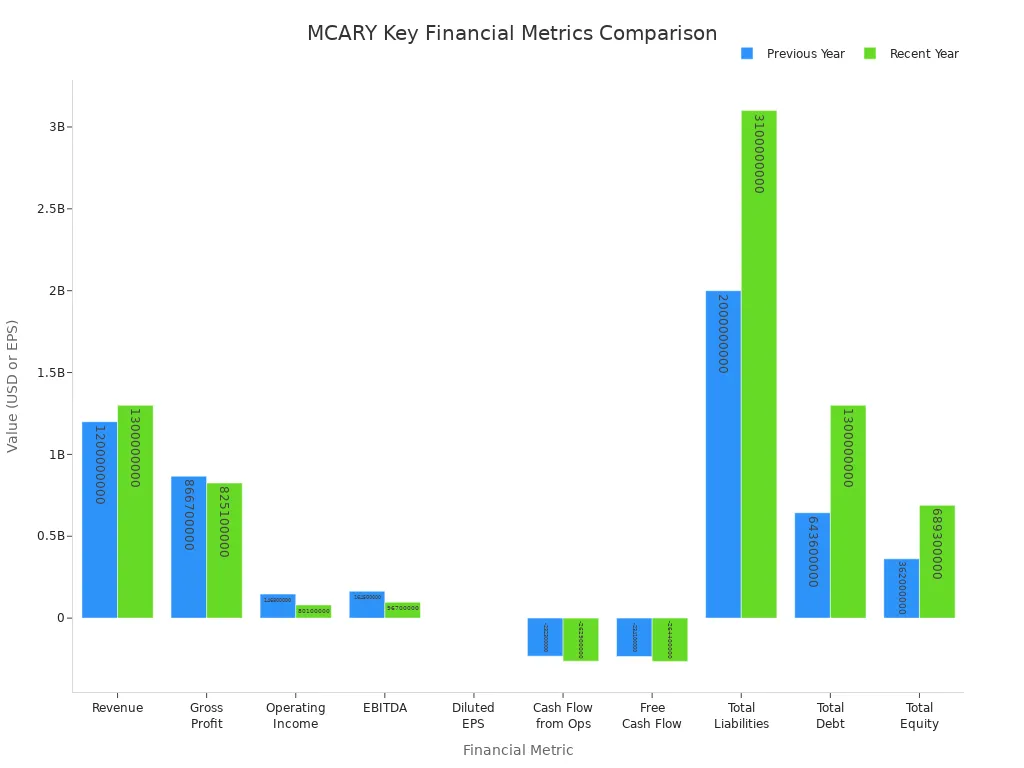
| Revenue Growth | Increased from $1.2B to $1.3B |
| Gross Profit | Declined from $866.7M to $825.1M |
| Operating Income | Decreased from $146.8M to $80.1M |
| EBITDA | Decreased from $164.5M to $96.7M |
| Diluted EPS | Decreased from $0.27 to $0.12 |
| Cash Flow from Operations | Negative (-$232.3M and -$262.9M recent years) |
| Free Cash Flow | Negative (-$234.1M and -$264.4M recent years) |
| Total Liabilities | Increased from $2B to $3.1B |
| Total Debt | Increased from $643.6M to $1.3B |
| Total Equity | Increased from $362M to $689.3M |
| Technical Indicators | Mixed: Short-term sell signals, long-term buy signals |
| Analyst Coverage | Limited, no consensus rating or price target |
| Share Buyback | Yes |
Analysts remain cautious, with only a few upgrades and no clear price target. Investors should buy only after reviewing their risk profile and understanding the potential for further declines. Many investors buy shares when technical indicators show long-term buy signals, but short-term sell signals suggest waiting. Those who buy now face high volatility. Investors who want to buy should set clear goals and use stop-loss orders. Some may buy for a rebound, while others may sell to avoid losses. Investors should buy only if they accept the risks. News and analyst updates can change the buy or sell outlook quickly. Investors should buy only after careful review and may sell if their risk tolerance is low. Buy decisions should match personal goals and risk tolerance. Investors who buy must monitor the market and analyst coverage. Buy only when confident in the outlook.
Investors should identify their risk tolerance before making a buy or sell decision. Behavioral biases, such as loss aversion, can impact buy and sell choices. Consulting a financial advisor may help investors buy or sell with confidence.
FAQ
What causes MCARY stock to be so volatile?
MCARY stock reacts quickly to news, earnings reports, and analyst ratings. Investors often see large price swings in short periods. High trading volume and changing market sentiment also contribute to this volatility.
How do analysts rate MCARY stock right now?
Most analysts remain cautious. They issue more hold and sell ratings than buy recommendations. Analyst coverage is limited, and no clear consensus exists on future price targets.
Should investors consider MCARY for long-term growth?
MCARY shows some growth potential, but the current trend points to high risk. The stock faces strong competition and market challenges. Investors should review their risk tolerance before making long-term decisions.
What technical indicators matter most for MCARY?
Moving averages, trading volume, and support or resistance levels provide key insights. Investors use these indicators to spot trends and make informed buy or sell choices.
How can investors manage risk with MCARY stock?
Investors can set stop-loss orders, diversify their portfolios, and monitor analyst updates. Regularly reviewing financial news and technical signals helps reduce risk and improve decision-making.
The high volatility of MCARY stock highlights a critical need for investors: efficient tools and low-cost financial services that can keep up with a fast-moving market. If you are tired of complex asset management across different platforms, high remittance fees, and opaque exchange rates, consider BiyaPay your all-in-one solution.
Our platform allows you to participate in US and Hong Kong stocks without needing an overseas bank account, all in one place. We support seamless conversion between various fiat and digital currencies and offer a low remittance fee of just 0.5%, ensuring your capital moves efficiently and securely. Use our real-time exchange rate converter to see how you can maximize your capital, and register now to get started with smarter, more efficient global financial management.
*This article is provided for general information purposes and does not constitute legal, tax or other professional advice from BiyaPay or its subsidiaries and its affiliates, and it is not intended as a substitute for obtaining advice from a financial advisor or any other professional.
We make no representations, warranties or warranties, express or implied, as to the accuracy, completeness or timeliness of the contents of this publication.
Related Blogs of

US Stock Market Holiday Countdown: How Investors Should Position for Next Week's Trading


Micro Dow, Micro Nasdaq, Micro S&P Futures Comprehensive Comparison – Helping You Find the Best Trading Choice


How to Choose US Major Indices: Pros and Cons Analysis of S&P 500, Dow Jones, and Nasdaq


Focusing on AI and Semiconductors: In-Depth Analysis of 10 Leading Future US Tech Stocks

Choose Country or Region to Read Local Blog

Contact Us


BIYA GLOBAL LLC is a licensed entity registered with the U.S. Securities and Exchange Commission (SEC No.: 802-127417); a certified member of the Financial Industry Regulatory Authority (FINRA) (Central Registration Depository CRD No.: 325027); regulated by the Financial Industry Regulatory Authority (FINRA) and the U.S. Securities and Exchange Commission (SEC).
BIYA GLOBAL LLC is registered with the Financial Crimes Enforcement Network (FinCEN), an agency under the U.S. Department of the Treasury, as a Money Services Business (MSB), with registration number 31000218637349, and regulated by the Financial Crimes Enforcement Network (FinCEN).
BIYA GLOBAL LIMITED is a registered Financial Service Provider (FSP) in New Zealand, with registration number FSP1007221, and is also a registered member of the Financial Services Complaints Limited (FSCL), an independent dispute resolution scheme in New Zealand.