FNGU Stock in 2025 Opportunities and Challenges Ahead


Image Source: pexels
FNGU stock offers compelling opportunities in 2025, yet major challenges remain. Microsectors FANG 3X Leveraged ETNs deliver high risk and high reward through exposure to top tech stock names. Traders often favor this fund for short-term moves, recognizing its extreme volatility. The following chart compares FNGU stock’s risk and performance against similar leveraged tech ETNs in 2024, showing a strong correlation and similar drawdown profiles:
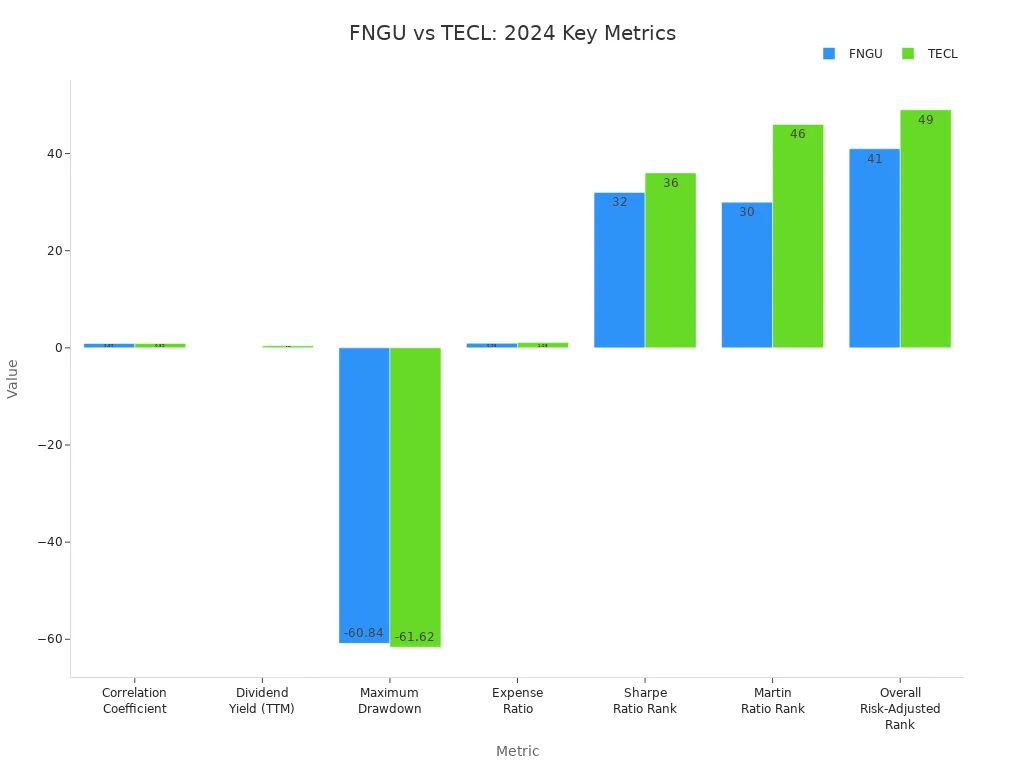
Microsectors FANG 3X Leveraged ETNs concentrate on a handful of stocks, amplifying both gains and losses. Investors must weigh growth potential against significant risks before deciding to buy or hold.
Key Takeaways
- FNGU offers high reward potential by providing 3x daily exposure to top tech stocks but carries significant risks due to its leverage and volatility.
- The stock suits short-term trading, not long-term holding, because daily leverage resets can erode returns over time.
- Strong tech sector growth and positive market drivers in 2025 may boost FNGU’s price, creating opportunities for traders.
- Effective risk management, including stop-loss orders and monitoring support and resistance levels, is essential to protect investments.
- Using AI tools and technical analysis together can help traders identify the best times to buy and sell FNGU stock.
FNGU Stock Outlook
2025 Market Drivers
FNGU stock will likely respond to several important market drivers in 2025. The Microsectors FANG 3X Leveraged ETNs track the NYSE FANG+ Index, which includes ten major technology companies. These companies often lead the market during periods of innovation and strong earnings. In Q2 2025, the stock soared over 60% as the artificial intelligence sector grew rapidly and the Federal Reserve adopted a more dovish policy. This environment created strong momentum for leveraged tech ETNs like Microsectors FANG 3X Leveraged ETNs.
Note: The daily reset mechanism of Microsectors FANG 3X Leveraged ETNs causes compounding effects. This makes the product unsuitable for long-term investors who want to buy and hold. Instead, traders often use it for short-term moves, taking advantage of rapid price changes.
Macroeconomic trends play a key role in shaping the outlook for FNGU stock. Shifts in Federal Reserve policy, earnings reports, and innovation cycles in the tech sector can cause amplified and rapid price movements. When the market shows strong momentum and seasonality, Microsectors FANG 3X Leveraged ETNs can deliver significant gains. However, bearish sentiment after disappointing earnings or policy changes can quickly reverse these gains.
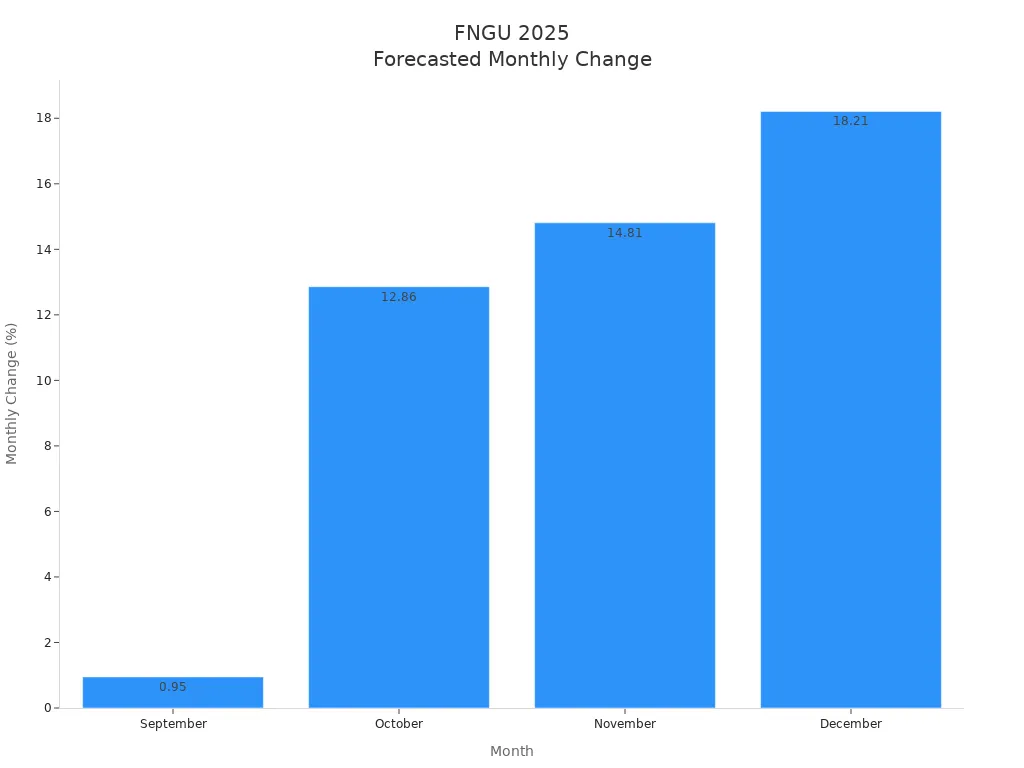
The following chart shows the forecasted monthly percentage change for FNGU stock from September to December 2025:
Risk vs. Reward
Analysis of FNGU stock in 2025 highlights both strong upside potential and significant risks. Microsectors FANG 3X Leveraged ETNs provide three times the daily exposure to mega-cap tech stocks. This leverage can amplify gains during favorable conditions, but it also increases losses when the market turns against these stocks.
Technical forecast data shows strong buy signals from both short and long-term moving averages. Analysts predict a 38.79% price increase over the next three months. Rising trading volume supports this positive momentum. Support levels appear around $25.09, with a recommended stop-loss at $25.42, which helps control downside risk. Daily volatility remains relatively low at about 4.5%, suggesting that price swings may be less severe than in previous years.
| Month | Forecasted Price Range (USD) | Monthly Change (%) |
|---|---|---|
| September | Around $88 - $89 | +0.95% |
| October | Around $90 - $104 | +12.86% |
| November | Around $111 - $131 | +14.81% |
| December | Around $137 - $169 | +18.21% |
Despite these positive signals, fundamental analysis from ValueRay estimates the fair value of FNGU stock at about $22.43. This suggests the stock may be overvalued, with a possible downside risk of about 15.07% from current levels. The Microsectors FANG 3X Leveraged ETNs structure introduces tracking errors and compounding effects, especially in volatile or overbought markets. Investors must weigh the potential for rapid gains against the risk of sharp losses.
Tip: Microsectors FANG 3X Leveraged ETNs can enhance returns during strong tech rallies, but investors should monitor macroeconomic conditions and use disciplined risk management strategies.
Performance Overview
Recent Returns
FNGU stock delivered notable performance during 2023 and 2024. Analysis of year-to-date returns shows that the stock price moved sharply in response to technology sector developments. In early 2023, the stock price started near $30 USD and climbed to a peak of $110 USD by December. This strong rising trend reflected investor optimism about artificial intelligence and cloud computing. The calendar year swings highlighted the volatility of leveraged products. By mid-2024, the stock price dropped to $65 USD before rebounding to $120 USD in July. These movements resulted from earnings reports and changes in Federal Reserve policy.
The 52-week price range for FNGU stock extended from $55 USD to $125 USD. This wide range demonstrated the impact of leverage and sector momentum. Investors who tracked the stock price closely saw opportunities for short-term gains. Analysis of monthly returns revealed that the stock price often followed a strong rising trend during periods of positive tech news. For example, when major companies in the NYSE FANG+ Index announced record profits, FNGU stock price surged.
Note: Investors should review historical price charts and exchange rates (USD exchange rates) before making decisions. Analysis of past performance does not guarantee future results.
Volatility Trends
Analysis of volatility trends in FNGU stock shows that price swings remain a key feature. The leveraged structure amplifies daily movements. During periods of market uncertainty, the stock price can change by 5% or more in a single session. In 2024, volatility increased after several tech companies missed earnings forecasts. The stock price responded quickly, with sharp declines followed by rapid recoveries.
Traders use technical analysis to identify support and resistance levels. The forecast for 2025 suggests continued volatility, especially around earnings season and policy announcements. Analysis of historical data indicates that FNGU stock price may experience large swings, but the overall trend remains positive when the tech sector performs well. Investors should monitor price trends and use risk management strategies to protect capital.
MicroSectors FANG 3X Leveraged ETNs
Structure and Holdings
Microsectors fang 3x leveraged etns stand out due to their unique structure. These products are senior unsecured debt securities issued by Bank of Montreal. Unlike traditional ETFs, microsectors fang 3x leveraged etns do not hold physical stocks. Instead, they use derivatives such as swaps to link returns to the Solactive FANG & Innovation Index. This approach exposes investors to issuer credit risk, as the notes are unsecured obligations. Microsectors fang 3x leveraged etns offer more precise, sector-specific exposure with only ten holdings, compared to many ETFs that include twenty or more stocks. The returns of microsectors fang 3x leveraged etns are contractually tied to the index, which limits tracking error risk. However, investors do not receive dividends, and the leverage resets daily, making these products suitable mainly for short-term trading.
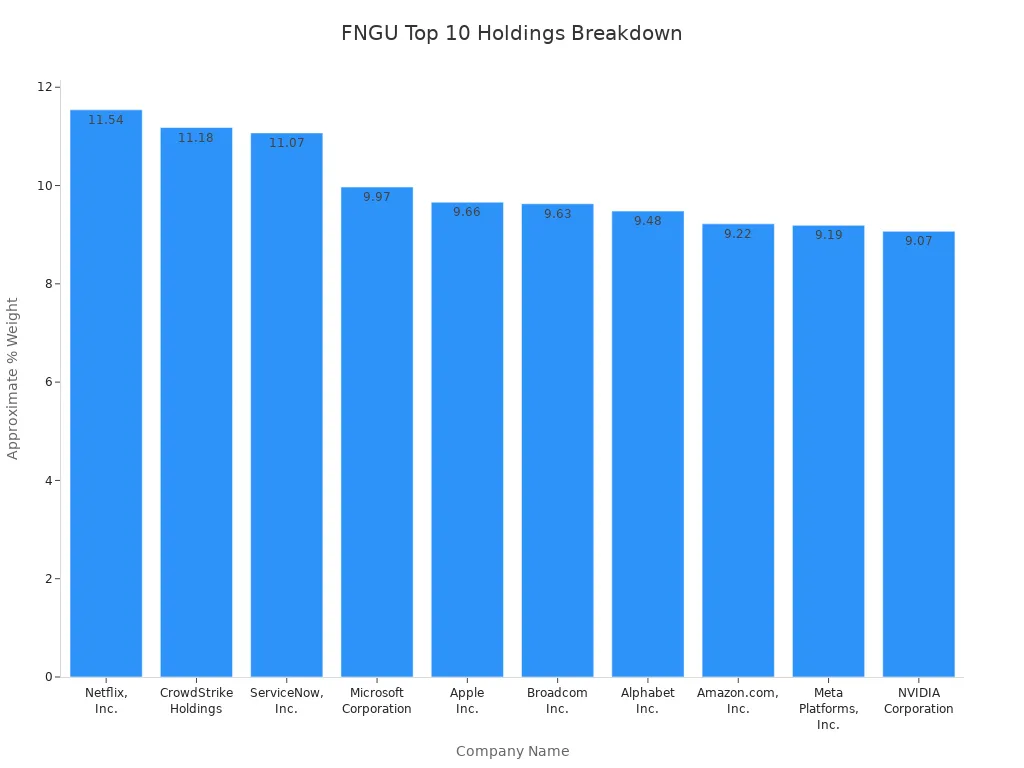
The top holdings in microsectors fang 3x leveraged etns reflect a heavy concentration in leading technology companies. The table below shows the approximate weights of each company:
| Rank | Company Name | Approximate % Weight |
|---|---|---|
| 1 | Netflix, Inc. | 11.54% |
| 2 | CrowdStrike Holdings | 11.18% |
| 3 | ServiceNow, Inc. | 11.07% |
| 4 | Microsoft Corporation | 9.97% |
| 5 | Apple Inc. | 9.66% |
| 6 | Broadcom Inc. | 9.63% |
| 7 | Alphabet Inc. | 9.48% |
| 8 | Amazon.com, Inc. | 9.22% |
| 9 | Meta Platforms, Inc. | 9.19% |
| 10 | NVIDIA Corporation | 9.07% |
Leverage Impact
Microsectors fang 3x leveraged etns use a daily rebalancing mechanism to maintain their 3x leverage. This process means the fund resets its leverage ratio every day, amplifying both gains and losses. For short-term investors, this structure can create opportunities to benefit from strong market moves. However, daily rebalancing can also increase volatility, especially during large market swings. In some cases, rebalancing trades may account for up to half of end-of-day trading volume, which can further amplify price changes.
For long-term investors, the compounding effects of daily rebalancing can erode returns, particularly in volatile or sideways markets. Microsectors fang 3x leveraged etns are not designed for buy-and-hold strategies. Investors should actively manage risk, use stop-loss orders, and monitor intraday volatility. The 3x leverage magnifies both the potential for rapid gains and the risk of steep losses, as seen in the fund’s historical drawdowns and recoveries.
Opportunities in 2025

Image Source: unsplash
Tech Sector Growth
The technology sector continues to show a strong rising trend in 2025. Many investors see this as a key opportunity for those who want to buy FNGU stock. Major companies in the NYSE FANG+ Index, such as Apple, Amazon, and Alphabet, lead the market with new products and services. Their focus on artificial intelligence, cloud computing, and digital advertising drives innovation. This growth creates a favorable environment for leveraged products. When these companies report strong earnings, the stock price often reacts quickly. Investors look for a buy signal when the trend remains positive.
Many analysts expect the technology sector to outperform other industries. They see a buying opportunity when the stock price pulls back after positive news. The demand for cloud services and AI tools continues to rise. This demand supports the price of FNGU stock. Investors who buy during periods of weakness may benefit from future gains. The sector’s growth also attracts new capital, which can push the stock price higher.
Potential Catalysts
Several factors could trigger significant price movements in FNGU stock during 2025:
- A decrease in interest rates often boosts the price of technology stocks. Lower rates make it easier for companies to borrow and invest in growth.
- Technical chart patterns, such as the Cup and Handle or high tight bull flags, may signal a buy opportunity. These patterns often indicate a bullish trend or a buy signal.
- Strong performance and innovation from companies in the NYSE FANG+ Index can drive the stock price higher.
- Positive news in the technology sector or broader market, such as favorable policy changes or economic updates, can create momentum.
- FNGU stock uses 3X leverage, which amplifies both gains and losses. This leverage increases the chance for large price swings, making it important for investors to watch for a buy signal and manage risk.
Note: Investors should monitor these catalysts closely. Quick reactions to news or technical signals can help capture the best opportunity to buy or sell.
Challenges and Risks

Image Source: pexels
Volatility Factors
Microsectors fang 3x leveraged etns present unique volatility challenges. The daily reset of leverage amplifies both gains and losses, making the stock highly sensitive to market swings. Traders often see price changes of 5% or more in a single session. This volatility can create opportunities for short-term gains, but it also increases the risk of steep losses. Investors who do not monitor the stock closely may experience unexpected drawdowns. The compounding effect of daily leverage can erode returns, especially during sideways or choppy markets. Many traders use stop-loss orders to manage risk, but these tools do not guarantee protection against rapid declines. The structure of microsectors fang 3x leveraged etns means that volatility remains a constant concern for anyone who buys or sells the stock.
Macroeconomic Uncertainty
Macroeconomic factors play a major role in the risk profile of microsectors fang 3x leveraged etns. The Federal Reserve’s interest rate decisions, such as a possible 50 basis points rate cut, create significant uncertainty. A larger-than-expected rate cut may signal economic weakness, causing investor anxiety and unpredictable reactions in the stock market. Microsectors fang 3x leveraged etns, tied to tech stocks, react quickly to these changes. Uncertainty around Federal Open Market Committee meetings increases risk for leveraged positions. The bond market may price in rate cuts before the stock market responds, adding to unpredictability. These factors—rate cuts, signals of economic strength or weakness, and resulting market volatility—remain key risks for microsectors fang 3x leveraged etns in 2025.
Note: Investors should track macroeconomic news and Federal Reserve announcements. Quick changes in policy can trigger sharp moves in the stock, making risk management essential.
Regulatory Concerns
Regulatory changes can impact microsectors fang 3x leveraged etns and the underlying tech sector. New rules on data privacy, antitrust actions, or changes in listing requirements may affect the value of the stock. Investors must also consider the risk of capital gains taxes, especially when frequent trading leads to short holding periods. ETN rollovers can create tax events and may affect returns. The correlation between microsectors fang 3x leveraged etns and other leveraged tech ETFs limits diversification. When tech stocks move together, losses can compound across multiple products. Traders who want to sell during periods of high volatility may face liquidity challenges. Monitoring regulatory developments and understanding tax implications helps investors manage these risks.
| Risk Factor | Impact on Microsectors FANG 3X Leveraged ETNs |
|---|---|
| Leverage Drawbacks | Amplifies gains and losses |
| Capital Gains Taxes | Frequent trading increases tax liability |
| ETN Rollovers | May trigger taxable events |
| Correlation with Tech ETFs | Limits diversification benefits |
Trading Strategies
Short-Term Approaches
Traders often seek to buy FNGU stock for short-term gains. Historical performance shows that AI-powered trading bots, such as the FNGU AI Trading Bot Agent, have achieved an 86.6% win rate over 67 trades in three months. These bots use machine learning to recognize patterns in intraday timeframes, focusing on long-only positions that follow the short-term trend. Stock Traders Daily’s AI trading report generates actionable buy signals by identifying support and resistance levels and optimizing entry and exit points. Technical analysis tools, including moving averages and oscillators, help traders confirm momentum and trend direction. Barchart Opinions uses 13 technical indicators to back-test hypothetical trades, providing insights into buy and sell signals for FNGU. Traders who combine AI-generated signals with technical analysis often improve their ability to buy at optimal price levels.
Tip: Traders should use predictive AI and technical indicators together to identify the best time to buy FNGU stock and maximize short-term returns.
Risk Management
Effective risk management is essential when trading leveraged ETNs like FNGU. The official product documentation advises sophisticated investors to monitor their holdings actively and continuously. Leverage and daily resets can cause significant deviations from the underlying index, leading to potential total loss. Traders should treat FNGU as a daily trading tool and integrate real-time market analysis with support and resistance monitoring. A market analysis report highlights the importance of dynamic exposure management and updated trading plans. Monitoring price action and adjusting positions quickly helps traders avoid large losses. Using stop-loss orders and limiting open trades can further reduce risk when buying FNGU stock.
Note: Risk controls such as support and resistance monitoring and real-time analysis increase the probability of trading in the direction of the market flow.
Support and Resistance
Support and resistance levels play a critical role in trading outcomes for FNGU stock. Traders use pivot points, calculated from daily high, low, and close prices, to identify multiple support (S1, S2, S3) and resistance (R1, R2, R3) levels. These levels help traders decide when to buy or sell, signaling potential price reversals or confirmations. The table below summarizes how support and resistance affect trading decisions:
| Concept | Description | Impact on Trading Outcomes |
|---|---|---|
| Pivot Points | Calculated from daily high, low, and close prices; include support and resistance levels. | Signal potential price reversals or confirmations. |
| Support Levels | Price levels that limit downward moves. | Help traders time entries to buy and avoid further losses. |
| Resistance Levels | Price levels that limit upward moves. | Indicate when to take profits or consider short positions. |
| Standard Deviation Ranges | Statistical price bands based on volatility. | Help assess risk and potential breakout points. |
| Color-coded Cheat Sheet Areas | Blue below last price shows support; red above shows resistance. | Visual cues for anticipating price range or breakout. |
| Trading Range and Breakouts | Price within support and resistance stays in range; breakouts signal trend changes. | Guide decisions to hold or adjust positions for profitability. |
Traders who monitor support and resistance levels can identify buy signals and manage risk more effectively. These levels help traders anticipate price movements and adjust their strategies to align with the short-term trend.
FNGU stock presents both strong opportunities and notable risks for 2025. Recent gains, increased trading volume, and technical buy signals highlight positive momentum. However, the 3x leverage amplifies both gains and losses, making risk management essential.
- Leveraged ETFs like FNGU can deliver rapid price appreciation, but they suit short-term trading rather than long-term holding.
- Investors should use strict stop-loss limits and maintain portfolio diversification.
Understanding leverage and volatility remains critical. Staying informed and using disciplined strategies can help traders navigate the challenges ahead.
FAQ
What is FNGU stock?
FNGU stock is a 3x leveraged Exchange Traded Note (ETN) that tracks the NYSE FANG+ Index. It offers exposure to ten leading technology companies. The product uses derivatives to amplify daily returns. Investors should understand the risks before trading.
Is FNGU suitable for long-term investors?
FNGU is not designed for long-term holding. The daily reset of leverage can erode returns over time, especially in volatile markets. Most investors use FNGU for short-term trading strategies.
How does leverage affect FNGU’s performance?
Leverage magnifies both gains and losses. FNGU aims to deliver three times the daily return of its index. In volatile markets, compounding effects can cause actual returns to differ from expected results.
What are the main risks of trading FNGU?
Key risks include high volatility, potential for rapid losses, and tracking errors. Regulatory changes and tax implications may also impact returns. Investors should use strict risk management and monitor positions closely.
How can investors manage currency risk when trading FNGU?
Investors can track USD exchange rates using resources like XE.com. Monitoring exchange rates helps manage currency risk, especially for those trading from outside the United States.
Trading FNGU stock means embracing volatility for amplified returns. But managing this high-octane strategy demands a platform that’s as fast and flexible as the market itself. Navigating multiple accounts and high fees can slow you down, eating into potential profits. BiyaPay simplifies this by offering a unified solution for your global investment needs.
You can seamlessly convert fiat currencies and trade cryptocurrencies and traditional stocks on one platform, all with remittance fees as low as 0.5%. This allows you to seize opportunities as soon as they arise, with funds available for same-day transfers. Stop wrestling with different platforms and get the integrated power you need. Register with BiyaPay to streamline your trading and keep your focus on the market.
*This article is provided for general information purposes and does not constitute legal, tax or other professional advice from BiyaPay or its subsidiaries and its affiliates, and it is not intended as a substitute for obtaining advice from a financial advisor or any other professional.
We make no representations, warranties or warranties, express or implied, as to the accuracy, completeness or timeliness of the contents of this publication.
Related Blogs of

Focusing on AI and Semiconductors: In-Depth Analysis of 10 Leading Future US Tech Stocks


Is the W-8BEN Form Required for Opening a US Stock Account? Understand How to Save on Taxes in One Article


Annual Review: Best Performing US Stock ETFs in 2026 and the Logic Behind Them


US Stock Market Holiday Countdown: How Investors Should Position for Next Week's Trading

Choose Country or Region to Read Local Blog

Contact Us


BIYA GLOBAL LLC is a licensed entity registered with the U.S. Securities and Exchange Commission (SEC No.: 802-127417); a certified member of the Financial Industry Regulatory Authority (FINRA) (Central Registration Depository CRD No.: 325027); regulated by the Financial Industry Regulatory Authority (FINRA) and the U.S. Securities and Exchange Commission (SEC).
BIYA GLOBAL LLC is registered with the Financial Crimes Enforcement Network (FinCEN), an agency under the U.S. Department of the Treasury, as a Money Services Business (MSB), with registration number 31000218637349, and regulated by the Financial Crimes Enforcement Network (FinCEN).
BIYA GLOBAL LIMITED is a registered Financial Service Provider (FSP) in New Zealand, with registration number FSP1007221, and is also a registered member of the Financial Services Complaints Limited (FSCL), an independent dispute resolution scheme in New Zealand.