Should You Add VO Stock to Your Portfolio This Year


Image Source: unsplash
VO stock stands out as a strong contender for portfolios in 2024. Recent analysis shows its year-to-date return at 9.11%, with a ten-year annualized return of 10.05%. The Sharpe ratio of 1.09 and Sortino ratio of 1.57 highlight favorable risk-adjusted results. Investors benefit from an expense ratio of just 0.04%, making VO stock one of the most cost-efficient mid-cap ETFs available.
Professional analysis confirms that VO stock offers solid performance, low cost, and broad market exposure.
Key Takeaways
- VO stock offers strong returns with moderate risk, making it a solid choice for steady growth.
- The ETF has a very low expense ratio of 0.04%, helping investors keep more of their gains.
- VO provides broad exposure to mid-sized U.S. companies across many sectors, reducing risk through diversification.
- Investors receive regular quarterly dividends, adding a reliable income stream to their portfolios.
- VO suits long-term investors who want balanced growth, moderate risk, and cost efficiency in their portfolios.
VO Stock Overview

Image Source: pexels
What Is VO?
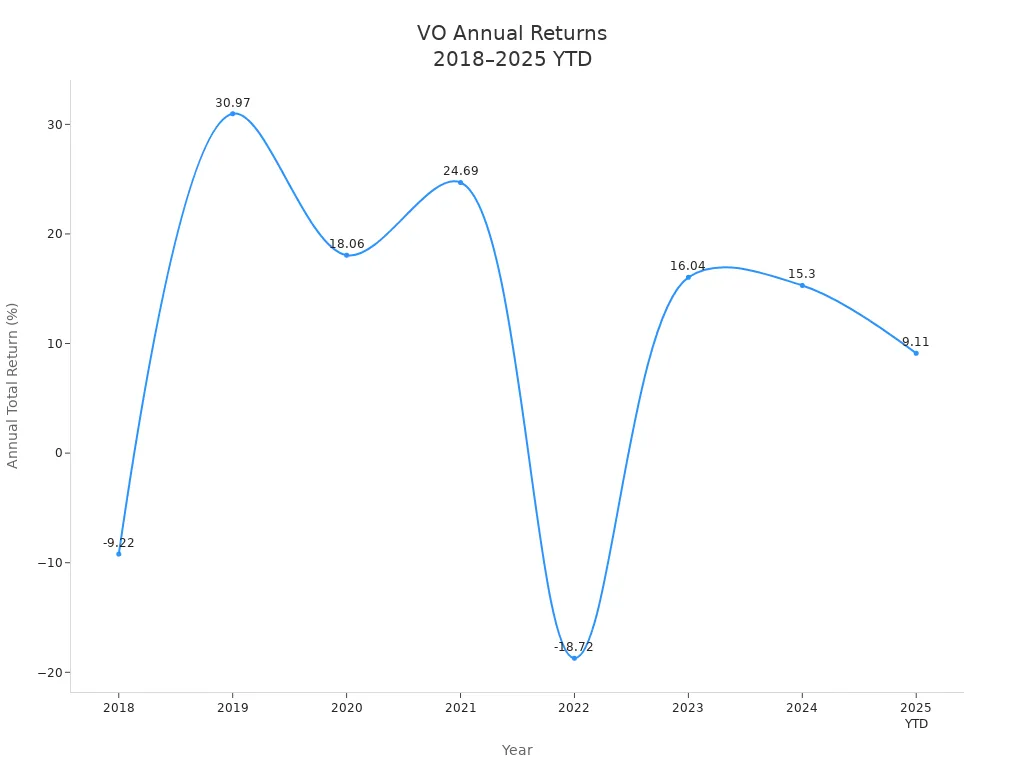
VO stock refers to the Vanguard Mid-Cap ETF, a fund designed to give investors exposure to mid-sized companies in the United States. The ETF tracks the CRSP US Mid Cap Index, which includes 316 stocks with market capitalizations between $2 billion and $10 billion. This approach allows investors to access a broad segment of the market that sits between large-cap and small-cap stocks. The fund has grown significantly since inception, with total assets under management reaching approximately USD 196.78 billion as of August 13, 2025.
The Vanguard Mid-Cap ETF offers a way to invest in companies that often show strong growth potential while maintaining moderate risk. Investors can benefit from the fund’s large asset base and its ability to weather market fluctuations.
| Year | Annual Total Return (%) |
|---|---|
| 2018 | -9.22 |
| 2019 | 30.97 |
| 2020 | 18.06 |
| 2021 | 24.69 |
| 2022 | -18.72 |
| 2023 | 16.04 |
| 2024 | 15.30 |
| 2025 YTD | 9.11 |
Investment Approach
The Vanguard Mid-Cap ETF uses a passive investment strategy by tracking the CRSP US Mid Cap Index. This method provides broad diversification across mid-cap stocks, balancing growth opportunities with moderate risk. The fund blends both growth and value stocks, which helps smooth out returns over time.
- VO holds 316 mid-cap stocks, offering exposure to a wide range of industries.
- Mid-cap stocks typically provide higher returns than large-cap stocks, but with less volatility than small-cap stocks.
- The ETF’s low expense ratio of 0.04% makes it a cost-efficient choice for investors.
- Diversification helps reduce risk and supports steady performance.
| Aspect | Details |
|---|---|
| Proportion of Value in VOO | Approximately 60% of VOO by weight is VOOV (Value stocks) |
| Proportion of Growth in VOO | Approximately 65% of VOO by weight is VOOG (Growth stocks) |
| Overlap between VOOV and VOOG | About 27% overlap by weight, indicating some stocks exhibit both growth and value traits |
| Market Tilt | VOO leans towards growth due to market composition and tech sector exposure (~30%) |
| Historical Returns | Value stocks have historically outperformed growth stocks and have higher expected returns |
| Recent Decade (2010-2019) | Growth stocks outperformed, driven largely by Big Tech |
| Impact on VOO Returns | The blend captures both styles but leans growth; owning VOOV and VOOG separately offers no clear advantage over VOO due to overlap and fees |
| Valuation Context | Growth stocks are currently expensive relative to history; value stocks are cheap, suggesting potential future outperformance of value |
The blend of growth and value stocks in VO stock supports a balanced investment approach. Investors seeking diversification and growth potential may find the Vanguard Mid-Cap ETF an attractive option.
Performance & Risk
Image Source: unsplash
Recent Performance
VO stock has delivered strong results across multiple time frames. Investors often look at total returns to gauge the effectiveness of an ETF. The following table summarizes VO’s returns for several key periods:
| Return Period | Total Return (%) |
|---|---|
| Year-to-Date | 10.87 |
| Trailing 1-Year | 23.93 |
| Trailing 3-Year | 40.28 |
| Trailing 5-Year | 76.56 |
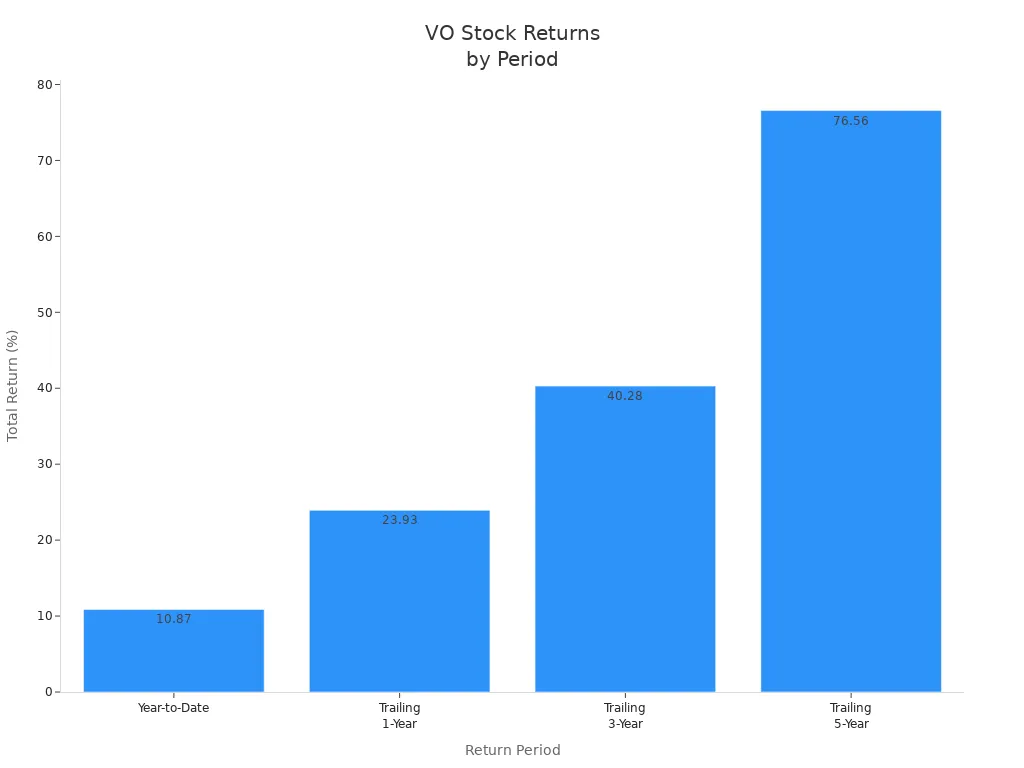
VO’s year-to-date performance stands at 10.87%. Over the past year, the ETF returned 23.93%. The three-year and five-year returns reached 40.28% and 76.56%, respectively. This consistent growth highlights the fund’s ability to capture mid-cap market opportunities. Investors seeking growth and stability may find these results appealing.
Risk Profile
Analysis of VO’s risk profile reveals a moderate risk level compared to other mid-cap ETFs. The ETF carries a beta of 1.04, which means its price moves slightly more than the overall market. The trailing three-year standard deviation is 18.82%, indicating moderate volatility. Analysts assign VO a Zacks ETF Rank of 2 (Buy), reflecting positive expectations for future performance. This ranking considers asset class return, expense ratio, and momentum.
Note: VO’s risk profile balances growth potential with moderate volatility, making it suitable for investors who want exposure to mid-cap stocks without excessive risk.
Technical analysis supports this view. VO’s trading activity shows steady volume and liquidity, which helps reduce trading costs and slippage. Compared to similar funds like IWR and IJH, VO offers competitive risk characteristics and a lower expense ratio. This combination of moderate risk and cost efficiency strengthens its appeal.
Benchmark Comparison
Investors often compare VO to large-cap ETFs such as VOO to understand relative performance and risk. Analysis shows that VO’s volatility is higher than VOO’s. The table below illustrates this difference:
| ETF | Volatility (%) | Interpretation |
|---|---|---|
| VO (Vanguard Mid-Cap ETF) | 3.51 | Higher volatility, larger price fluctuations, riskier |
| VOO (Vanguard S&P 500 ETF) | 3.07 | Lower volatility, less price fluctuation, less risky |
VO’s higher volatility means investors may experience larger price swings compared to large-cap ETFs. However, this risk can lead to higher long-term returns. The ETF’s five-year annualized return is 11.63%, which compares favorably to many large-cap funds.
Further analysis of VO against its benchmark, the Vanguard Mid-Cap Value ETF (VOE), provides deeper insight. The table below summarizes key performance and risk metrics over the past five years:
| Metric | VO (Vanguard Mid-Cap ETF) | VOE (Vanguard Mid-Cap Value ETF) |
|---|---|---|
| 5-Year Annualized Return | 11.63% | 12.78% |
| Sharpe Ratio | 1.09 | 0.74 |
| Sortino Ratio | 1.57 | 1.09 |
| Omega Ratio | 1.23 | 1.15 |
| Calmar Ratio | 1.00 | 0.64 |
| Martin Ratio | 3.62 | 1.92 |
| Maximum Drawdown | -58.88% | -61.54% |
| Current Drawdown | -1.37% | -2.13% |
| Expense Ratio | 0.04% | 0.07% |
| Dividend Yield | 1.50% | 2.20% |
| Correlation | 0.95 | N/A |
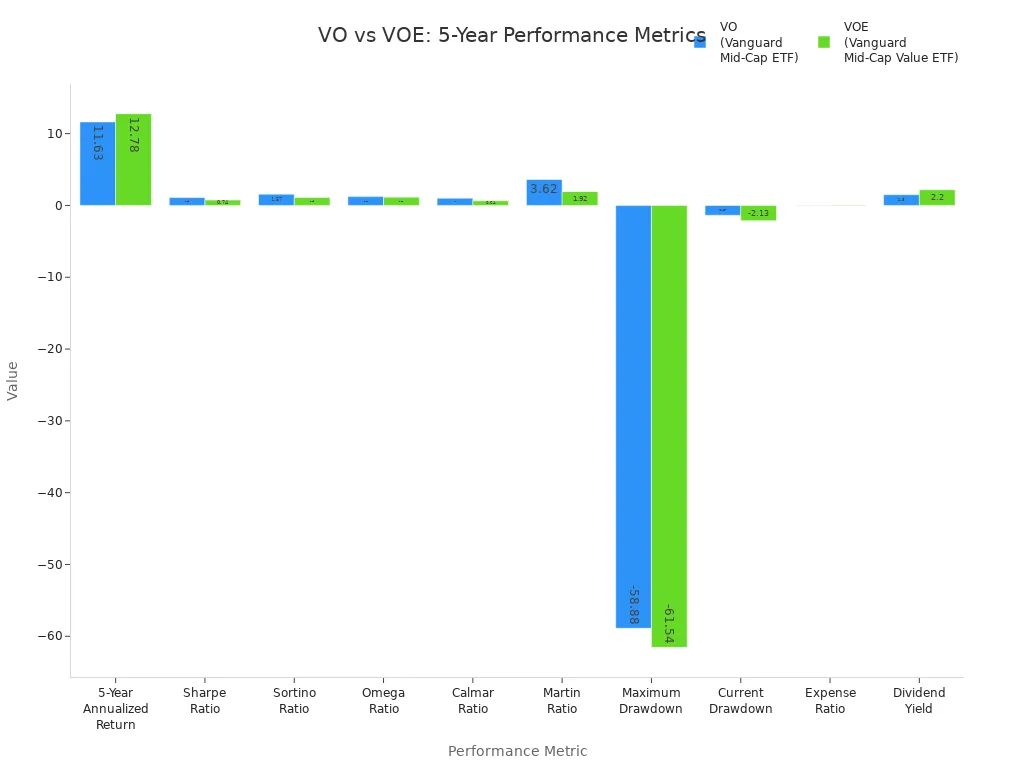
VO’s analysis shows a strong Sharpe ratio of 1.09 and a Sortino ratio of 1.57, both higher than VOE. These ratios measure risk-adjusted performance, indicating that VO delivers better returns for each unit of risk taken. The ETF also maintains a lower expense ratio, which supports long-term performance.
Trading volume remains robust, ensuring that investors can enter and exit positions efficiently. This liquidity reduces the impact of bid-ask spreads on trading costs. The ETF’s valuation metrics, such as price-to-earnings and price-to-book ratios, remain in line with historical averages, suggesting that VO is neither overvalued nor undervalued at current levels.
Costs & Dividends
Expense Ratio
The Vanguard Mid-Cap ETF (VO) stands out for its low expense ratio. Investors pay only 0.04% annually, which is much lower than the average for mid-cap ETFs. Most competitors charge between 0.3% and 0.9%. This cost advantage allows investors to keep more of their returns over time. The table below compares VO’s expense ratio with another popular mid-cap ETF:
| Fund Symbol | Expense Ratio | Comparison to Average Mid-Cap ETF Expense Ratio |
|---|---|---|
| VO | 0.04% | Significantly lower than average (0.3% - 0.9%) |
| VOT | 0.07% | Also lower than average, but higher than VO |
A lower expense ratio means less money goes toward fees and more stays invested. Over several years, this difference can add up, especially for long-term investors. VO’s cost efficiency makes it a preferred choice for those seeking to maximize returns.
Investors who focus on minimizing costs often select VO for its industry-leading expense ratio.
Dividend Yield
VO provides a steady stream of dividends to shareholders. The current annual dividend yield is approximately 1.5%. Dividends are paid quarterly, with the most recent payment of $1.07 per share on June 30, 2025. The next ex-dividend date falls between September 26 and September 29, 2025. The annual dividend rate stands at $4.27 per share, reflecting consistent distributions.
| Metric | Value |
|---|---|
| Current Dividend Yield | 1.49% |
| Annual Dividend Amount | $4.27 per share |
| Most Recent Dividend Payment | $1.07 per share on Jun 30, 2025 |
| Most Recent Ex-Dividend Date | Mar 27, 2025 |
| Dividend Payment Frequency | Quarterly |
VO’s dividend yield has shown stability and modest growth over the past five years. The chart below illustrates this trend:
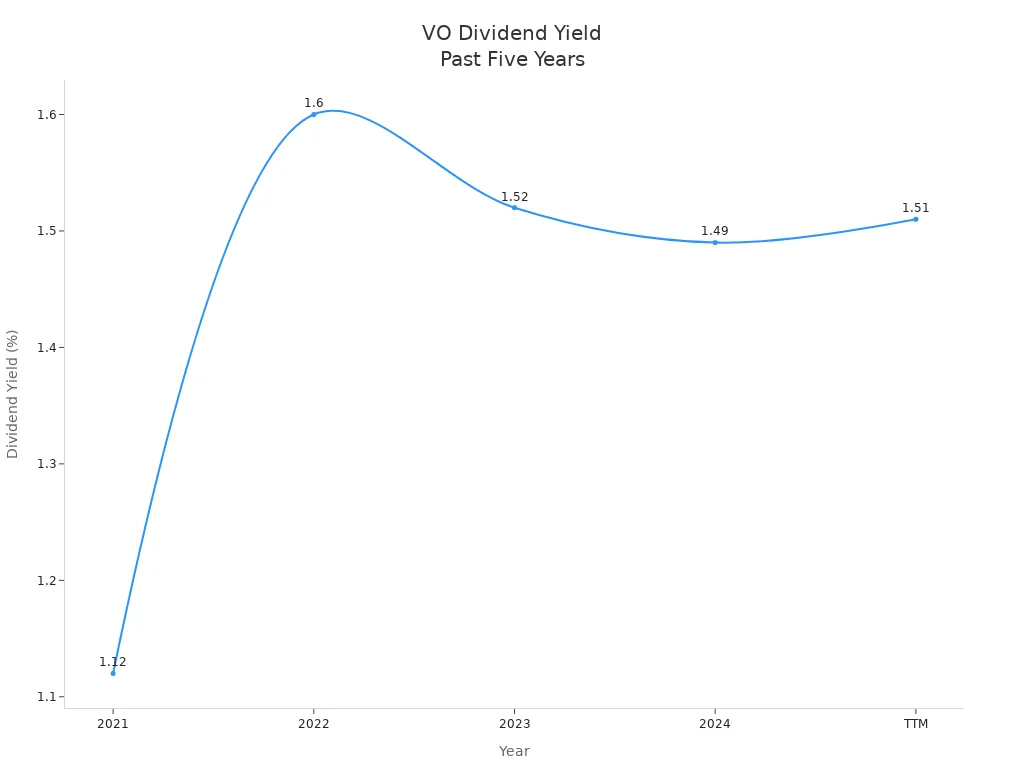
The ETF increased its dividend for three consecutive years, with a one-year dividend growth rate of 11.5%. This reliability appeals to investors who want regular income. Compared to other mid-cap ETFs, VO offers a competitive yield and a lower expense ratio, making it attractive for those seeking both growth and income.
Sectors & Holdings
Sector Allocation
The Vanguard Mid-Cap ETF (VO) provides investors with exposure to a broad range of sectors. This diversity helps reduce risk and supports steady growth. VO spreads its investments across technology, industrials, consumer discretionary, health care, and financials. Technology and industrials make up the largest portions of the portfolio. Consumer discretionary and health care also play significant roles. This balanced sector allocation allows VO to capture growth from different parts of the market.
A well-diversified sector mix can help cushion the impact of downturns in any single industry. Investors benefit from the stability that comes with spreading risk across multiple sectors.
Top Holdings
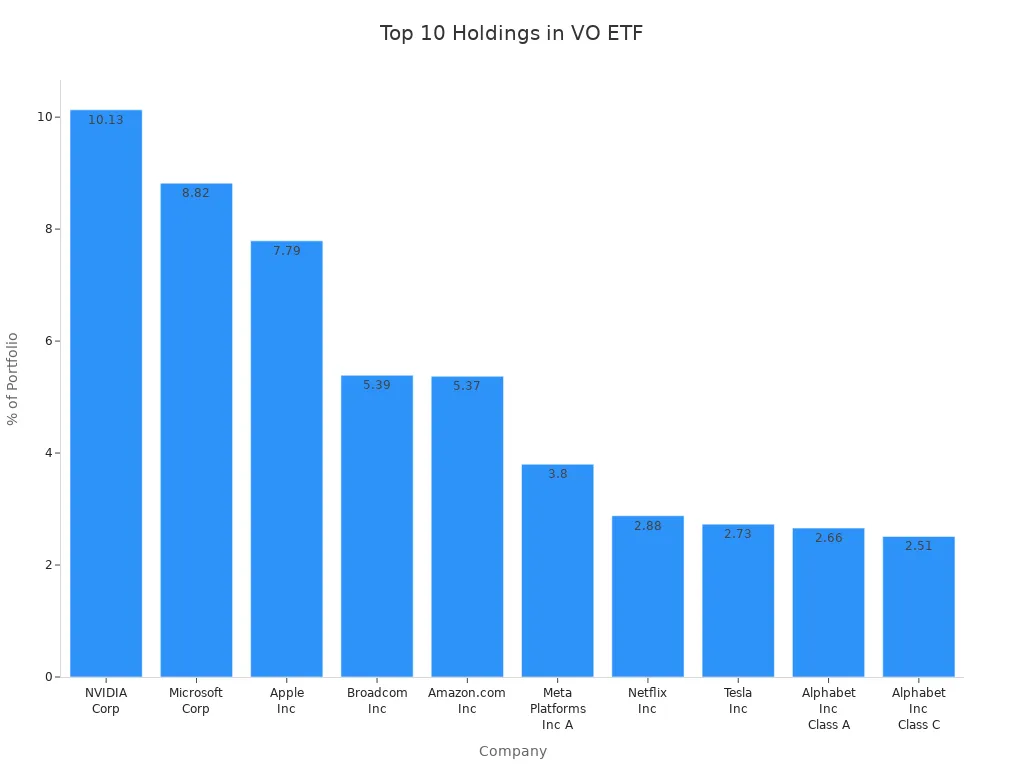
VO holds shares in over 300 companies, but the top ten holdings account for more than half of the portfolio’s total value. These companies represent leaders in their industries and drive much of the fund’s performance. The table below lists the top ten holdings and their respective weights in the portfolio:
| Holding Symbol | Company Name | % of Portfolio |
|---|---|---|
| NVDA | NVIDIA Corp | 10.13% |
| MSFT | Microsoft Corp | 8.82% |
| AAPL | Apple Inc | 7.79% |
| AVGO | Broadcom Inc | 5.39% |
| AMZN | Amazon.com Inc | 5.37% |
| META | Meta Platforms Inc A | 3.80% |
| NFLX | Netflix Inc | 2.88% |
| TSLA | Tesla Inc | 2.73% |
| GOOGL | Alphabet Inc Class A | 2.66% |
| GOOG | Alphabet Inc Class C | 2.51% |
These top ten companies together make up 52.08% of the total portfolio. This concentration means that the performance of these firms can have a large impact on the ETF’s results. Investors should note that many of these companies also pay a regular dividend, which adds to the fund’s total return.
VO’s focus on industry leaders, combined with a strong sector mix, supports both growth and income objectives. The fund’s dividend history and stable yield make it appealing for investors who want a blend of capital appreciation and regular income.
Alternatives
Other Mid-Cap ETFs
Investors seeking options beyond the Vanguard Mid-Cap ETF can consider several popular mid-cap funds. Each fund offers unique features, costs, and investment strategies. The most notable alternatives include:
- State Street Small/Mid Cap Equity Index Fund (SSMKX): This fund tracks a blend of small and mid-cap stocks. It has a slightly higher expense ratio than VO and lower long-term returns.
- Vanguard Mid-Cap Index Fund (VIMAX): VIMAX closely mirrors VO but operates as a mutual fund. It requires a higher minimum investment and charges a marginally higher expense ratio.
- BNY Mellon MidCap Index Fund Investor Shares (PESPX): PESPX has a 0.50% expense ratio and a $2,500 minimum investment. Its five-year average return stands at 9.74%.
- Fidelity Mid Cap Index Fund (FSMDX): FSMDX offers a very low expense ratio of 0.025% and no minimum investment. Its five-year average return is 9.46%.
- Columbia Mid Cap Index Fund Class A (NTIAX): NTIAX charges a 0.45% expense ratio and requires a $2,000 minimum investment. Its five-year average return is 9.77%.
Note: Mutual funds like VIMAX, PESPX, FSMDX, and NTIAX may have different liquidity and trading flexibility compared to ETFs such as VO and SSMKX.
The following table compares VO and SSMKX across key metrics:
| Metric | VO (Vanguard Mid-Cap ETF) | SSMKX (State Street Small/Mid Cap Equity Index Fund) |
|---|---|---|
| Expense Ratio | 0.04% | 0.05% |
| Year-to-Date Return | 9.11% | 7.05% |
| 10-Year Annualized Return | 10.05% | 6.99% |
| Sharpe Ratio | 1.09 | 0.92 |
| Sortino Ratio | 1.57 | 1.37 |
| Calmar Ratio | 1.00 | 0.61 |
| Martin Ratio | 3.62 | 2.44 |
| Ulcer Index | 5.24% | 8.62% |
| Daily Standard Deviation (Volatility) | 17.88% | 23.69% |
| Max Drawdown | -58.88% | -45.04% |
| Current Drawdown | -1.37% | -12.45% |
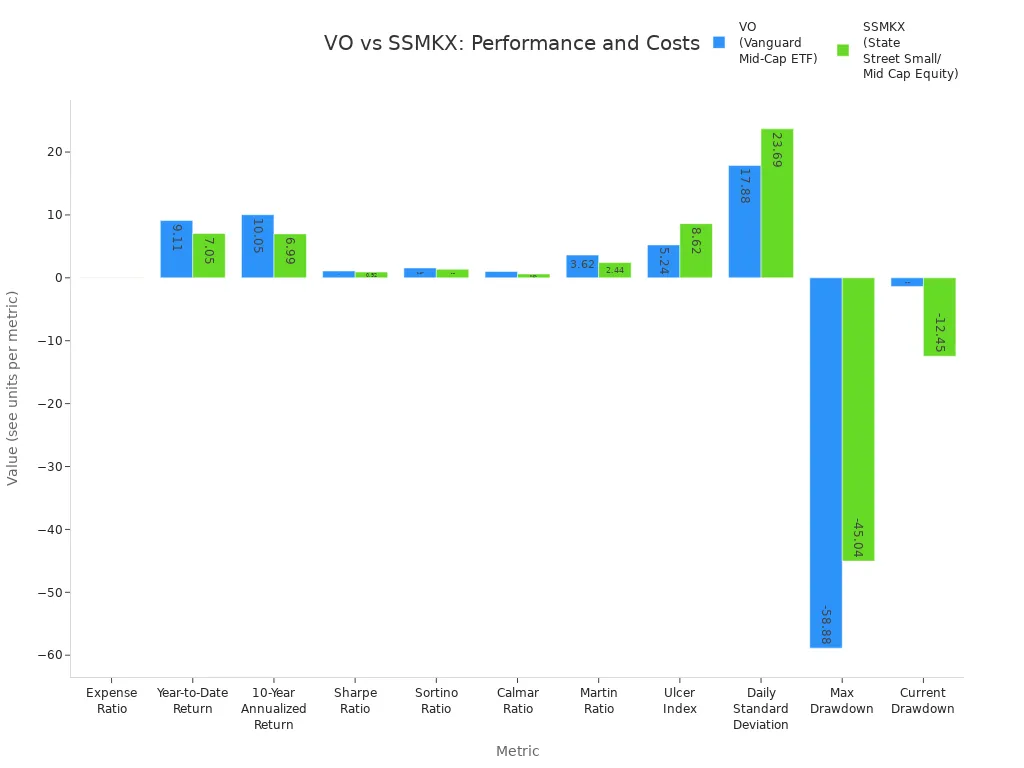
Analysis shows that VO consistently outperforms SSMKX in returns and risk-adjusted metrics. VO also maintains lower volatility and a slightly lower expense ratio.
Key Differences
The main differences among mid-cap ETFs stem from their investment strategies, index methodologies, and sector exposures. VO tracks the CRSP US Mid Cap Index, while other leading ETFs, such as iShares Core S&P Mid-Cap ETF (IJH), follow the S&P MidCap 400 Index. This distinction affects the number of holdings and sector composition.
| Feature | Vanguard Mid-Cap ETF (VO) | iShares Core S&P Mid-Cap ETF (IJH) |
|---|---|---|
| Index Tracked | CRSP US Mid Cap Index | S&P MidCap 400 Index |
| Expense Ratio | 0.04% | 0.05% |
| Number of Holdings | 301 | 402 |
| Assets Under Management (AUM) | $85.3 billion | $95.8 billion |
| ETF Category | Mid Cap Growth Equities | Mid Cap Growth Equities |
Analysis highlights that VO holds fewer stocks than IJH due to differences in index construction. VO offers a minor cost advantage with its lower expense ratio. Both ETFs target mid-cap U.S. equities, but their sector allocations may vary based on index methodology.
Investors should review each fund’s strategy and sector exposure before making a decision. Trading flexibility, cost structure, and historical analysis of returns play important roles in selecting the best mid-cap ETF for a portfolio.
Who Should Buy VO Stock
Investor Profile
Investors who seek steady growth and moderate risk often find VO stock a suitable choice. The fund appeals to those with a long-term investment horizon who prefer to buy and hold rather than trade frequently. Individuals who want exposure to mid-cap U.S. companies across multiple sectors benefit from the ETF’s broad diversification. Many investors look for greater growth potential than large-cap stocks can offer, but they want less volatility than small-cap stocks present. VO stock fits this need well.
- Long-term investors who value patience and discipline
- Individuals seeking balanced growth with moderate risk
- Those who want instant diversification across sectors
- Cost-conscious investors attracted by low expense ratios
- Investors who prefer steady, moderate growth over chasing high returns
The ETF also attracts investors who appreciate a reliable dividend stream. VO stock’s consistent quarterly payments add stability to portfolios, especially for those who want income alongside growth.
VO stock serves investors who prioritize a blend of growth, diversification, and cost efficiency. It does not suit those who expect to outperform the market or seek aggressive returns.
Portfolio Fit
VO stock fits well in portfolios that need mid-cap exposure. Many investors use it to complement large-cap and small-cap holdings, creating a balanced allocation. The ETF’s moderate risk profile makes it a strong core holding for retirement accounts, taxable brokerage accounts, and education savings plans. Investors who want to reduce concentration in large technology stocks often add VO stock for sector balance.
| Portfolio Type | VO Stock Role |
|---|---|
| Growth-focused | Diversifies risk, adds stability |
| Income-focused | Provides steady dividend payments |
| Balanced allocation | Bridges gap between large and small caps |
| Retirement accounts | Offers long-term growth and moderate risk |
VO stock’s low expense ratio and consistent dividend yield make it attractive for investors who want to maximize returns and minimize costs. The ETF’s broad sector exposure helps portfolios weather market shifts and economic cycles.
VO stock offers broad exposure, low costs, and strong dividend yield, making it a solid choice for many investors. Recent analyst reports highlight strengths such as diversification and transparency, but warn about possible overvaluation and outdated price targets.
| Strengths | Weaknesses |
|---|---|
| Broad exposure | Valuation uncertainty |
| Low expense ratio | Need for further research |
| Dividend yield | |
| Diversification | |
| Transparency |
Mid-cap stocks show attractive valuations and momentum, but inflation and market trends create risks. Investors should review current analyst targets and consider consulting a financial advisor before making decisions.
FAQ
What is the minimum investment for VO stock?
Investors can buy as little as one share of VO stock. The price of one share changes daily based on market activity. No minimum investment applies beyond the cost of a single share plus any brokerage fees.
How often does VO pay dividends?
VO pays dividends quarterly. Shareholders receive payments four times each year. The fund distributes dividends based on the income earned from its underlying holdings.
Can investors buy VO stock through Hong Kong banks?
Many Hong Kong banks offer access to U.S. stock markets. Investors can purchase VO stock through international brokerage accounts provided by these banks. Fees and account requirements may vary by institution.
Is VO stock suitable for short-term trading?
VO stock works best for long-term investors. The ETF aims to track mid-cap performance over time. Short-term traders may not benefit from its steady growth and dividend focus.
Where can investors find the latest VO stock price in USD?
Investors can view the current VO stock price in USD on financial news websites or brokerage platforms. For up-to-date exchange rates, visit XE.com.
VO stock’s blend of moderate growth, diversification, and a rock-bottom expense ratio makes it a compelling choice for long-term investors. However, a great investment requires a great platform to access it. For a global investor, navigating currency conversions and international banking can complicate the process, potentially adding costs that undermine VO’s key benefit. This is where BiyaPay provides the perfect solution. Our unified global financial account simplifies the process of buying US-listed ETFs and stocks, including VO. With our platform, you can seamlessly convert funds and invest in the US market without the friction of traditional international wire transfers. Our low fees and real-time exchange rate converter ensure that your investment journey remains as cost-efficient and transparent as the ETF itself. Don’t let cross-border logistics hold you back from building a balanced portfolio. Register today to get started.
*This article is provided for general information purposes and does not constitute legal, tax or other professional advice from BiyaPay or its subsidiaries and its affiliates, and it is not intended as a substitute for obtaining advice from a financial advisor or any other professional.
We make no representations, warranties or warranties, express or implied, as to the accuracy, completeness or timeliness of the contents of this publication.
Related Blogs of

Annual Review: Best Performing US Stock ETFs in 2026 and the Logic Behind Them


Master US Stock Trading Hours in One Article: Never Miss Pre-Market and After-Hours Opportunities


Essential Apps for Getting Started with US Stock Futures: These Apps Will Turn You into a Pro

How to Choose US Major Indices: Pros and Cons Analysis of S&P 500, Dow Jones, and Nasdaq

Choose Country or Region to Read Local Blog

Contact Us


BIYA GLOBAL LLC is a licensed entity registered with the U.S. Securities and Exchange Commission (SEC No.: 802-127417); a certified member of the Financial Industry Regulatory Authority (FINRA) (Central Registration Depository CRD No.: 325027); regulated by the Financial Industry Regulatory Authority (FINRA) and the U.S. Securities and Exchange Commission (SEC).
BIYA GLOBAL LLC is registered with the Financial Crimes Enforcement Network (FinCEN), an agency under the U.S. Department of the Treasury, as a Money Services Business (MSB), with registration number 31000218637349, and regulated by the Financial Crimes Enforcement Network (FinCEN).
BIYA GLOBAL LIMITED is a registered Financial Service Provider (FSP) in New Zealand, with registration number FSP1007221, and is also a registered member of the Financial Services Complaints Limited (FSCL), an independent dispute resolution scheme in New Zealand.