What Sectors Led the Decline in the Stock Market Today


Image Source: pexels
Technology, Energy, Financials, Consumer Discretionary, and Industrials led the downturn in the stock market today. These sectors faced sharp declines as investors reacted to valuation concerns, rising interest rates, and falling oil prices. Recent studies show that uncertainty in interest rates often causes oil prices to drop, which can signal a potential recession. This trend affects equity markets and increases volatility across stocks. Many investors continue to ask, why did the stock market fall today? The answer lies in the pressure on these sectors and the broader weakness in stocks.
Key Takeaways
- Technology, energy, financials, consumer discretionary, and industrials led the stock market decline due to high valuations, falling oil prices, rising interest rates, weak consumer spending, and supply chain problems.
- Falling oil prices signal weaker demand and hurt energy stocks, while rising interest rates increase borrowing costs and create uncertainty for technology and financial companies.
- Consumer confidence and spending dropped sharply, causing declines in retail and discretionary sectors as people focus more on essentials and saving.
- Supply chain disruptions and rising costs pressured industrial stocks, reducing profits and causing delays in production and deliveries.
- Investors should stay calm during market volatility, diversify their portfolios, and focus on long-term goals to manage risks and benefit from future recoveries.
Top Sectors Hit

Image Source: unsplash
Technology
Technology stocks experienced one of the sharpest declines today. Investors grew concerned about high valuations and the impact of rising interest rates on future earnings. Many technology companies rely on borrowing to fund growth, so higher rates can reduce profits and slow expansion. The sector also faced pressure from global competition and regulatory uncertainty. Technology stocks often lead equity markets, so their drop weighed heavily on overall market performance.
Energy
Energy stocks fell sharply as oil prices dropped. The sector remains sensitive to changes in global demand and supply disruptions. Recent history shows that major economic shocks can cause dramatic oil price declines, which in turn hurt energy companies.
- The 2008 financial crisis led to a 5.4% immediate drop in oil prices and a 70% plunge over time, causing prolonged stress for energy stocks.
- During the COVID-19 pandemic, oil prices fell by 13.6% initially and over 71% in total, driven by demand shocks and production disputes.
- These events show that sharp oil price declines often result in significant downturns for the energy sector, with effects lasting several years.
Today’s drop in oil prices signaled weaker demand and raised fears of a slowdown, pushing energy stocks lower.
Financials
Financial stocks declined as interest rate volatility increased. Banks and other financial firms depend on stable rates to manage lending and investment activities. Rising rates can boost profits from lending, but sudden changes create uncertainty and can reduce loan demand. Investors also worried about potential loan defaults if economic conditions worsen. Financial stocks often reflect the health of equity markets, so their decline added to the negative sentiment.
Consumer Discretionary
Consumer discretionary stocks dropped as investors reacted to weak consumer sentiment and slowing retail sales.
Consumer confidence reached its second-lowest level in history in May 2025, falling 26.5% year-over-year. Inflation and tariff concerns reduced purchasing power, leading to cautious spending. Retail sales growth slowed to just 0.1% in April after a stronger March. Stocks in this sector fell about 5% in 2025, a sharp contrast to previous years.
Deloitte’s surveys show that consumers expect higher prices, especially for groceries, and plan to spend less on discretionary items. Many people now focus on saving and essential purchases. Even though leisure travel remains strong, most discretionary categories are weakening.
ConsumerSignals data confirms that cost-saving behaviors are widespread, with mixed signals for vehicle purchases and continued caution in other areas. These trends explain the sector’s underperformance.
Industrials
Industrials stocks suffered from ongoing supply chain disruptions and rising costs.
- Supply chain failures ranked as the second biggest risk in 2023, driven by chip shortages, trade disputes, and logistics delays.
- These issues increased operational costs, delayed production, and disrupted deliveries, hurting profit margins and cash flow.
- Inflation in raw materials and wages squeezed liquidity, while labor shortages made it hard to meet production targets.
- Commodity price risks and capital constraints added to the pressure.
- Thirty-one percent of companies reported losses from these risks in the past year, and 58% have plans to address them.
- Global supply chain pressures led to higher transport costs, reduced output, and delayed projects, causing revenue losses and stock price volatility.
These challenges weakened investor confidence and led to underperformance in the sector.
Healthcare
Healthcare stocks showed mixed performance today. Some companies displayed resilience due to strong leadership, workforce well-being, and adaptive strategies.
- Research highlights the importance of leadership, coordination, and resource management for resilience.
- Digital technologies and cooperation between organizations are becoming more important.
- Rising medical costs, increased use of new drugs, and higher demand for inpatient care are driving up expenses.
- Healthcare organizations face pressure to adapt financial and workforce models to manage these costs.
- Trends such as price transparency, AI adoption, and regulatory changes are shaping the sector.
Despite these challenges, the sector’s focus on resilience and innovation helped limit losses compared to other sectors.
Note: The sectors that led the decline today—technology, energy, financials, consumer discretionary, and industrials—had the greatest impact on stocks and equity markets. Healthcare showed more stability, but rising costs and regulatory changes remain key issues to watch.
Stock Market vs. Sectors
Image Source: pexels
Indices Comparison
Major indices in the stock market today showed clear differences in performance. The S&P 500 index, which tracks the largest companies, often moves differently from its individual sectors. Annual returns for S&P 500 sectors can vary widely. For example, Information Technology and Consumer Discretionary sometimes post strong gains, while other sectors show weaker or even negative returns. This variation highlights how the overall stock market does not always reflect the performance of every group of stocks.
A closer look at index construction reveals more about these trends. The capital-weighted S&P 500 index gives more influence to the largest companies. In recent years, these top stocks have driven much of the index’s gains. However, the equally weighted S&P 500 index, which treats every company the same, sometimes outperforms the main index. This means that while a few large stocks can lift the market, many other stocks may lag behind. The NASDAQ 100 index, with its heavy focus on technology, often shows even greater swings, especially when tech stocks lead or lag.
Sector vs. Market Trends
Sector performance often moves independently from the broader equity markets. Different sectors experience earnings growth and downturns at different times. Analysts call this pattern “rolling recessions.” For instance, the technology sector faced an earnings decline in 2022 but recovered in 2023, while other sectors struggled. This asynchronous movement means that some stocks can rise even when the overall stock market falls.
Investors should note that equity markets can show strength or weakness based on a handful of sectors. When one sector outperforms, it can mask problems in others. At the same time, sector-specific risks—such as supply chain issues or changes in consumer demand—can cause sharp declines even if the broader stock market appears stable. Understanding these trends helps investors make better decisions about where to allocate funds within equity markets.
Why Did the Stock Market Fall Today?
Understanding why did the stock market fall today requires a close look at several economic and financial factors. Each of these factors played a role in driving sector declines and shaping investor sentiment.
Economic Data
Recent economic data revealed mixed signals that contributed to market uncertainty. Investors saw a sharp drawdown in the S&P 500 during the first quarter of 2025, with a 10% decline from February highs. This correction happened even as some earnings continued to grow. The price-to-earnings ratio remained more than one standard deviation above its long-term average, signaling that valuations were stretched and vulnerable to correction.
A table below summarizes the key economic indicators influencing why did the stock market fall today:
| Indicator | Numerical Trend / Data Point | Explanation / Impact on Market Decline |
|---|---|---|
| S&P 500 Drawdown Q1 2025 | 10% decline from February highs | Indicates significant market correction despite earnings growth |
| Price-to-Earnings Ratio (P/E) | Over 1 standard deviation above long-term average | Elevated valuations increase risk of market correction |
| Consumer Spending Q4 2024 | Rose 4.2% | Strong prior growth, but followed by sharp slowdown |
| Consumer Confidence | Fell to multi-year lows | Weakens consumer sentiment, reducing spending |
| Imports Spike | Large increase due to tariff front-running | Potential drag on GDP growth via net exports |
| Inflation (CPI) Feb 2025 | 2.8% year-over-year, up from 2.4% in September 2024 | Inflation accelerating, tariffs may push prices higher |
| Unemployment Rate Feb 2025 | Around 4.2%, slightly above cycle low of 3.4% in April 2023 | Labor market slowing but still tight, supporting some spending |
| Wage Growth Feb 2025 | 4.1% year-over-year for private production workers | Wage gains outpace inflation, partially supporting consumption |
| Retail Sales May 2025 | Fell 0.9%, below expected 0.7% decline | Indicates weakening consumer spending in key sectors |
| Oil Prices May 2025 | Increased roughly 4% due to Middle East tensions | Geopolitical risk adds to market volatility |
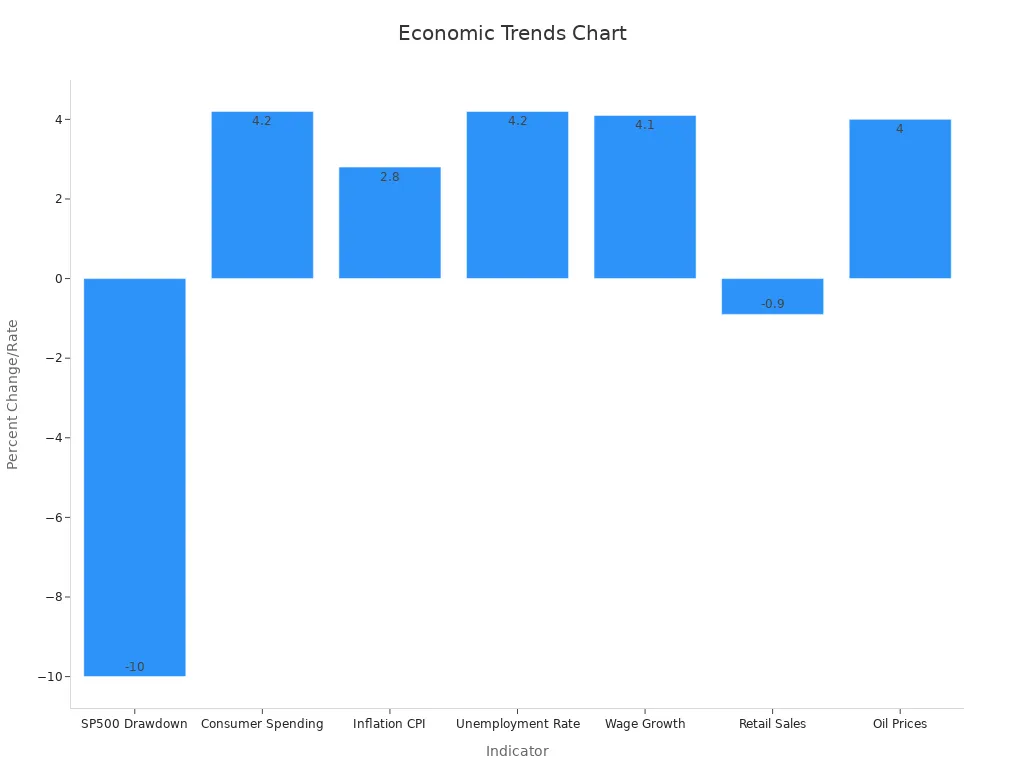
These trends affected multiple sectors. Technology and consumer discretionary stocks felt the impact of weaker consumer confidence and slowing retail sales. Industrials and energy companies faced pressure from rising costs and volatile demand. Financials responded to the uncertainty in economic growth and inflation.
Earnings and Valuations
Earnings reports and valuation metrics played a major role in why did the stock market fall today. Investors closely watched earnings per share (EPS), revenue, and net income. When companies missed analyst expectations, stocks often dropped sharply. Even when earnings met forecasts, high price-to-earnings (P/E) and price-to-sales (P/S) ratios made stocks vulnerable to declines.
- Earnings per share (EPS) is a primary metric driving market reactions, often compared against analyst expectations.
- Revenue, net income, and forward guidance are also critical components influencing investor behavior.
- Valuation statistics such as price-to-earnings (P/E) and price-to-sales (P/S) ratios are important for assessing company value and market response.
- Investors may focus on different metrics depending on the company’s life cycle and industry context.
- Market reactions are linked to how actual earnings and valuation metrics compare to expectations, affecting stock price movements.
Technology and consumer discretionary sectors, which often trade at higher valuations, saw the largest drops when earnings disappointed. Financials and industrials also suffered as investors questioned whether current valuations could be justified in a slowing economy.
Oil Prices and Energy
Oil price fluctuations had a direct effect on why did the stock market fall today. The average correlation between stock prices and oil demand stands at about 0.48, while the correlation with overall oil price is about 0.39. When oil prices dropped due to lower demand or increased volatility, energy stocks declined sharply. Regression analysis shows that higher volatility, measured by the VIX, often leads to falling oil prices, which then drag down related stocks.
Dynamic models reveal that the appreciation of the US dollar increases volatility and decreases prices of both oil and related stocks. These effects become more pronounced during economic downturns. Technology and clean energy firms also experience increased volatility when oil prices fall, especially when linked to reduced aggregate demand.
Energy, industrials, and technology sectors all felt the impact of oil price swings. Lower oil prices signaled weaker global demand, which hurt earnings and investor confidence in these sectors.
Interest Rates
Interest rate trends shaped why did the stock market fall today. Mortgage rates rose from historic lows of 2.65% in January 2021 to a peak of 7.79% in October 2023, before easing to about 6.2% by September 2024. This increase made borrowing more expensive and reduced housing affordability. Higher rates also created a “lock-in effect,” where homeowners with low-rate mortgages hesitated to sell, limiting housing supply.
The 10-Year Treasury Bond rate, averaging 5.84% over the past 60 years, remains below its long-term average. However, the potential for future increases keeps investors cautious. Higher rates raise borrowing costs for companies, especially in technology and consumer discretionary sectors, which rely on debt to fund growth. Financials, such as banks, face uncertainty as loan demand drops and defaults may rise.
Restrictive Federal Reserve policies and economic uncertainty continue to act as headwinds for borrowing and investment. These trends directly affect stocks across multiple sectors.
Consumer Spending
Consumer spending and confidence indexes provided clear signals for why did the stock market fall today. Research shows that market uncertainty often comes from consumers’ lack of confidence in their ability to predict the market, not just pessimism about the economy. When consumers feel uncertain, they spend less, which weakens demand for goods and services.
| Consumer Confidence Measure | Date | Value | Change/Trend | Notes |
|---|---|---|---|---|
| University of Michigan Consumer Sentiment Index | March 2025 | 57.0 | Fell from 64.7 in February 2025 | Third consecutive monthly decline; nearly 30% drop over past 12 months |
| University of Michigan Consumer Sentiment Index | April 2025 | 50.8 | Further decline | Lowest point reflecting growing economic uncertainty |
| Conference Board Consumer Confidence Index (CCI) | March 2025 | 92.9 | Declined by 7.2 points | Based on a large online survey; indicates reduced consumer confidence |
| Conference Board Expectations Index | March 2025 | 65.2 | Dropped 9.6 points | Lowest level in 12 years; reflects consumers’ short-term outlook on income and labor |
| Demographic Insights | March 2025 | N/A | Older consumers (55+) drove decline | Younger consumers (<35) showed slight confidence increase; high-income households less confident |
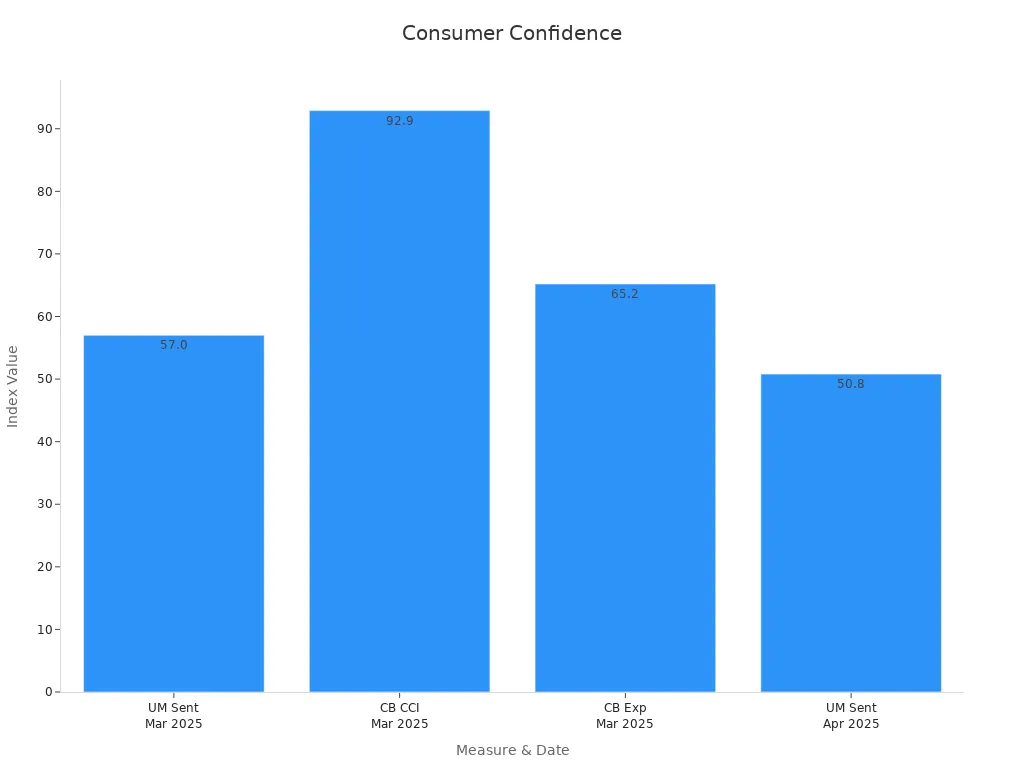
Consumer discretionary and technology stocks felt the most pressure from these trends. Retail sales fell 0.9% in May 2025, below the expected 0.7% decline, showing that consumers pulled back on spending. Weak confidence and lower spending led to declines in stocks tied to retail, travel, and entertainment.
Investors continue to ask, why did the stock market fall today? The answer lies in the combination of weak economic data, disappointing earnings, volatile oil prices, rising interest rates, and declining consumer confidence. Each of these factors contributed to sector declines and increased uncertainty in the stock market today.
Investor Implications
Short-Term Moves
Investors often react quickly to sharp market declines. These reactions can create opportunities and risks in the short term.
- Extreme market events use a moving-window Value-at-Risk approach, which highlights surprises based on current conditions.
- Stocks tend to overreact after both positive and negative extreme moves. The overreaction is stronger after negative events.
- Loser stocks show stronger reversals, even though they have lower market beta than winners.
- A contrarian trading strategy after negative extreme events can yield an abnormal return of 4.17% over the post-event window. This equals an annualized return of 50.04%.
- Overlapping extreme events, especially those with opposite signals, still show significant overreaction. The Carhart 4-factor daily alpha reaches 0.19%, or 47.88% annualized.
These statistics show that market volatility and clusters of extreme events influence investor behavior. Investors who act too quickly may miss out on reversals. A disciplined approach, such as waiting for the market to stabilize, can help manage risk.
Note: Short-term volatility often leads to emotional decisions. Investors should focus on their long-term goals and avoid panic selling during sharp declines.
Long-Term Outlook
Long-term investors benefit from understanding historical trends and future forecasts. The S&P 500 has averaged about 10% annual returns over the long term, despite periods of high volatility. Experts now project more conservative returns for the next decade.
| Asset Class | 10-Year Annualized Nominal Return Forecast |
|---|---|
| U.S. Large-Cap Stocks | 6.0% |
| U.S. Small-Cap Stocks | 6.3% |
| International Large Caps | 7.1% |
| Investment-Grade Bonds | ~5.7% |
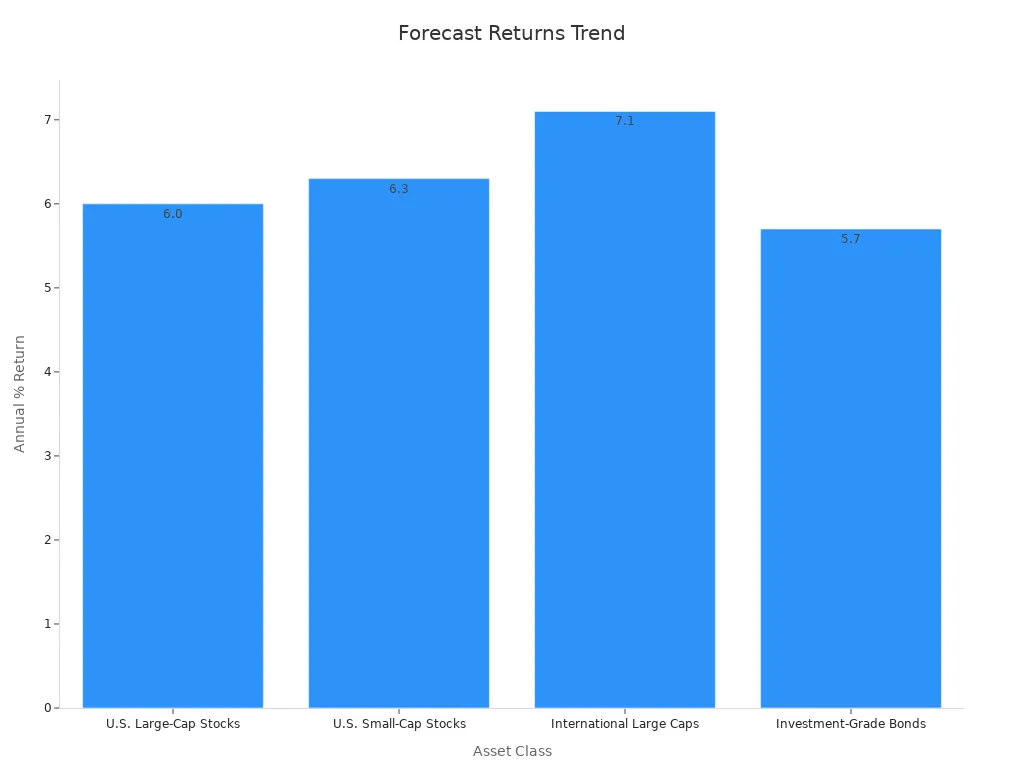
Forecasts suggest U.S. equities may return between 4-7% over the next 10-15 years. International stocks could outperform U.S. stocks. Economic growth, interest rates, corporate earnings, and geopolitical events will shape these outcomes. Diversification and a long-term investment horizon remain key strategies for managing risk and capturing growth. Past performance does not guarantee future results, but history supports the expectation of positive returns over time.
- Technology, Energy, Financials, Consumer Discretionary, and Industrials led today’s market decline.
- Main drivers included high valuations, falling oil prices, rising interest rates, weak consumer spending, and supply chain issues.
Investors should monitor sector trends and economic signals. A diversified approach can help manage risk. Market volatility may continue, but some sectors could recover as conditions improve.
FAQ
What caused the biggest sector declines in the stock market today?
Valuation concerns, rising interest rates, falling oil prices, and weak consumer spending drove the largest sector declines. Technology, energy, financials, consumer discretionary, and industrials faced the most pressure from these factors.
How do interest rates affect technology and financial stocks?
Higher interest rates increase borrowing costs for technology companies and reduce profit margins. Financial stocks, such as those from Hong Kong banks, may benefit from higher rates but face risks if loan demand drops or defaults rise.
Why did energy stocks fall when oil prices dropped?
Energy stocks depend on stable or rising oil prices for profitability. When oil prices fall, company revenues decrease. This trend signals weaker global demand and often leads to lower stock prices in the energy sector.
Should investors avoid all declining sectors?
Investors should not avoid entire sectors based on short-term declines. Diversification helps manage risk. Some sectors may recover as economic conditions improve. Long-term strategies often outperform reactive decisions.
How can investors protect their portfolios during sector downturns?
Investors can diversify across sectors, monitor economic indicators, and review asset allocations. Using stop-loss orders or hedging strategies may help limit losses. Professional advice can provide guidance during volatile periods.
Today’s stock market decline, led by technology, energy, and consumer discretionary sectors, underscores the need for diversification to manage volatility. BiyaPay lets you trade US/HK stocks and cryptocurrencies through a single account, surpassing traditional brokers by enabling seamless diversification. Convert USDT to USD or HKD at real-time rates to minimize exchange costs for global trading.
Backed by FinCEN, FINTRAC MSB licenses, and SEC RIA registration, BiyaPay ensures secure trades with fast deposits to brokers like Charles Schwab. Sign up in minutes to build a flexible portfolio, whether you’re a beginner or active trader. Join BiyaPay now to navigate market swings! Trade with BiyaPay today to seize opportunities in volatile markets!
*This article is provided for general information purposes and does not constitute legal, tax or other professional advice from BiyaPay or its subsidiaries and its affiliates, and it is not intended as a substitute for obtaining advice from a financial advisor or any other professional.
We make no representations, warranties or warranties, express or implied, as to the accuracy, completeness or timeliness of the contents of this publication.
Related Blogs of

Midjourney/Suno & Other AI Tools Aggregated Subscription Management: Handle It All with One Virtual Card


How to Convert Tokens Earned from Playing Web3 Football Games into Alipay Balance with Minimal Loss?


The Wisdom of Capital Sedimentation: After Winning U, Don’t Rush to Convert to RMB – Earn High USD Interest in a Multi-Asset Wallet


How AI Startups Can Quickly Open Overseas Corporate Accounts to Receive USD Funding?

Choose Country or Region to Read Local Blog

Contact Us


BIYA GLOBAL LLC is registered with the Financial Crimes Enforcement Network (FinCEN), an agency under the U.S. Department of the Treasury, as a Money Services Business (MSB), with registration number 31000218637349, and regulated by the Financial Crimes Enforcement Network (FinCEN).
BIYA GLOBAL LIMITED is a registered Financial Service Provider (FSP) in New Zealand, with registration number FSP1007221, and is also a registered member of the Financial Services Complaints Limited (FSCL), an independent dispute resolution scheme in New Zealand.