What History Tells Us About the Accuracy of Five-Year Market Predictions


Image Source: pexels
Many investors believe experts can reliably predict the stock market, but history tells a different story. Studies show that most five-year forecasts miss the mark. The CXO Advisory Group tracked 6,584 predictions from 68 experts and found the average accuracy hovered just under 47%.
| Source / Expert Group | Number of Forecasts | Number of Experts | Average Accuracy (%) | Accuracy Distribution Highlights |
|---|---|---|---|---|
| CXO Advisory Group (2005-2012) | 6,584 | 68 | Just under 47 | Bell curve distribution; only 5 experts >60%, 12 <40% accuracy |
| S&P 500 Forecast Study (Bailey et al.) | N/A | N/A | 48 | 66% of forecasters <50% accuracy; most clustered between 40%-50% |
Despite sophisticated models, even the most respected names in stock market prediction for next 5 years rarely exceed random chance. These numbers raise a critical question: can anyone really trust five-year forecasts?
Key Takeaways
- Most five-year stock market predictions are less accurate than random guesses, with experts averaging below 50% accuracy.
- Unpredictable events and market complexity make long-term forecasts unreliable, even with advanced technology and models.
- Diversifying investments across different asset types helps reduce risk and smooth out losses during market downturns.
- Investors should stay skeptical of confident forecasts and avoid making big decisions based on uncertain predictions.
- Building flexible, resilient strategies focused on risk management and long-term goals leads to better investment success.
Track Record

Image Source: pexels
Successes and Misses
Financial history shows that even the most respected experts and institutions struggle to predict the stock market over five years. Many well-known failures stand out. For example, New York Fed economists did not foresee the Great Recession. They missed signs of the housing bubble and underestimated the risks from new mortgage finance products. Their models assumed markets would stay efficient, which led to blind spots. They also failed to see how problems in the financial system could quickly spread to the real economy.
Some experts, however, have made accurate calls. Nouriel Roubini warned about the financial crisis before it happened. His predictions were more cautious than most private forecasters. In recent years, machine learning models have shown promise. These models, such as support vector machines, can spot patterns that traditional models miss. They have predicted stock market crashes more accurately than older methods. This progress helps investors and policymakers act faster to prevent bigger problems.
Success stories also appear in other industries. Companies like Amazon and Walmart use advanced models to forecast demand and manage inventory. Renaissance Technologies, a hedge fund, uses mathematical models to predict market movements. Their Medallion Fund has delivered strong returns by finding patterns in historical data. These examples show that while many predictions fail, some approaches can work well, especially when they use new technology and large data sets.
| Company/Entity | Industry | Forecasting Approach | Outcome/Success Highlight |
|---|---|---|---|
| Amazon | E-commerce | Combines historical sales data and customer behavior patterns with advanced models | Achieves up to 95% accuracy in demand forecasting, ensuring timely restocking |
| Renaissance Technologies | Financial Markets | Employs sophisticated mathematical and machine learning models on historical data | Medallion Fund achieves exceptional returns through accurate market movement predictions |
| Walmart | Retail | Analyzes historical sales data, seasonality, and external factors with machine learning | Optimizes inventory management and replenishment decisions across thousands of stores |
| New York Fed | Financial Markets | Relied on traditional economic models | Failed to predict the Great Recession due to missed signals and flawed assumptions |
Accuracy Data
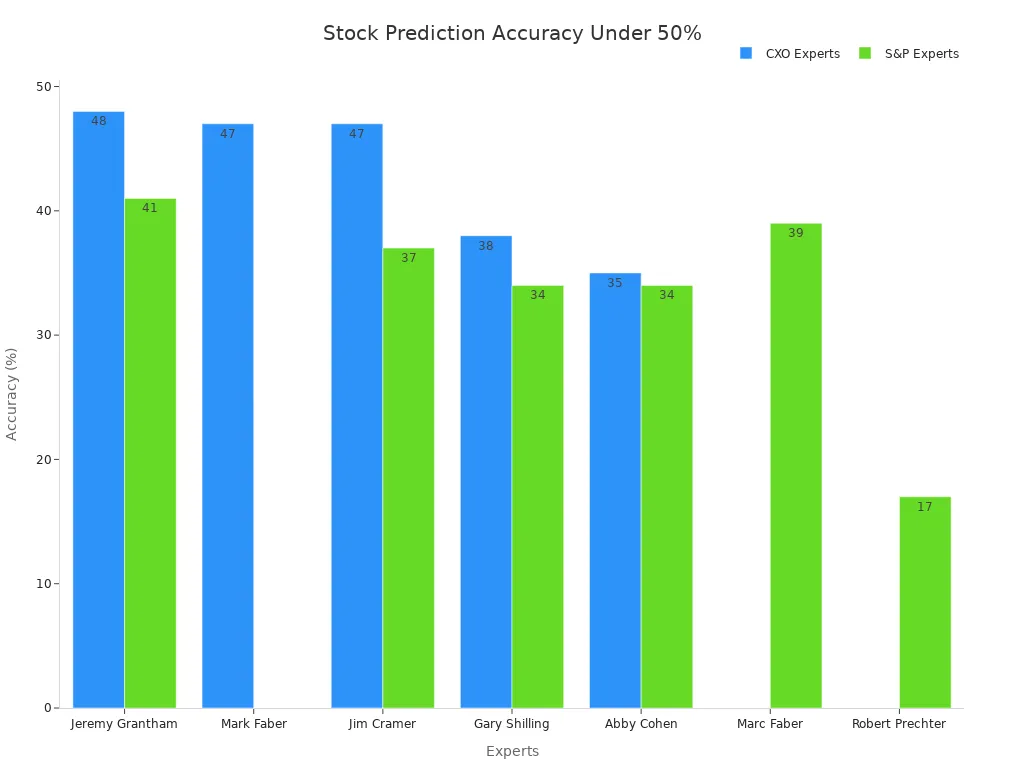
Most studies show that expert forecasts for the stock market perform worse than random guessing. The average accuracy rate for expert predictions sits at 47%. This means that flipping a coin would often give better results. Some well-known experts, like Jim Cramer, have accuracy rates below 47%. Abbey Joseph Cohen, another famous forecaster, has an even lower rate of 35%. A study of 6,627 forecasts by 68 forecasters found an average accuracy of 48%. These numbers highlight the challenge of making reliable predictions.
| Source / Expert | Number of Forecasts | Accuracy Rate (%) | Interpretation |
|---|---|---|---|
| Overall accuracy (study 1) | N/A | 47 | Below random chance (50%) |
| Jim Cramer | 62 | 46.8 | Below random chance |
| Abbey Joseph Cohen | N/A | 35 | Well below random chance |
| Study of 6,627 forecasts by 68 forecasters | 6,627 | 48 | Not significantly different from chance |
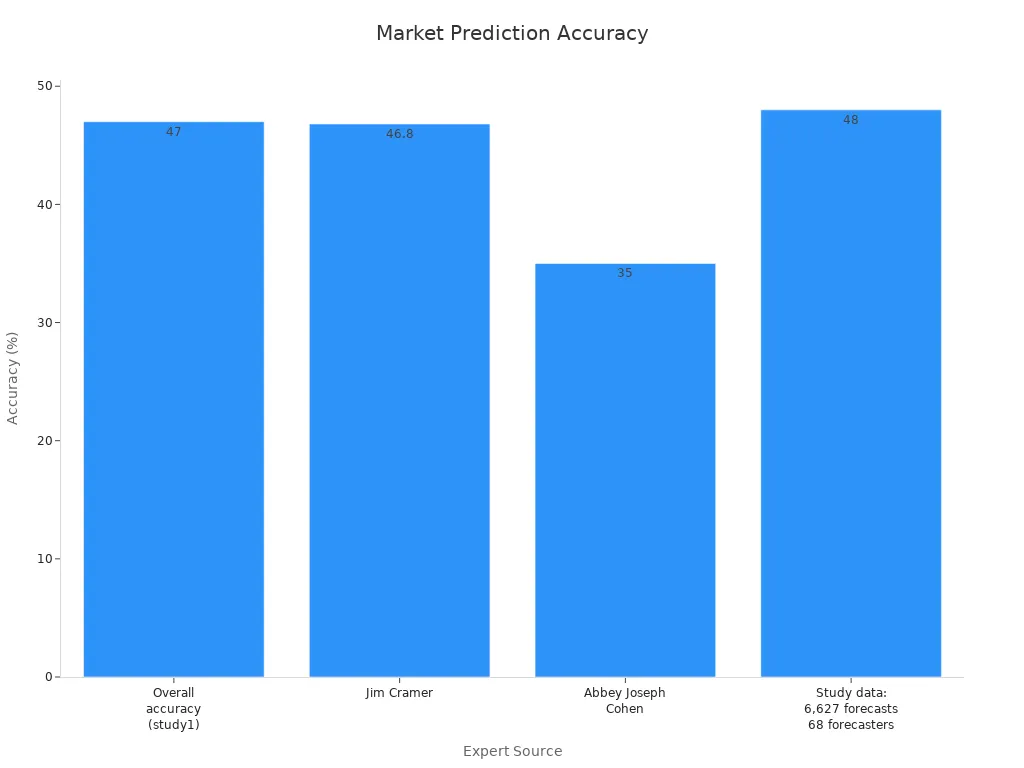
Note: Many expert forecasts fall below the 50% accuracy mark, which is the level expected from random chance.
Some models do outperform this low baseline. During different waves of the pandemic, certain machine learning and ensemble models achieved much lower error rates. For example, the best models had Mean Absolute Percentage Error (MAPE) scores as low as 5%. However, these successes are rare and often depend on the type of model, the data used, and changing conditions. Most traditional models and expert predictions still cluster around the 47% to 48% accuracy range.

Investors often look to indicators and macro indicators to improve their forecasts. While some indicators have a strong track record, no single method guarantees success. The data shows that most predictions, even from experts, do not beat random chance over five years.
Stock Market Prediction for Next 5 Years
Common Forecast Methods
Experts and institutions use a range of methods for stock market prediction for next 5 years. Many rely on systematic quantitative investing techniques. For example, Fidelity uses decades of proprietary research and advanced analytics to analyze large sets of market data. These methods include percent of sales, straight-line projections, moving averages, and both simple and multiple linear regression. Each method uses historical data to estimate future trends.
| Method | Description | Quantitative Basis |
|---|---|---|
| Percent of Sales | Forecasts financial items as a percentage of sales. | Uses historical ratios to project future values. |
| Straight Line | Projects revenue using a constant growth rate. | Multiplies previous year revenue by a set growth rate. |
| Moving Average | Smooths out short-term fluctuations by averaging past data points. | Calculates average of past periods to predict trends. |
| Simple Linear Regression | Models the relationship between two variables to forecast outcomes. | Uses statistical equations based on historical data. |
| Multiple Linear Regression | Considers several variables for more accurate forecasts. | Uses multiple data points to improve prediction accuracy. |
Most major financial institutions trust these models. About 75% use artificial intelligence in their financial modeling. Nearly all executives, 93%, depend on these models for strategic decisions. Banks and fintech lenders, 89%, enhance their credit risk models with alternative data. However, no single method works best for every market. Studies show that traditional statistical models like ARIMA and SETAR often outperform newer AI models in many markets. Combining different models or adding human judgment can improve results.
Recent five-year forecasts from major banks show wide variability. Large, diversified banks are expected to perform better due to multiple revenue streams. Midsize and regional banks face more risks, such as higher costs and concentrated loan exposure. European and Asian banks may see slower growth, while some Asia-Pacific banks could benefit from high-growth markets. These trends come from statistical analysis and regression methods applied to historical data.
Notable Indicators
Analysts use several indicators to guide stock market prediction for next 5 years. Leading indicators include the Consumer Confidence Index, which reflects consumer spending, and the Purchasing Managers Index, which predicts GDP growth. The yield curve stands out as a macro indicator. An inverted yield curve has often signaled upcoming recessions, affecting market trends over several years. Other important indicators are the Producer Price Index and housing data, such as housing starts and existing home sales.
These indicators have shown consistent predictive power in signaling economic shifts. However, they do not guarantee accuracy for every five-year period. Reliability depends on data quality, completeness, and timeliness. Analysts measure these factors using metrics like data completeness, consistency, accuracy, and validity. Even with strong indicators, unexpected events can change market directions. Investors should use these tools as part of a broader strategy, not as sole predictors.
Why Predictions Fail

Image Source: pexels
Market Complexity
Financial markets operate with many moving parts. Market cycles do not follow a fixed pattern. Some cycles last only minutes, while others stretch over decades. This variation makes timing the market very difficult. Investors use different strategies and act at different times, which causes delays and confusion in price movements. Even perfect timing offers only a small advantage over steady investing, as shown by a 2022 Charles Schwab study. Nobel laureate Paul Samuelson found that frequent trading does not outperform a steady approach. Psychological factors, such as herd behavior and overreaction, add more unpredictability. Research shows that when companies use complex financial products like derivatives, analysts’ long-term earnings forecasts become 26% less accurate and 27% more dispersed. Reporting complexity, rather than economic complexity, drives most of this inaccuracy. Changes in accounting standards have helped, but complexity still challenges predictive accuracy.
External Shocks
Unpredictable events often disrupt markets. These external shocks can come from many sources:
- Crop failures or trade disruptions can affect food prices and supply.
- Financial crises, wars, and pandemics cause sudden losses and market instability.
- The 1970s oil crises and recent geopolitical tensions have created volatility that models could not foresee.
- The COVID-19 pandemic led to panic buying, supply chain breakdowns, and price spikes for essential goods.
These shocks move through global systems, causing effects that models rarely capture. Empirical studies show that market returns can jump suddenly, with volatility and correlations changing over time. These changes make long-term forecasts unreliable.
Model Limits
Traditional economic models assume stable conditions and rational behavior. In reality, markets show contagion, network effects, and interdependence, especially during crises. Standard models cannot predict these complex interactions. External shocks, such as changes in financial policy, often reduce investment, employment, and trade, while raising inflation. These effects do not follow simple patterns. The average investor lacks the resources to monitor markets closely, making accurate long-term predictions even harder. Predictive models struggle to keep up with the real world’s complexity and sudden changes.
Lessons for Investors
Diversification
Diversification stands as a core principle for investors seeking long-term success. Historical data shows that different asset classes, such as stocks, bonds, and gold, perform well in different periods. This pattern highlights the need to spread investments across many types of assets. During the Q1 2020 market selloff, many investors learned their portfolios were less diversified than they thought. Some alternative investments only mimic traditional assets, which can increase costs without adding real protection.
Recent market data reveals that bonds often rise when stocks fall. For example, from late February to early April 2025, bonds offset stock losses. This balance reduces portfolio swings and helps investors stay calm during market drops. Over time, diversified portfolios show smaller losses and steadier growth. A portfolio with four different assets had a maximum drawdown of about 12%, much less than the S&P 500’s 50% drop during stress periods. Diversification also improves risk-adjusted returns, making it easier for investors to stick with their plans.
Tip: Building a truly diversified portfolio requires careful planning, regular review, and a willingness to look beyond recent winners.
Skepticism
Investors should approach bold or confident market forecasts with caution. Many predictions fail to beat random chance, even when made by experts. Overconfidence in forecasts can lead to poor decisions, such as chasing past winners or making big bets on a single outcome. Maintaining a healthy skepticism helps investors avoid costly mistakes.
- Question forecasts that promise certainty.
- Compare predictions from multiple sources.
- Focus on long-term trends rather than short-term noise.
Resilient Strategies
Resilient investing strategies do not depend on accurate predictions. Research shows that forecasting the future is often impossible due to constant changes in markets and economies. Instead, investors should prepare for many possible outcomes. This approach includes using flexible risk management, learning from past results, and adjusting strategies as conditions change.
| Metric | Strategic Value | How Investors Use It to Mitigate Forecast Reliance |
|---|---|---|
| Internal Rate of Return (IRR) | Measures annualized return, assessing profitability and efficiency over time. | Helps evaluate deal attractiveness and benchmark returns without relying on forecasts. |
| Loss Rate | Percentage of investments resulting in loss, critical for understanding downside risk. | Guides risk tolerance and portfolio stability assessment, reducing forecast dependency. |
By focusing on what can be controlled—such as diversification, risk management, and continuous learning—investors build portfolios that can weather uncertainty and thrive over time.
Five-year stock market predictions remain historically unreliable. Studies show that even professional forecasts often fail to match real outcomes. Investors benefit more by focusing on controllable factors. The table below highlights why forecasts should not drive investment decisions:
| Key Finding | Summary |
|---|---|
| Forecasting Power | One-year forecasts for US inflation and oil prices lose accuracy over time, dropping from 87% to 71% and 77% to 5%, respectively. |
| GDP vs. Equity Returns | Across 183 ten-year periods, the link between GDP growth and stock returns is weak (correlation 0.12). |
| Industry Returns | Even with perfect foresight, top-performing industries do not always yield the best returns. |
| Price Paid | Starting valuations strongly influence future returns, making price a key controllable factor. |
- Forecast accuracy metrics often mislead investors.
- Real-world investment success depends more on portfolio construction, risk management, and investment constraints.
- Advances in technology have not improved long-term forecasting accuracy.
Investors should stay skeptical of bold predictions and focus on building resilient, diversified portfolios. By controlling what they can, they improve their chances for long-term success.
FAQ
How accurate are five-year stock market predictions?
Most five-year stock market predictions have accuracy rates below 50%. Studies show that expert forecasts often perform no better than random guessing. Investors should treat these predictions with caution.
Can technology improve long-term market forecasts?
Advanced models, including machine learning, sometimes improve short-term accuracy. However, over five years, even the best technology struggles to predict market shifts caused by unexpected events or complex factors.
What indicators do experts use for five-year forecasts?
Experts often use indicators like the yield curve, Consumer Confidence Index, and Purchasing Managers Index. These tools help signal economic trends, but none guarantee accurate five-year predictions.
Should investors rely on expert forecasts for planning?
Investors should not depend solely on expert forecasts. A diversified portfolio and strong risk management offer better protection against market uncertainty than any single prediction.
How can investors protect themselves from forecast errors?
Investors can reduce risk by diversifying assets, reviewing portfolios regularly, and focusing on long-term goals. These steps help manage uncertainty when forecasts fail.
Five-year stock market predictions often miss the mark, with expert accuracy averaging just 47%, highlighting the need for diversified, resilient portfolios to tackle volatility. BiyaPay empowers you with a single account to trade US/HK stocks and cryptocurrencies, outperforming traditional brokers by enabling broad diversification at low cost. Convert USDT to USD or HKD at real-time rates to minimize exchange costs for global trading.
Backed by FinCEN and FINTRAC MSB licenses and SEC RIA registration, BiyaPay ensures secure, transparent trades with remittance fees as low as 0.5%. Sign up in minutes to build a flexible portfolio, whether you’re a beginner or active trader. Join BiyaPay now to boost returns and manage risk! Trade with BiyaPay today to thrive in unpredictable markets!
*This article is provided for general information purposes and does not constitute legal, tax or other professional advice from BiyaPay or its subsidiaries and its affiliates, and it is not intended as a substitute for obtaining advice from a financial advisor or any other professional.
We make no representations, warranties or warranties, express or implied, as to the accuracy, completeness or timeliness of the contents of this publication.
Related Blogs of

How Should SSDs and HDDs Work Together in AI Data Centers? Performance, Capacity, Cost, and Hot vs. Cold Data Compared


Is SMIC 0981.HK a Memory Chip Stock? The Relationship Between Foundry Manufacturing and the Memory Supply Chain


What Are NOR Flash, SLC NAND, and EEPROM? Why They Help Explain Hong Kong-Listed Memory-Related Stocks


What Is the Difference Between DRAM Contract Price and Spot Price? Which Indicator Should Investors Watch?

Choose Country or Region to Read Local Blog

Contact Us


BIYA GLOBAL LLC is registered with the Financial Crimes Enforcement Network (FinCEN), an agency under the U.S. Department of the Treasury, as a Money Services Business (MSB), with registration number 31000218637349, and regulated by the Financial Crimes Enforcement Network (FinCEN).
BIYA GLOBAL LIMITED is a registered Financial Service Provider (FSP) in New Zealand, with registration number FSP1007221, and is also a registered member of the Financial Services Complaints Limited (FSCL), an independent dispute resolution scheme in New Zealand.