The Power of Sentiment in Shaping Stock Market Outcomes


Image Source: unsplash
Investor sentiment drives stock market movements in 2025 more than ever. BlackRock notes that rallies and pullbacks this year often come from shifts in mood, not company fundamentals. You see this in how economic policy uncertainty and tariff shocks move markets. Social media platforms like Twitter and Facebook now shape market psychology every day. Algorithms scan millions of posts, classifying them as positive or negative, which influences trading. When you make investment decisions, digital sentiment tools help you spot trends and risks early. The table below shows key sentiment metrics and how they signal market shifts:
| Sentiment Metric | Bearish Signal | Bullish Signal |
|---|---|---|
| Fear and Greed Index | 0-25 | 75-100 |
| VIX Volatility Index | Above 40 | Below 12 |
| Put-Call Ratio | Above 1.0 | Below 0.5 |
Understanding these psychological drivers is essential for wise investment decisions and accurate stock market predictions 2025. Your emotions and the crowd’s mood can shape your investing outcomes.
Key Takeaways
- Investor sentiment strongly influences stock market moves in 2025, often more than company fundamentals.
- Social media and digital tools provide real-time insights into market mood, helping you spot trends early.
- Emotions like fear and greed, along with biases such as herd mentality and loss aversion, shape investor decisions and market swings.
- Use trusted sentiment indicators like the VIX, Fear and Greed Index, and AAII survey to identify market extremes and possible reversals.
- Manage your emotions, diversify your portfolio, and combine sentiment data with fundamentals for smarter investment choices.
Investor Sentiment in 2025
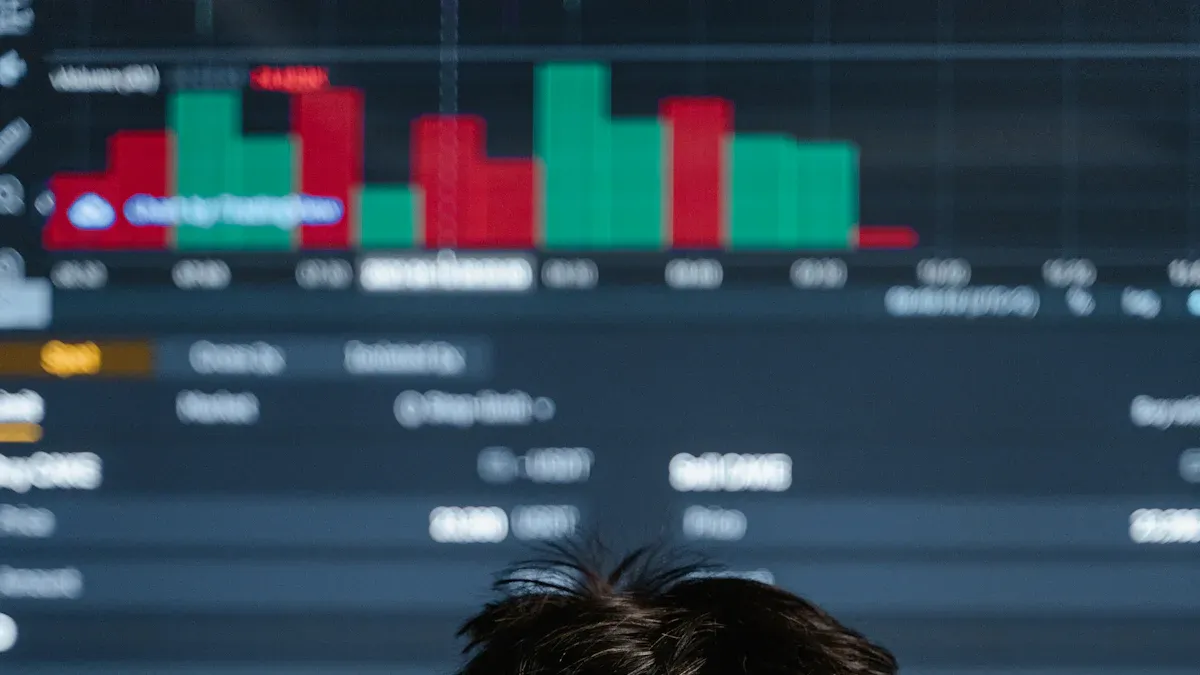
Image Source: pexels
Sentiment Trends
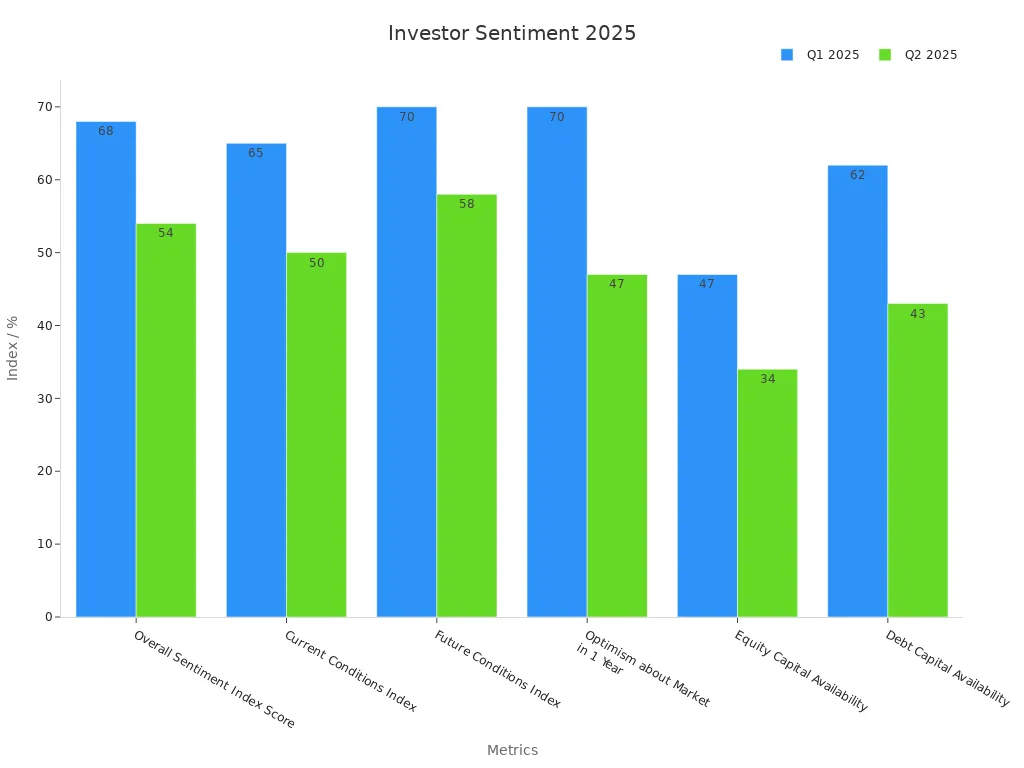
You can see how market sentiment changes quickly in 2025. Many surveys show that investor sentiment has dropped since last year. The Real Estate Roundtable survey gives you a clear picture. In the first quarter, the overall sentiment index score was 68. By the second quarter, it fell to 54. This shows a big shift in market sentiment and investor confidence. The table below helps you see these changes:
| Metric | Q1 2025 Findings | Q2 2025 Findings |
|---|---|---|
| Overall Sentiment Index Score | 68 (down 5 points from Q4 2024) | 54 (down 14 points from Q1 2025) |
| Current Conditions Index | 65 (down 4 points from Q4 2024) | 50 (down 15 points from Q1 2025) |
| Future Conditions Index | 70 (down 7 points from Q4 2024) | 58 (down 12 points from Q1 2025) |
| Optimism about Market in 1 Year | 70% expect improvement | 47% expect improvement |
| Perception of Asset Values | 45% say unchanged; 56% expect increase | 42% say unchanged; 38% expect stable; 38% expect decline |
| Equity Capital Availability | 47% say better than last year | 34% say better than last year |
| Debt Capital Availability | 62% say better than last year | 43% say better than last year |
| Key Concerns | Interest rates, insurance costs, policy uncertainty | Policy uncertainty, rising costs, execution risk |
You notice that market sentiment can swing from bullish sentiment to bearish sentiment very fast. For example, EPFR data shows that Japan Equity Funds saw record redemptions in May 2025. This is a sign of bearish sentiment and risk aversion. When everyone feels the same way—either too optimistic or too pessimistic—market reversals often follow. You should watch for these one-way market trends, as they can signal big changes ahead.
Digital and Social Media Impact
Digital platforms now shape market sentiment every day. You see investors share opinions on Twitter, Seeking Alpha, and other sites. Studies show that social media sentiment often predicts stock returns better than news articles. For example, BlackRock uses data from cash holdings, ETF flows, and social media to track market sentiment. When tariff news hit in April 2025, market sentiment dropped sharply. This had a big impact on markets and led to more bearish sentiment.
Tip: Pay attention to both bullish sentiment and bearish sentiment on social media. These signals can help you spot shifts in market trends before they show up in prices.
Social media also helps you learn about market sentiment in real time. You can see how investor confidence changes with each new headline. This makes it easier to react to market trends and avoid getting caught in sudden swings.
Market Psychology and Biases
Emotional Drivers
You play a key role in market psychology every time you make a decision. Emotions like fear and greed often drive market behavior. When you feel fear, you may want to sell your stocks quickly. This can slow down market momentum and push prices lower. Greed works in the opposite way. When you see others making money, you may want to buy more, hoping for bigger gains. This can push prices higher and create bubbles.
Many studies show that fear and greed shape investor psychology. The Fear and Greed Index tracks these emotions and their effects on prices. During times of crisis, fear spreads fast and leads to sharp drops in the market. Greed can take over when prices rise, making you and others take more risks. Research from Westerhoff and others shows that these emotions cause big swings in market behavior, especially during turbulent periods. You can see this in how the VIX, a fear index, moves with stock prices in the US, UK, and Germany.
Herd mentality also affects market psychology. When you see a crowd moving in one direction, you may want to follow. This can lead to bubbles or crashes. Overconfidence is another driver. If you believe you know more than others, you may trade too much or ignore warning signs. These emotional drivers shape investor psychology and trading psychology every day.
Common Biases
Investor psychology includes many common biases that affect market behavior. Loss aversion is one of the strongest. You may feel losses more deeply than gains. This can make you hold on to losing stocks too long or sell winners too soon. Studies show that loss aversion is common across all ages and education levels.
Confirmation bias is another key bias. You may look for information that supports your views and ignore facts that do not fit. This can lead to poor investment behavior and missed opportunities. Overconfidence makes you believe your predictions are better than they are. This can cause you to trade more often and take bigger risks.
Herding is also widespread. Many investors follow the crowd, especially younger ones. Surveys show that 39% of professionals see herding as a top bias, and 57% report loss aversion as most relevant. Confirmation bias is common too, especially among those with more training. The chart below shows how these biases appear among different groups:
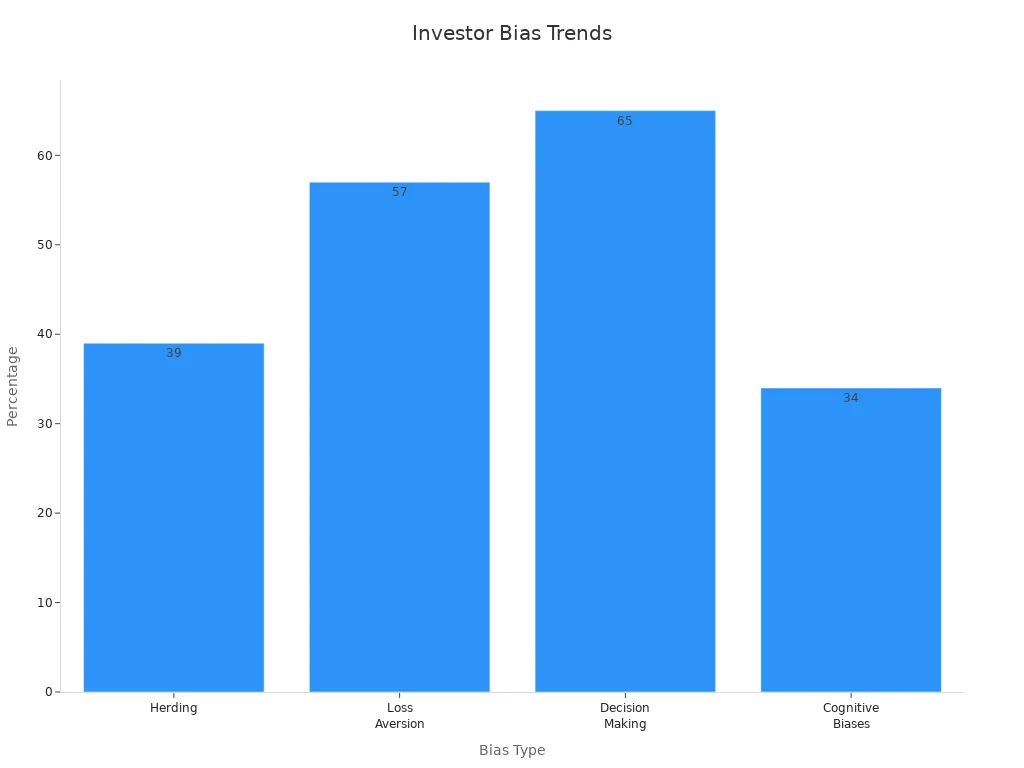
These biases shape market psychology and investor psychology. They can lead to irrational choices and affect market performance. You can see their impact in both rising and falling markets.
Measuring Investor Sentiment
Image Source: unsplash
Surveys and Indicators
You can measure market sentiment using several trusted tools. The AAII Investor Sentiment Survey asks investors if they feel bullish, bearish, or neutral about the market. This survey has tracked investor mood since 1987. When most people feel very optimistic or very pessimistic, it often signals a turning point in the market. For example, in 2009, the AAII survey showed 70.3% bearish sentiment right before the market started to recover.
The VIX, also called the “fear index,” measures how much people expect the S&P 500 to move in the next 30 days. High VIX values mean more fear and uncertainty. Low values show calm. The Put/Call Ratio looks at how many people are buying options to protect against losses versus those betting on gains. When this ratio jumps, it can signal that fear is peaking.
You can use these sentiment indicators together to get a clearer picture. Many traders look at the VIX, AAII survey, and Put/Call Ratio at the same time. This helps you spot when market sentiment reaches an extreme. Technical analysis tools, like moving averages and trend lines, also help you see how price and volume reflect investor mood.
Tip: When you see all these indicators showing extreme fear or greed, it may be time to prepare for a market shift.
Social Media Analysis
Social media platforms give you real-time clues about market sentiment. Many companies use advanced tools to track what people say about stocks online. These tools scan millions of posts and comments to find trends. While most focus on general consumer feelings, some can show how news and opinions spread quickly.
Here is a table of popular social media analytics tools and what they offer:
| Tool Name | Key Features Relevant to Sentiment Analysis and Investor Sentiment Trends | Notes on Investor Sentiment Focus |
|---|---|---|
| Sprout Social | Advanced listening, AI-powered summaries, influencer ROI tracking | Focuses on consumer sentiment |
| Sendible | Automated reports, audience engagement tracking | General social media performance |
| Keyhole | Real-time analysis, competitor monitoring | Indicates sentiment trends |
| BuzzSumo | Content engagement tracking | Content focus |
| Google Analytics | Tracks social campaigns, measures social ROI | No direct sentiment analysis |
Most of these tools do not focus only on investor sentiment. They help you see how news and opinions move through social networks. By watching these trends, you can react faster to changes in market sentiment and make better decisions for 2025.
Stock Market Predictions 2025
Sentiment vs. Fundamentals
You see that investor sentiment often outweighs company fundamentals in shaping stock market predictions 2025. Many investors react quickly to news, rumors, or social media posts, which can move prices before any real change in a company’s value. In 2025, this pattern became clear during several major events. For example, on April 7, a rumor about a 90-day pause on tariffs caused a sharp rally. The U.S. market jumped about 7% from its low that day. When the rumor was proven false, prices dropped again. This shows how quickly sentiment can drive market trends, even when company fundamentals remain unchanged.
A key study from 2025 found a strong link between investor sentiment and the performance of the CSI 300 index. Researchers used comments from stock forums and a special sentiment dictionary to measure mood. They discovered that positive sentiment often led to higher closing prices and better return rates. The effect was strongest during rising markets, but it faded over time. This means that investor mood not only reflects what is happening but also helps predict future stock market predictions 2025.
You can see more examples in the table below:
| Event or Factor | Sentiment Effect | Fundamental Effect | Market Impact |
|---|---|---|---|
| Tariff Rumor (April 2025) | Rapid optimism, 7% rally | No change in company earnings | Short-term price spike, quick reversal |
| Tech Sector Positioning | High bullishness, beta 1.6 | Stable earnings | Increased risk, sharp corrections |
| Yen Carry Trade Unwind | Fear-driven sell-off | Currency shift, not earnings | 13% drop in Russell 1000 Growth index |
These cases show that sentiment can overpower fundamentals, especially during uncertain times. Tools like the Consumer Confidence Index and Fear & Greed Index help you track these emotional swings. When everyone feels the same way—either too optimistic or too pessimistic—prices often move away from their true value.
Quantitative studies in 2025 used advanced models to measure the impact of news sentiment on U.S. markets. These studies found that positive news caused quick price jumps, while negative news led to longer downturns. News sentiment also spread across related companies and sectors, creating waves of change. This research proves that investor mood is a key part of stock market predictions 2025.
You should also know that combining sentiment data with traditional financial numbers improves prediction accuracy. For example, models that use both sentiment and historical prices predict market trends 10-20% better than those using sentiment alone. This shows that while fundamentals matter, sentiment often leads the way in the short term.
Note: In 2025, the Health Care sector underperformed the S&P 500 by 22.4%, with $7.4 billion in ETF outflows. Later, a surge in Health Care stocks hitting 20-day highs signaled a positive shift in sentiment, which helped predict a sector recovery.
Contrarian Signals
You can use extreme investor sentiment as a signal to do the opposite of the crowd. This is called contrarian investing. When most people feel very optimistic or very pessimistic, the market often moves in the other direction soon after. For stock market predictions 2025, this strategy can help you spot turning points and prepare for a recovery.
Sentiment indicators like the AAII Sentiment Survey, the CBOE Volatility Index (VIX), and the Fear and Greed Index measure how investors feel. When these tools show extreme readings, contrarian investors take the opposite side. For example, during the COVID-19 pandemic, extreme fear led to a big sell-off. Contrarian investors who bought during this time saw strong gains during the recovery.
Here are some tools and signals you can watch:
- VIX (Volatility Index): High values mean fear is high. This can signal a buying opportunity.
- NYSE High/Low Indicator: Tracks how many stocks hit new highs or lows. Extreme numbers can show when the market is overbought or oversold.
- Odd-Lot Trading: When small investors trade a lot during extremes, it can signal a reversal.
- Commitment of Traders Report: Shows futures positions. Extreme bets often come before a market shift.
You can also look at historical examples. During the dot-com bubble, extreme optimism signaled a coming crash. After the 2008 financial crisis, extreme pessimism marked the start of a recovery. In 2025, similar patterns appeared. For instance, when the market became too bullish on technology stocks, a sharp correction followed. When fear peaked after tariff news, the market soon bounced back.
Statistical analyses from 2025 confirm that contrarian signals work in other markets too. For example, gold prices rose by an average of 1.8% within three days after U.S. tariff announcements. Central banks and large investors increased their gold holdings during these uncertain times, using contrarian strategies to protect their portfolios.
Tip: Contrarian investing is not risk-free. You should use stop-loss orders and diversify your investments to manage risk.
Sentiment-driven trading creates bubbles, volatility, and momentum effects. These patterns challenge the idea that markets always reflect true value. By watching sentiment extremes, you can improve your stock market predictions 2025 and prepare for the next recovery.
Navigating Sentiment-Driven Markets
Emotional Awareness
You need to understand your emotions when making investment decisions. Investor psychology shows that emotions like fear and excitement can change how you react to market news. Studies reveal that experienced traders do not ignore their feelings. Instead, they learn to manage them. For example, when markets fall, keeping calm and staying alert helps you avoid panic selling. When prices rise, controlling excitement stops you from chasing risky trades. Research also finds that your body’s signals, such as changes in skin conductance, can warn you about stress before you act. By paying attention to these signals, you can improve your trading results. Emotional awareness lets you use your feelings as helpful signals, not as reasons for rash decisions. This skill forms a key part of investor psychology and helps you build a stronger investment strategy.
Tip: Try keeping a journal of your trades and feelings. Reviewing your notes can help you spot patterns and improve your decision-making.
Practical Strategies
You can use several practical steps to manage sentiment-driven markets. Start by monitoring real-time sentiment from sources like social media, news, and earnings reports. Tools such as Google Trends and StockTwits help you spot mood shifts early. Sentiment dashboards let you track changes and compare different stocks or sectors. Combining these tools gives you a clearer view of market trends and supports better risk management.
A strong investment strategy also includes diversification. Adding private assets, such as real estate or private credit, can reduce your portfolio’s ups and downs. These assets often move differently from stocks and bonds, which helps protect you during market swings. Investor psychology research shows that mood shifts can lead to sudden market changes. Diversification helps you stay steady when emotions run high.
You should also set clear goals and use systematic analysis. Automated alerts and checklists keep you focused on facts, not feelings. Peer reviews and investment clubs offer outside opinions, which help you avoid common biases. Using both data and expert insights makes your investment strategy more robust.
Note: Long-term success comes from combining emotional awareness, smart tools, and a balanced portfolio. This approach helps you manage risk and make better choices, even in fast-changing markets.
Investor sentiment and market psychology shaped stock market outcomes in 2025. Shifts in mood, such as the defensive turn in Q1, led to a -4.6% quarterly return for U.S. equities. You saw similar patterns during global crises, where fear and uncertainty drove sharp declines.
- Track indicators like the VIX and Put/Call ratio to understand market mood.
- Recognize how herd mentality and media can move prices away from fundamentals.
Apply practical strategies and reflect on your own mindset. Stay alert to digital sentiment trends to make informed investment choices.
FAQ
What is investor sentiment?
Investor sentiment shows how you and other investors feel about the market. It reflects your mood, such as optimism or fear. You can measure it with surveys, indexes, and social media trends.
How does social media affect stock prices?
Social media spreads news and opinions quickly. You see trends form in real time. Positive or negative posts can move stock prices before official news appears.
Can I use sentiment indicators to predict market changes?
Yes, you can use tools like the VIX or AAII survey to spot extreme moods. These signals often warn you about possible market reversals or big moves.
Tip: Combine sentiment indicators with company data for better results.
Why do market bubbles and crashes happen?
Bubbles and crashes happen when many investors act on strong emotions. You may follow the crowd during times of greed or fear. This behavior pushes prices far from real value.
In the sentiment-driven stock market of 2025, acting swiftly on market shifts is crucial for success. BiyaPay empowers you to trade U.S. and Hong Kong stocks seamlessly from a single account, eliminating the need for complex offshore banking. With real-time exchange rate queries and conversions for over 30 fiat currencies and 200+ cryptocurrencies, BiyaPay lets you adapt to market mood swings effortlessly.
Sign-up takes just one minute, with an intuitive interface designed for rapid decision-making. Visit BiyaPay now to register and start navigating the U.S. and Hong Kong markets with confidence!
*This article is provided for general information purposes and does not constitute legal, tax or other professional advice from BiyaPay or its subsidiaries and its affiliates, and it is not intended as a substitute for obtaining advice from a financial advisor or any other professional.
We make no representations, warranties or warranties, express or implied, as to the accuracy, completeness or timeliness of the contents of this publication.
Related Blogs of

The Relationship Between Fed Rate Cuts and New York Stock Market Fluctuations Is No Longer a Simple Cause-and-Effect


After Over 100 Billion in Buybacks, Has Tencent's Long-Term Investment Logic Changed?


2025 Taiwan Stock Market Year-End Review and 2026 Outlook: Can the AI Boom Continue?


Ultimate Guide to Applying for a Schengen Visa in the USA in 2025: Understand the Process, Documents, and Timeline in One Article

Choose Country or Region to Read Local Blog

Contact Us


BIYA GLOBAL LLC is a licensed entity registered with the U.S. Securities and Exchange Commission (SEC No.: 802-127417); a certified member of the Financial Industry Regulatory Authority (FINRA) (Central Registration Depository CRD No.: 325027); regulated by the Financial Industry Regulatory Authority (FINRA) and the U.S. Securities and Exchange Commission (SEC).
BIYA GLOBAL LLC is registered with the Financial Crimes Enforcement Network (FinCEN), an agency under the U.S. Department of the Treasury, as a Money Services Business (MSB), with registration number 31000218637349, and regulated by the Financial Crimes Enforcement Network (FinCEN).
BIYA GLOBAL LIMITED is a registered Financial Service Provider (FSP) in New Zealand, with registration number FSP1007221, and is also a registered member of the Financial Services Complaints Limited (FSCL), an independent dispute resolution scheme in New Zealand.