Recent Volatility and Market Highlights of Nasdaq Index Futures


Image Source: pexels
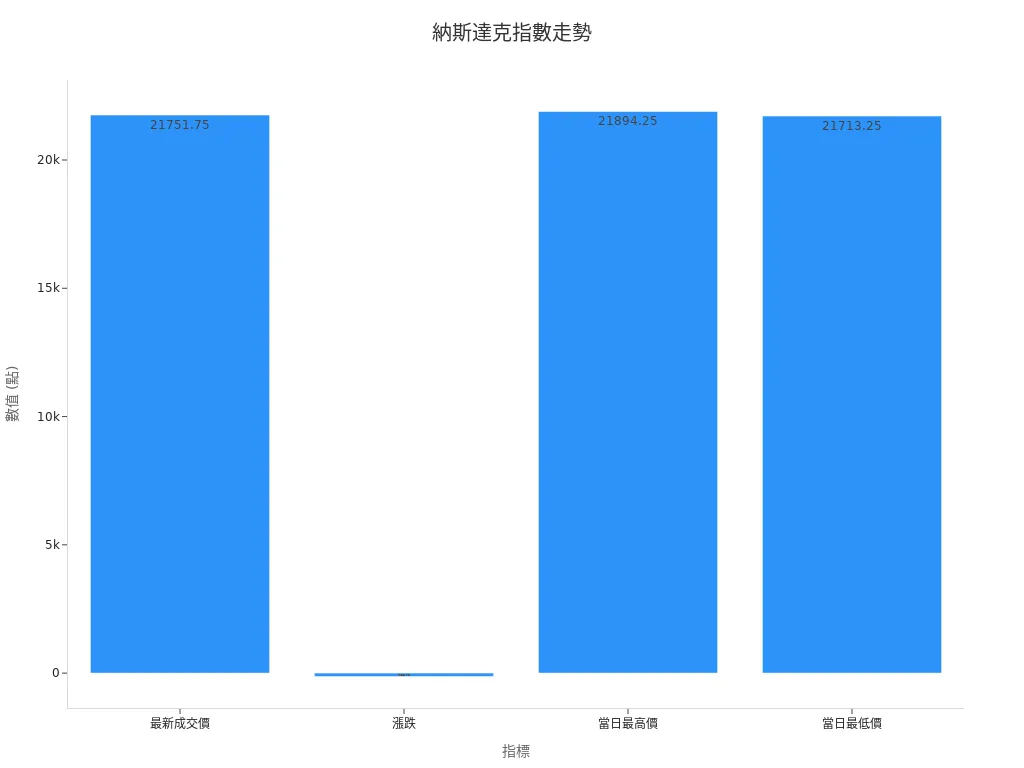
Nasdaq index futures have recently shown significant volatility, with investors closely monitoring market dynamics. According to the latest data, the futures’ latest transaction price was 21751.75 points, with a daily high of 21894.25 points, a low of 21713.25 points, a trading volume of 523,556, and open interest of 268,076 contracts. The market has a three-stage price limit, set at ±7%, ±13%, and ±20%. The table below displays key statistical data:
| Indicator | Value |
|---|---|
| Latest Transaction Price | 21751.75 points |
| Change | -135.75 points |
| Decline | 0.62% |
| Daily High | 21894.25 points |
| Daily Low | 21713.25 points |
| Trading Volume | 523,556 |
| Open Interest | 268,076 |
Recent U.S. economic data, interest rate policies, and international situations have been major driving factors. The Nasdaq 100 index futures have high activity and are an important reference for investors’ asset allocation.
Key Points
- The Nasdaq index futures prices have recently experienced significant changes.
- U.S. economy, interest rates, and international news all impact it.
- Investors should pay attention to these important factors.
- E-mini Nasdaq 100 futures are very popular.
- This contract design is very flexible.
- Trading is available almost around the clock.
- This makes it easier for investors to operate and manage risks.
- Tech company stocks are performing well.
- Nvidia, Apple, and Microsoft are particularly strong.
- They drive the Nasdaq index futures upward.
- In the long term, these companies will continue to grow.
- Technical analysis has identified key support and resistance levels for the index.
- Investors should use technical indicators to adjust strategies.
- This can help make better decisions.
- Investors should pay attention to risk management.
- They can diversify investments, use leveraged products, and trade overnight.
- This can address market changes and make assets safer.
Trend Overview

Image Source: unsplash
Price Volatility
Nasdaq index futures have recently shown strong performance, with prices mainly fluctuating between 19,500 and 21,800 points. Over the past week, the index futures recorded an approximate 7% increase, outperforming other major U.S. stock indices. Market sentiment is bullish, with investors’ risk appetite significantly recovering due to eased U.S.-China trade negotiations. Although the consumer confidence index slightly declined, market focus remains on economic data and international situations, driving the Nasdaq index futures to continue rising.
- The Nasdaq Composite Index rose approximately 0.1% to 0.18% on the day, reaching around 19,564 points.
- S&P 500 index futures rose 0.2% and broke through the 6,000-point mark.
- Investor funds are flowing back to risk assets, with a noticeably bullish market atmosphere.
- The futures price range is mainly maintained around 19,500 points, with short-term fluctuations of about 0.1% to 0.2%.
The E-mini Nasdaq 100 futures contract is flexibly designed, with clear specifications for contract unit, quotation method, and minimum price fluctuation. These specifications determine the basic unit of price volatility, allowing investors to precisely manage risks. Trading hours cover nearly 24 hours, ensuring market information is promptly reflected in price changes. Historical data shows that macroeconomic indicators such as CPI, unemployment rate, and FOMC policy decisions directly affect futures prices, and investors can judge future trends based on this.
Experts suggest that although the market is bullish, confidence remains fragile, and investors should appropriately allocate hedging positions to reduce potential risks.
Trading Activity
The trading activity of Nasdaq index futures remains consistently high. Taking E-mini Nasdaq 100 futures as an example, the latest trading volume exceeded 520,000 contracts, with open interest reaching over 268,000 contracts, indicating extremely high market participation. The contract specifications are designed to facilitate flexible participation by both institutional and retail investors, attracting significant capital inflows.
- Contract Unit: Each point movement corresponds to USD 20, allowing investors to operate with precision.
- Quotation Method: Quoted in index points, with a minimum tick size of 0.25 points.
- Trading Hours: Covers nearly 24 hours, allowing Hong Kong investors to flexibly participate in overnight trading.
- Trading Volume and Open Interest: Reflects sufficient market liquidity and high price discovery efficiency.
The table below summarizes the main contract specifications for E-mini Nasdaq 100 futures:
| Item | Specification |
|---|---|
| Contract Unit | USD 20 × Index Points |
| Minimum Tick Size | 0.25 points |
| Quotation Currency | U.S. Dollar (USD) |
| Trading Hours | Nearly 24 hours |
| Exchange | Chicago Mercantile Exchange |
The high liquidity and transparency of Nasdaq index futures make them an important tool for global investors’ asset allocation. Historical volatility is closely related to recent price changes, and investors can adjust strategies based on historical data to enhance risk management capabilities.
Market Highlights

Image Source: unsplash
Economic Data
The price volatility of Nasdaq index futures is closely related to multiple economic data points. Recently, U.S.-released retail data, consumer confidence index, non-farm payrolls, initial jobless claims, manufacturing and services indices, GDP growth rate, Consumer Price Index (CPI), and Producer Price Index (PPI) have become market focuses. These data reflect economic conditions, inflation pressures, and labor market changes, directly affecting investors’ judgments on future economic cycles and stock valuations.
- On February 3, 2023, U.S. non-farm payroll data was released, showing 517,000 new jobs, far exceeding market expectations of 188,000. This indicates a robust job market, with market expectations that the Federal Reserve may continue to raise interest rates, significantly impacting Nasdaq index futures.
- In 2022, rapid inflation led to multiple Fed rate hikes, with information technology stocks experiencing the largest declines, and the Nasdaq 100 index falling about 33% for the year, compared to an 18% drop for the S&P 500.
- Since 2024, inflation has decreased, unemployment has slightly risen, and the misery index dropped from a 2020 high of 15.1 to 6.5, reducing recession concerns and driving a stock market rebound.
- The U.S. Federal Reserve began cutting rates by 3 basis points in September 2024, with expectations of continued cuts in 2024 and 2025. Historical experience shows positive stock market performance during preventive rate cuts.
Investors should closely monitor indicators like CPI and non-farm data, as these affect market expectations for interest rate policies, thereby influencing Nasdaq index futures trends.
Additionally, market capital momentum is worth noting. The market capitalization growth of the S&P 500 and Taiwan stock market exceeded 50%, far surpassing GDP growth during the same period, with market cap-to-GDP ratios rising to 2.1 and 3.1 times, respectively, suggesting potential market overheating. AI technology has driven a roughly 50% surge in U.S. tech stocks, exceeding economic fundamentals, indicating limited momentum for further stock market gains.
Policy and International Situations
Policy news and international situations also significantly impact Nasdaq index futures. On March 4, 2025, the U.S. government imposed a 25% tariff on Canada and Mexico, leading to a sharp decline in U.S. stocks, with the Nasdaq index falling over 2% in a single day. The VIX fear index surged 16%, showing that policy news directly affects investor confidence and triggers significant volatility in Nasdaq index futures prices. Buffett noted that such tariff policies are akin to a goods tax, which could create long-term market pressure.
Changes in international situations cannot be ignored either. In late February 2025, Nvidia’s earnings fell short of expectations, causing the Nasdaq index to record its largest single-day drop in nearly a month. This reflects the simultaneous impact of corporate earnings and international events on Nasdaq index futures prices.
Market experts suggest that investors should closely monitor policy developments and international situations, as these factors quickly reflect in futures prices during overnight trading sessions.
The Nasdaq index futures market offers various leveraged and inverse products, allowing investors to flexibly adjust positions based on market sentiment. Overnight trading sessions also provide more operational opportunities, especially during frequent international news events. These products and trading sessions enhance market liquidity but also increase short-term volatility risks.
| Highlight Factor | Recent Impact | Impact Scope |
|---|---|---|
| Interest Rate Policy | Expected continued rate cuts | Stock market, futures market |
| International Trade Policy | Tariff adjustments | U.S. stocks, global markets |
| Corporate Earnings | Tech stock volatility | Index futures prices |
| Overnight Trading | Instant reflection of news | Increased volatility |
| Leveraged/Inverse Products | Flexible position adjustments | Enhanced operational flexibility |
The prices of Nasdaq index futures are influenced by multiple factors, and investors should combine economic data, policy news, and international situations, flexibly using leveraged products and overnight trading strategies to enhance risk management capabilities.
Nasdaq Index Futures Focus
Popular Stocks
Recently, tech stocks have played a pivotal role in the composition of Nasdaq index futures. Nvidia (NVIDIA) drove significant gains in the semiconductor sector due to a major AI chip deal announcement, with the Philadelphia Semiconductor Index rising 3.13%. Meanwhile, the Nasdaq Composite Index rose 1.52% due to strong performances by Nvidia and other tech stocks. Market analysis indicates that the performance of tech stocks and large-cap growth stocks significantly influences the trend of Nasdaq index futures.
Additionally, the steady growth of tech giants like Apple and Microsoft further boosts market confidence. These companies, leveraging innovative R&D capabilities, demonstrate strong resilience and investment potential. With the widespread adoption of AI technology and national-level investment plans, related tech stocks maintain strong growth momentum in the medium to long term. Despite short-term volatility risks from uncertainties in international trade policies, the leading position of tech stocks remains solid.
Technical Analysis
Technical analysis shows that Nasdaq index futures recently face key resistance and support levels. The 50-day moving average indicates a support level around 20,140 points, with resistance near 21,000 points. The daily MACD indicator shows a sell signal, suggesting potential downward pressure in the short term. The stochastic indicator further supports this view, indicating cautious market sentiment.
Bollinger Bands, as an important technical analysis tool, show that the price fluctuation range of Nasdaq index futures is gradually narrowing, suggesting a potential breakout may be imminent. Volume and psychological line indicators indicate that market momentum remains sufficient, supporting a medium-to-short-term bullish trend. Experts recommend that investors closely monitor changes in technical indicators like MACD and RSI and adjust trading strategies based on support and resistance levels.
Overall, technical analysis and the performance of popular stocks complement each other, collectively influencing the trend of Nasdaq index futures. Investors should combine fundamental and technical information to flexibly respond to market changes.
Index Comparison
Other U.S. Stock Indices
Nasdaq 100 index futures, Mini Dow Jones Industrial Index futures, and Mini S&P 500 index futures each have distinct characteristics in the U.S. stock market. Nasdaq 100 index futures focus on high-tech and high-growth non-financial stocks, representing the development trend of the U.S. tech industry. Dow Jones Industrial Index futures cover traditional industries, consumer goods, and finance, among other diverse sectors. S&P 500 index futures are market-cap weighted, reflecting the overall performance of large U.S. companies. All three offer nearly 24-hour trading, sufficient liquidity, and smaller contracts to lower the investment threshold.
| Index Futures Name | Mini Dow | Mini NASDAQ 100 | Mini S&P 500 |
|---|---|---|---|
| Contract Specification | USD 5 × Index | USD 20 × Index | USD 50 × Index |
| Minimum Tick Value | USD 5 | USD 5 | USD 12.5 |
| Trading Months | March, June, September, December | March, June, September, December | March, June, September, December |
These differences reflect the unique positioning of Nasdaq 100 index futures in terms of tech stock representation and contract flexibility. Investors can flexibly choose suitable index futures products based on their risk tolerance and industry preferences.
Global Markets
Comparing the trends of major global market futures products helps establish a macro investment perspective. Investors can use professional platforms’ comparison functions to overlay multiple futures products on the same chart to observe price fluctuations across different markets. The following are common analysis steps:
- On platforms like TradingView, select the “Compare or Add Symbols” function to add major index futures from the U.S., Europe, and Asia to the same chart.
- If separate observation is needed, move different symbols to new panes to avoid overlapping lines.
- Adjust the time frame (e.g., daily, monthly, or hourly) and select appropriate chart types (e.g., candlestick charts) to clearly compare market trends in the same period.
- Overlay technical indicators (e.g., moving averages, KD indicators) and other price or fundamental indicators to assist in judging market trends.
Through these methods, investors can gain a more comprehensive understanding of global market dynamics, enhancing asset allocation flexibility and risk management capabilities.
When facing market volatility, investors should prioritize risk management. They can diversify investments to reduce losses from single assets. Real-time monitoring of market dynamics helps flexibly adjust investment strategies. Experts suggest that rational judgments based on technical analysis and market highlights can enhance the robustness of asset allocation.
FAQ
What are the trading hours for Nasdaq index futures?
Nasdaq index futures are traded nearly 24 hours. The main sessions include U.S. daytime and overnight sessions, allowing Hong Kong investors to participate flexibly.
How much capital is needed to trade Nasdaq index futures?
Investors need to pay a margin, the amount of which depends on the broker and contract specifications. For E-mini contracts, the margin is approximately USD 16,000, with actual amounts adjusting based on market fluctuations.
What are the risks of leveraged products?
Leveraged products can amplify profits but also increase the risk of losses. Investors should set stop-loss orders and strictly control positions to avoid significant capital fluctuations.
What is the difference between Nasdaq index futures and spot?
Futures are derivative products, allowing two-way trading, suitable for short-term and hedging strategies. Spot prices reflect the actual index price and can only be held in one direction.
How can I check real-time Nasdaq index futures quotes?
Investors can access real-time quotes and related data through professional financial platforms, Hong Kong bank online wealth management services, or exchange websites.
Recent fluctuations in Nasdaq 100 futures, driven by economic data, interest rate policies, and global events, highlight the strength of tech stocks like Nvidia, Apple, and Microsoft. To navigate these market dynamics, BiyaPay offers a seamless financial platform, enabling trading in U.S. and Hong Kong stocks without offshore accounts to capitalize on tech-driven opportunities.
Supporting USD, HKD, and 30+ fiat and digital currencies with real-time exchange rate transparency, plus global remittances to 190+ countries with remittance fees as low as 0.5%. A 5.48% annualized yield savings product with no lock-in period ensures flexibility. Sign up for BiyaPay today to combine Nasdaq futures insights with BiyaPay’s versatile tools for secure, strategic investments!
*This article is provided for general information purposes and does not constitute legal, tax or other professional advice from BiyaPay or its subsidiaries and its affiliates, and it is not intended as a substitute for obtaining advice from a financial advisor or any other professional.
We make no representations, warranties or warranties, express or implied, as to the accuracy, completeness or timeliness of the contents of this publication.
Related Blogs of

Enterprise Overseas Payroll Compliance and Tax Planning: How to Use Multi-Asset Payroll Platforms to Reduce Cross-Border Employment Costs?


Patreon/OnlyFans and Other Overseas Creator Platforms Payout: Ultimate Tricks to Bypass Domestic Bank Forex Review for Withdrawal


How Do European International Students Pay the Final Installment for a Used Car? Digital Payment Methods to Avoid SEPA Transfer Delays Caused by Weekend Bank Closures


Choose Country or Region to Read Local Blog

Contact Us


BIYA GLOBAL LLC is registered with the Financial Crimes Enforcement Network (FinCEN), an agency under the U.S. Department of the Treasury, as a Money Services Business (MSB), with registration number 31000218637349, and regulated by the Financial Crimes Enforcement Network (FinCEN).
BIYA GLOBAL LIMITED is a registered Financial Service Provider (FSP) in New Zealand, with registration number FSP1007221, and is also a registered member of the Financial Services Complaints Limited (FSCL), an independent dispute resolution scheme in New Zealand.