- Remittance
- Exchange Rate
- Stock
- Events
- EasyCard
- More
- Download
- 6th Ann

McDonald's stock price plummeted nearly 10%, but there are still positive factors.
Since the beginning of this year, McDonald’s (New York Stock Exchange stock code: MCD ) stock has been performing poorly, falling nearly 10%. The company’s global comparable sales growth rate has fallen for the fourth consecutive quarter to 1.9%. The quarterly announcement previously released also failed to boost market confidence. However, the company announced new long-term goals at the end of 2023, including measures to expand its restaurants by 4-5% annually in the future. Its store growth plan is relatively optimistic, and the overall revenue is showing a growth trend. Overall, there are also positive factors.
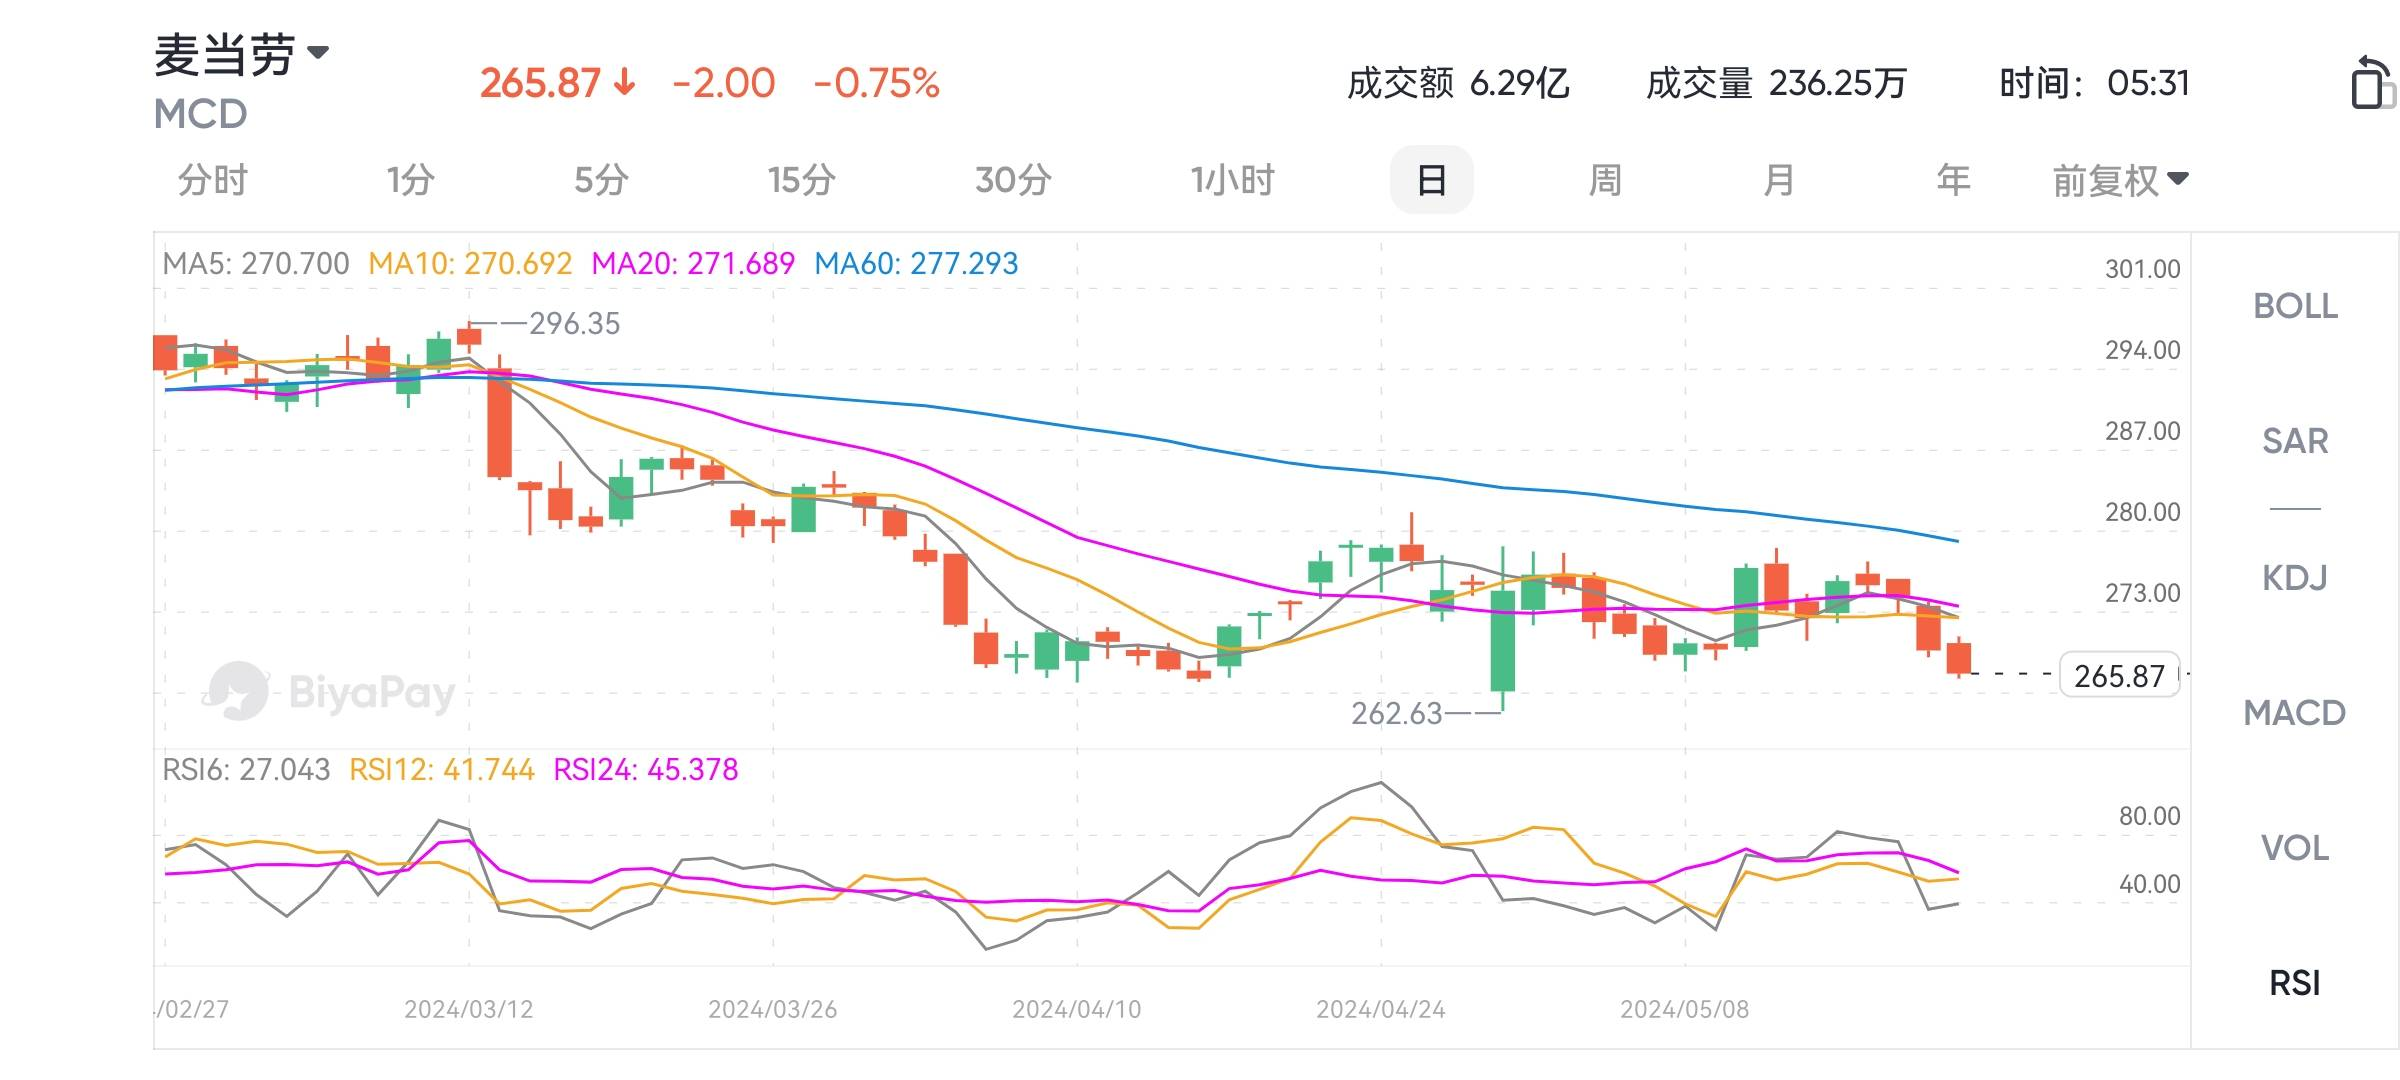
Next, we will conduct a detailed analysis from the following aspects to provide reference.
Restaurant growth
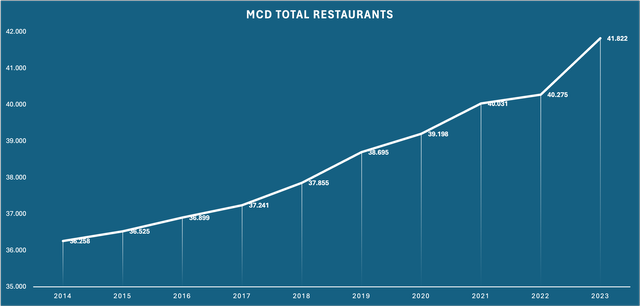
The chart looks better than the actual situation. Here we can see that the number of McDonald’s restaurants has increased from 36,258 in 2014 to 41,822 in 2023. The compound annual growth rate in the past decade is only 1.6%.
However, the reason for this situation is that McDonald’s changed its restaurant distribution method from “company operation” to “concession” during this period. Here is another chart showing the percentage of concession restaurants.
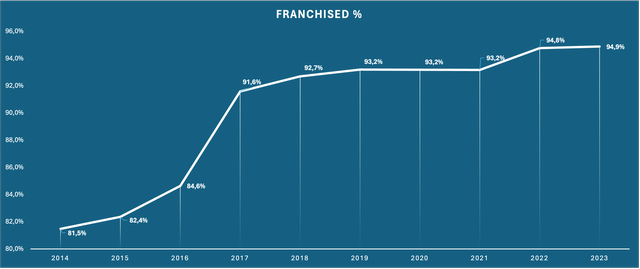
McDonald’s is steadily moving forward with the concession ratio from self-operated restaurants to a higher proportion of restaurants, a decision that has a significant financial impact.
The key point here is that the transition to concession restaurants seems to have ended. As of now, 95% of restaurants are concession, and the growth rate of concession restaurants will become more important in the future. Here is another chart showing the year-on-year growth rate of McDonald’s concession restaurants.
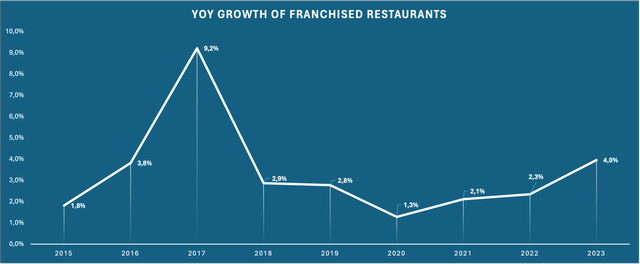
Here we can see that McDonald’s concession restaurants are growing at a rate of 3% per year (10-year compound annual growth rate of 3.33%, but slightly deviated due to the significant increase in 2017).
On December 6, 2023, McDonald’s announced new goals for the next few years. The announcement includes a new target of 4-5% annual growth in long-term restaurant units after 2024. This is much higher than the 1.6% restaurant growth rate we have seen in the past decade, but in this case, it seems achievable. The growth of restaurant units in the past decade has been hindered because McDonald’s focused on restructuring from self-operated restaurants to concession restaurants. But now that the restructuring is nearing completion, McDonald’s can focus on expanding its footprint by opening new restaurants, which will drive company performance growth and expand the company’s scale. However, there are still some negative factors here, that is, due to the increase in franchise fees in 2024, concessionaires may hesitate to expand. Whether this is the case remains to be seen.
Profitability indicator
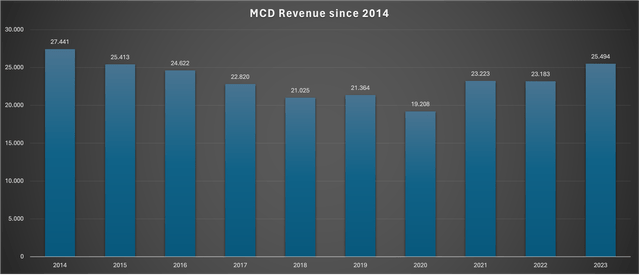
The above chart shows McDonald’s revenue over the past decade. The data in this chart is obviously disappointing. The problem here is that McDonald’s restructuring to more concession restaurants has led to a decrease in sales because the restaurants operated by the company contribute all sales to revenue, while concession restaurants only contribute royalties and rent.
Due to the much better margins at concession restaurants, McDonald’s consolidated operating margin has grown substantially over the past decade:
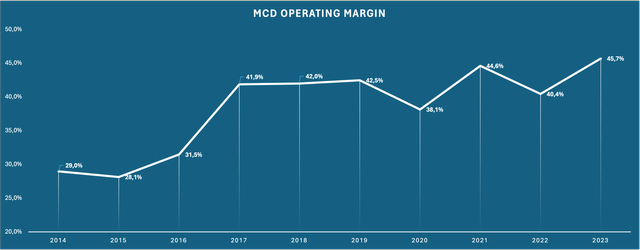
Due to the fact that 95% of the existing restaurants are concessions, the upward space for further expanding profit margins in the future should be limited. However, McDonald’s announced again in its December 2023 announcement that it expects operating profit margins to continue to grow, but did not provide a specific range.
In the author’s opinion, the most important indicator in the future will be the total sales of the entire system. This indicator has been reported for a long time, but due to the restructuring process of concession restaurants, this indicator is not very useful. As there are few restaurants left in the company’s operation, the total sales of the entire system, which is the main driving force for rent and franchise fees, will become the main reporting indicator in the next few years. The following figure shows the total sales growth rate of the entire system over the past decade.
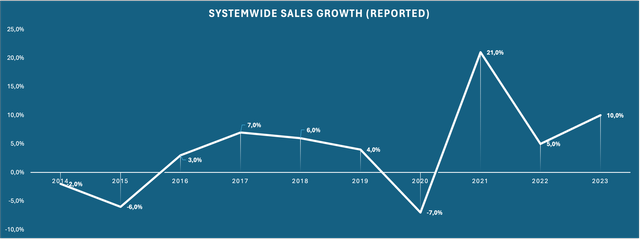
Here we can see that, except for struggling in 2014, 2015, and 2020, the sales of the entire system have been growing in the low to mid-single digits. From 2014 to 2023, the compound annual growth rate of the entire system’s sales is 4.42%. If we exclude the impact of the 1.6% compound annual growth rate of restaurants, the organic compound annual growth rate should be around 2.8%, which represents the impact of pricing minus the decrease in the number of guests.
Finally, the chart below shows operating income, net income (all US GAAP data), and free cash flow (FCF) since 2014:
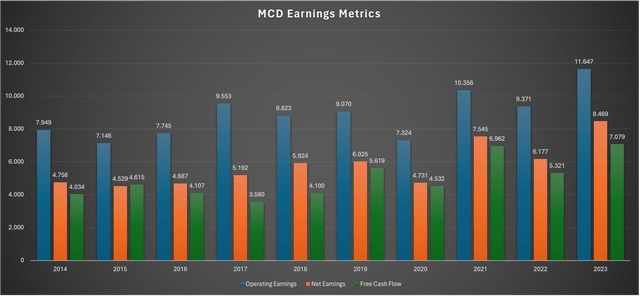
Here, we can see that operating and net income have been steadily increasing, with a compound annual growth rate of 4.34% for operating and 6.62% for net income. Although not as fast, it is improving.
Quarter 1 Results
Following a brief look at the 24th quarter results announced on April 30, 2024, here’s a quick overview of year-over-year performance:
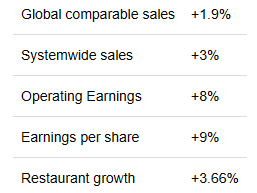
We can see that due to the continuous expansion of profit margins, the growth rate of operating profit is faster than the growth rate of sales, and the growth rate of earnings per share is even faster due to continuous stock repurchases.
Although the restaurant grew by 3.66%, the sales of the entire system only increased by 3%. This may seem strange at first glance, but it can be explained by the following facts: the sales generated by newly opened restaurants are much lower than those of restaurants that have been in operation for several years. Comparable sales refer to the year-on-year sales growth of restaurants that have already opened. With the global comparable sales growth of 1.9%, new restaurants will push the remaining 1.1% growth to the sales of the entire system.
Overall, the report looks more disappointing than encouraging, and the stock has been flat since its release. Restaurant growth and global comparable sales growth are below the company’s announced targets of 4-5% and 2.5%, respectively. It should be monitored whether MCD can achieve these goals in the coming quarters.
Valuation
As of the end of Quarter 1 in 2024, the number of outstanding shares was 725,900,000 million shares. McDonald’s stock is currently trading at $272.38 per share, with a current market value of $197.7 billion. The net profit in the past 12 months was $8.596 billion, so McDonald’s current trading price is exactly 23 times the Price-To-Earnings Ratio.
In a normal year, McDonald’s should be able to convert 86% of its Net Profit into free cash flow, which is $7.392 billion. This means that McDonald’s is currently trading at 26.7 times standardized free cash flow, which is a free cash flow yield of 3.74%.
This is where improving the payment rate comes into play. The free cash flow yield shows how much cash McDonald’s can pay us when it pays 100% free cash flow. Based on this, it can be concluded that McDonald’s may pay 125% free cash flow. This will make the actual free cash flow yield reach 3.74% x 125% = 4.67%, which looks more attractive.
The long-term return of any stock should be: (a) the sum of the free cash flow rate of return or the amount the company can pay us; (b) the sum of the growth rate of free cash flow. For McDonald’s, (b) is the sum of restaurant and comparable sales growth. Assuming McDonald’s should be able to grow restaurants at their guided rate of 4-5% and increase comparable sales at a rate of 2.5%, this will bring the growth rate to 7%.
Therefore, to sum up, we may see a pre-tax total return rate of about 7% + 4.67% = 11.67%, which is a good prospect for defensive Blue Chips like McDonald’s. If investors also have confidence in this company and want to enter the market, they may wish to monitor the stock price regularly at traditional brokers such as Interactive Brokers, Schwab, and Tiger, or at the new multi-asset trading wallet BiyaPay, and buy or sell stocks at the appropriate time. Among them, BiyaPay can not only recharge usdt to trade US and Hong Kong stocks, but also recharge usdt to withdraw US dollars and Hong Kong dollars to bank accounts, and then withdraw fiat currency to other securities for investment.
Here we supplement the discounted cash flow (DCF) valuation to determine whether we will face tailwinds or headwinds in terms of valuation. Assuming $12.73 per share as the starting free cash flow, with a growth rate of 7% over the next 10 years, permanent growth rate of 4%, and a Universal Discount Rates of 10%. Here are the results:
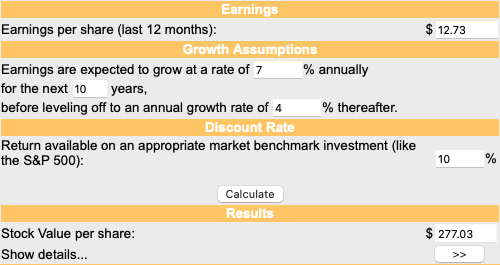
According to the table, McDonald’s valuation is very close to fair value, and fair value may be $277 per share.
Risk
Due to McDonald’s being a low-volatility Blue Chips, the risk is naturally lower. McDonald’s expects future comparable sales to only grow by 2.5%, consistent with GDP growth, which may mean flat customer numbers and price increases consistent with inflation.
The only major risk is the expansion target of the new restaurant. McDonald’s expects the annual growth rate of future restaurants to be 4-5%, which is much higher than the historical growth rate of restaurants. McDonald’s has decided to increase the franchise fee for new restaurants by 25%, effective from 2024, while setting higher restaurant expansion targets. However, as of now, 95% of McDonald’s restaurants are operated by concessionaires. This means that the decision-making power of restaurant expansion is not only in the hands of McDonald’s. If concessionaires decide not to expand their operations because the new franchise fee cannot be profitable, McDonald’s will encounter problems in achieving its optimistic restaurant growth target.
Overall, the main issue to watch is whether McDonald’s can achieve its optimistic restaurant growth plan.
Conclusion
McDonald’s stock price has experienced a difficult period in the past year, as shown in the following chart.
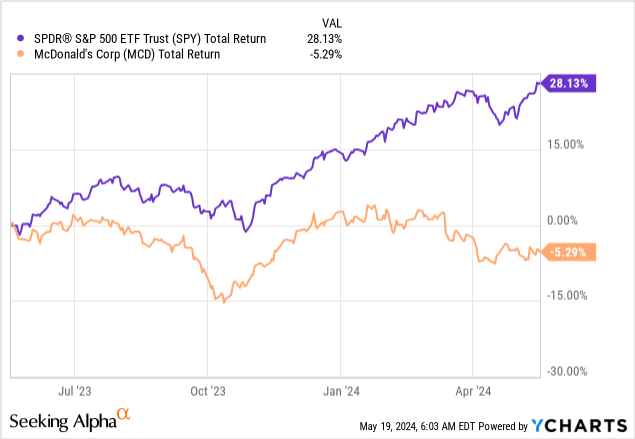
McDonald’s performance has significantly lagged behind the market index. Meanwhile, earnings per share in fiscal year 2023 increased by 39% compared to fiscal year 2022. Therefore, the valuation multiple has dropped from 31.6 times Price-To-Earnings Ratio at the end of fiscal year 2022 to 25.6 times at the end of fiscal year 2023, and now to 23 times Price-To-Earnings Ratio. The last time we saw such a valuation level (based on year-end) was in 2018, when the entire stock market fell sharply.
The new restaurant growth target is very optimistic, but concerns about its feasibility remain.
DCF valuation shows that when using management’s future growth expectations and reasonable permanent growth expectations, McDonald’s is very close to fair valuation. However, meeting these expectations, coupled with continuously increasing dividend payout ratios while maintaining leverage, is expected to result in a total future return of around 11.5%. This leaves a small margin of safety, but for non-volatile Blue Chips like McDonald’s, this is already good.
In short, McDonald’s is worth considering as an investment, but for investors, the main issue to focus on in the coming quarters or even years is whether McDonald’s can achieve the optimistic restaurant growth target set when it was announced in December 2023.
Source: Seeking Alpha
Editor: BiyaPay Finance


