
- Remittance
- Exchange Rate
- Stock
- Events
- EasyCard
- More
- Download
- Creator


Preserving Value with Common Stocks, Making Profits with Options: Advanced Practical Strategies for

Published on 2024-12-04 Updated on
2024-12-04


Some people say that if US stocks are a good investment choice, then options are the real money-making weapon! However, compared with stocks, options have higher leverage. If one simply uses options based on price rises and falls, they will suffer a heavy loss in this market. Therefore, the entry and exit points in option trading are very important. For this reason, this article will introduce a simple SPY option trading strategy for beginners, by combining the use of two indicators, “OptionsMillionaire SPY Moving Averages and Signals” and “Camerilla pivot points”, to identify trading opportunities and ensure your option investment returns.
Strategy Introduction
Many US stock traders often hold common stocks while using options to earn more profits. Because they understand that the profits from stocks come from the long-term growth dividends of excellent companies, while if one wants to make money in the short term, they need to rely on option trading. For example, when a common stock rises by 1%, some option contracts may rise by 100% or even higher! Of course, there is no such thing as a free lunch. The risks of option trading are also higher, and this risk does not come from the options themselves but more from the investors’ knowledge reserves and trading skills.
This article takes the options of SPY (S&P 500 Index ETF) as the main target, and the selected option trading strategy is “OptionsMillionaire SPY Moving Averages and Signals” and “Camerilla pivot points”.
1.1 OptionsMillionaire SPY Moving Averages and Signals
OptionsMillionaire SPY Moving Averages and Signals, which can be translated as the SPY Moving Averages and Signals of Option Millionaires, can also be literally understood as an indicator used by those who become millionaires through option trading.
This SPY option indicator is a specialized trading tool designed to simplify the decision-making process of SPY (Standard & Poor’s 500 ETF) option trading. It integrates multiple technical indicators and simplifies the process of identifying buy and sell opportunities. The indicator uses a combination of key moving averages, momentum oscillator indicators, and price action rules to provide clear entry and exit signals for option traders.
1.2 Camerilla pivot points
If you have done intraday trading, you will know that sometimes the market can bring us more profits in a single trade, but we forget to check the trading conditions because we are too confident about the previous trade and then conduct the next trade, resulting in losses. I have tried many strategies, some worked, but many failed. Later, after encountering Camarilla pivot points, this situation has been greatly improved. Simply put, Camarilla pivot points are a set of support and resistance points that can help you understand potential breakouts and reversals. It is calculated based on the previous day’s highest price, lowest price, and closing price.
Indicator Configuration
2.1 Setting up these indicators in TradingView
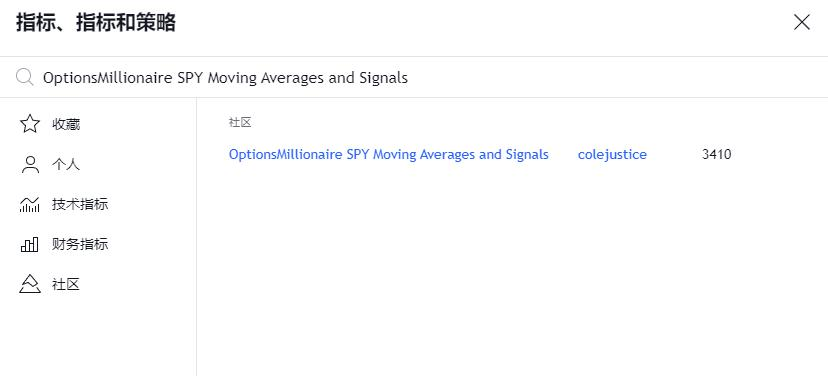
Enter TradingView, click on the “Indicators” tab, search for “OptionsMillionaire SPY Moving Averages and Signals” and add it to the chart.
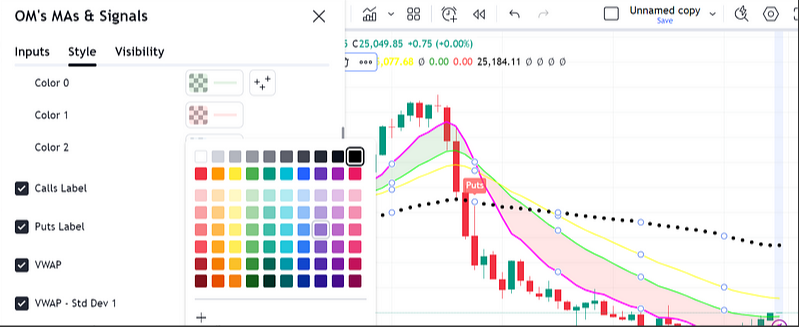
Change the settings:
The black dot is the VWAP line, and change the thickness of VWAP to high for easy understanding.
VWAP (Volume Weighted Average Price) is a commonly used technical indicator for calculating the weighted average price within a specific time period. It takes into account the trading volume at each price point, that is, the product of price and volume, to more accurately reflect the market’s trading activities.
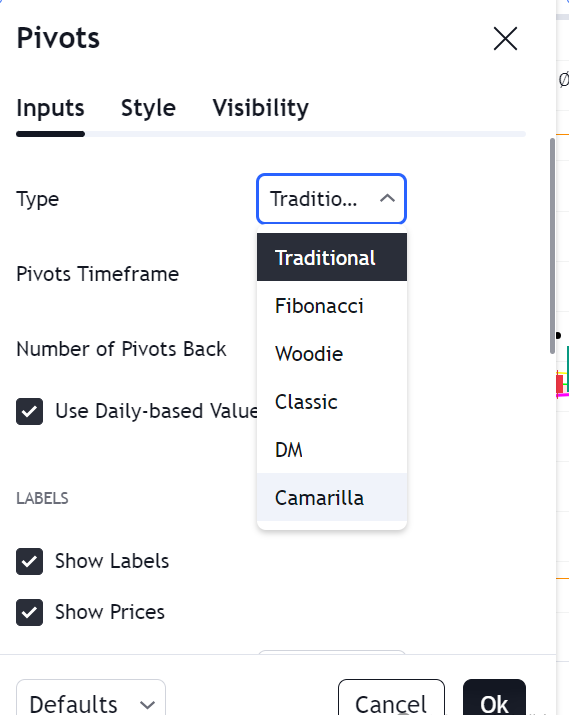
Search for “Pivot Point Standard” and apply it to the chart. Change it to Camarilla.
Pivot Point is a commonly used technical analysis tool widely used in intraday trading to determine the potential support and resistance levels of the market. The calculation of the standard pivot point is based on the previous day’s highest price, lowest price, and closing price and helps traders identify price reversal or breakout points.
The main purpose of the pivot point standard is to help traders identify the key price levels of the market on the day and facilitate the judgment of possible price reversals or breakouts. If the price breaks through the pivot point or support/resistance level, it is usually regarded as a strong signal of the market trend.
Camarilla pivot points have higher precision than standard pivot points and are especially suitable for short-term traders and operations in more volatile markets. By refining more support and resistance levels, traders can identify potential price reversal points within a smaller time frame and help formulate more precise trading decisions.
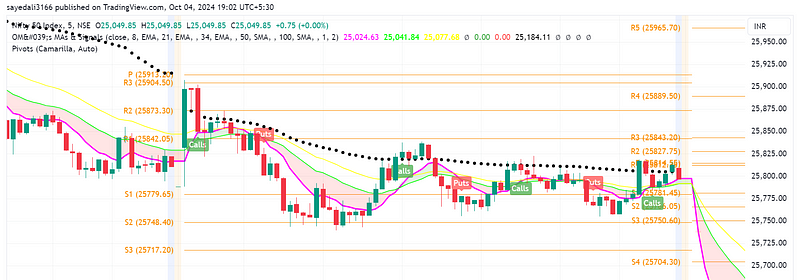
After applying these two indicators, your chart will look like the following.
Strategy Application
EMA (Exponential Moving Average) is a common technical analysis indicator used to smooth price fluctuations and help traders identify market trends. Unlike the Simple Moving Average (SMA), EMA gives more weight to the most recent data points and is therefore more sensitive to the latest price changes.
Moving Averages for Trend Identification
When the 8 EMA crosses above the 21 EMA, it indicates a bullish trend and is usually a good opportunity to buy call options.
Conversely, when the 8 EMA crosses below the 21 EMA, it shows a bearish trend and is favorable for put options.
The 100 and 200 SMA are dynamic support and resistance levels that help identify key areas of potential reversals or trend continuations.
MACD and RSI for Momentum Confirmation
MACD (Moving Average Convergence Divergence) is used to confirm the strength of the trend and ensure that traders trade in the direction of market momentum.
RSI (Relative Strength Index) helps identify overbought or oversold conditions and gives early warnings of possible trend reversals or pullbacks.
Squeeze Momentum Indicator
This tool shows high-potential volatility periods where price movements may break out. It can help traders identify setups with a high reward-risk ratio during market contraction and expansion periods.
3.4 Hull Moving Average (HMA) for Confidence
HMA (Hull Moving Average (HMA) for Confidence) adds another layer of confirmation and gives signals by color coding according to whether the candle closing price is above or below the HMA line. Although it is not a direct trading entry tool, it can provide additional confidence when entering or exiting a trade.
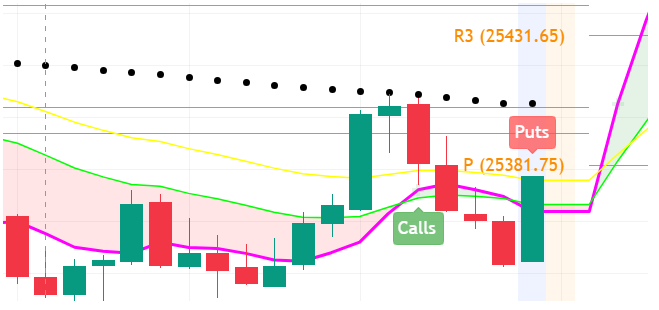
3.5 Bullish Setup
The bullish green candle should cross and close above the VWAP and EMA ribbon, and a bullish signal appears, then go long.
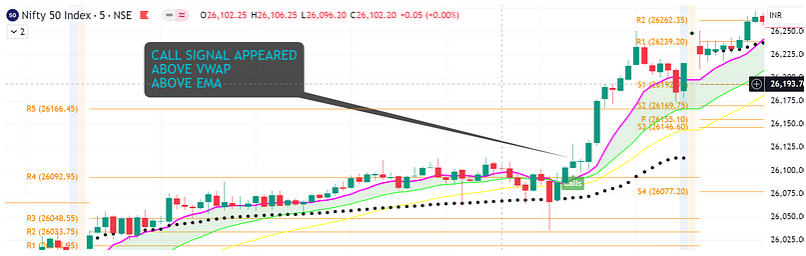
Avoid call signals below VWAP.
And the target will be the next resistance level.
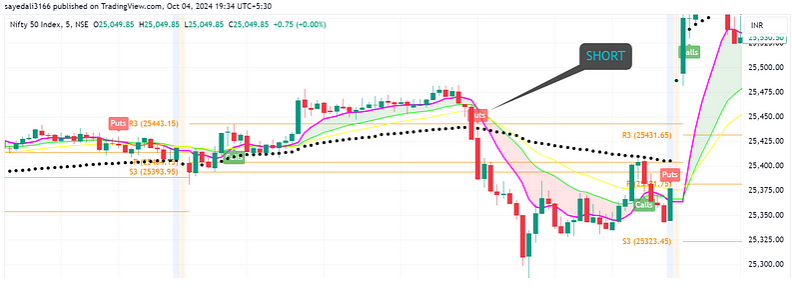
3.6 Bearish Setup
The bearish red candle should cross and close below the VWAP and EMA ribbon, and a bearish signal appears, then go short. And avoid PUT signals above VWAP.
3.7 Rules to Follow When Using This Strategy
Never trade against the trend. When the market is green, look for buying call options; when the market is red, look for buying put options. However, if there is a significant change in the overall trend, you can buy put options when the market is green or call options when the market is red.
Indicator Confirmation. Always wait for the confirmation of multiple indicators before entering a trade.
Don’t Force a Trade. If there is no trading setup, don’t force it. Sometimes, the best trade is not to trade.
Don’t Hold Overnight. In the current market environment, avoid holding positions overnight.
Patience Pays Off. Whether it is a few minutes or a few seconds, good setups will appear. It is better to wait for the right time than to rush into a trade.
Summary of Views
No strategy can ensure 100% accuracy, and never rely on a single indicator. Always remember strict stop-loss discipline. If you learn price action and combine it with technical indicators, you can achieve relatively stable accuracy in intraday trading.
Traders should rely on technical analysis and indicator confirmation to make trading decisions rather than intuition.
When conducting option trading, combining multiple technical indicators can improve trading accuracy and confidence.
Although no strategy can guarantee 100% accuracy, by learning price action and combining technical indicators, traders can achieve stable accuracy in intraday trading.
Traders should follow certain trading rules, such as not trading against the trend, strictly controlling stop-loss, not holding positions overnight, etc., to reduce trading risks.
Traders should be flexible with the market environment and adjust trading strategies according to the actual situation of the market.
Traders should choose a compliant US stock trading platform when choosing a trading platform, such as Interactive Brokers, Charles Schwab, Tiger Brokers, BiyaPay, etc. Wish you all a smooth investment.

BiyaPay makes crypto more popular!
Contact Us
About
Product
Support
Service
Rate calculator
Telegram:
https://t.me/biyapay001
BiyaPay APP
Telegram community:
https://t.me/biyapay_ch
Telegram digital currency community:
https://t.me/BiyaPay666
Community


Sign In
Sign Up
Sign In
Sign Up
Regulation Subject
BIYA GLOBAL LLC is a broker-dealer registered with the U.S. Securities and Exchange Commission (SEC) (No.: 802-127417), member of the Financial Industry Regulatory Authority (FINRA) (CRD: 325027), member of the Securities Investor Protection Corporation (SIPC), and regulated by FINRA and SEC.
BIYA GLOBAL LLC registered with the US Financial Crimes Enforcement Network (FinCEN), as a Money Services Business (MSB), registration number: 31000218637349, and regulated by FinCEN.
BIYA GLOBAL LIMITED registered as Financial Service Provider (FSP number: FSP1007221) in New Zealand, and is a member of the Financial Dispute Resolution Scheme, a New Zealand independent dispute resolution service provider.
©2019 - 2025 BIYA GLOBAL LIMITED
Terms of service Privacy Policy