
- Remittance
- Exchange Rate
- Stock
- Events
- EasyCard
- More
- Download


How to judge the high and low points of the stock market? How to avoid losing money in the bull mark

Published on 2024-11-20 Updated on
2024-11-20


The bull market in the US stock market started at the end of March 2020. Specifically, on March 23, 2020, the Dow Jones Index, S & P 500 Index, and Nasdaq Composite Index hit bottom after experiencing a significant decline caused by the COVID-19 pandemic, began to rebound, and entered the bull market phase.
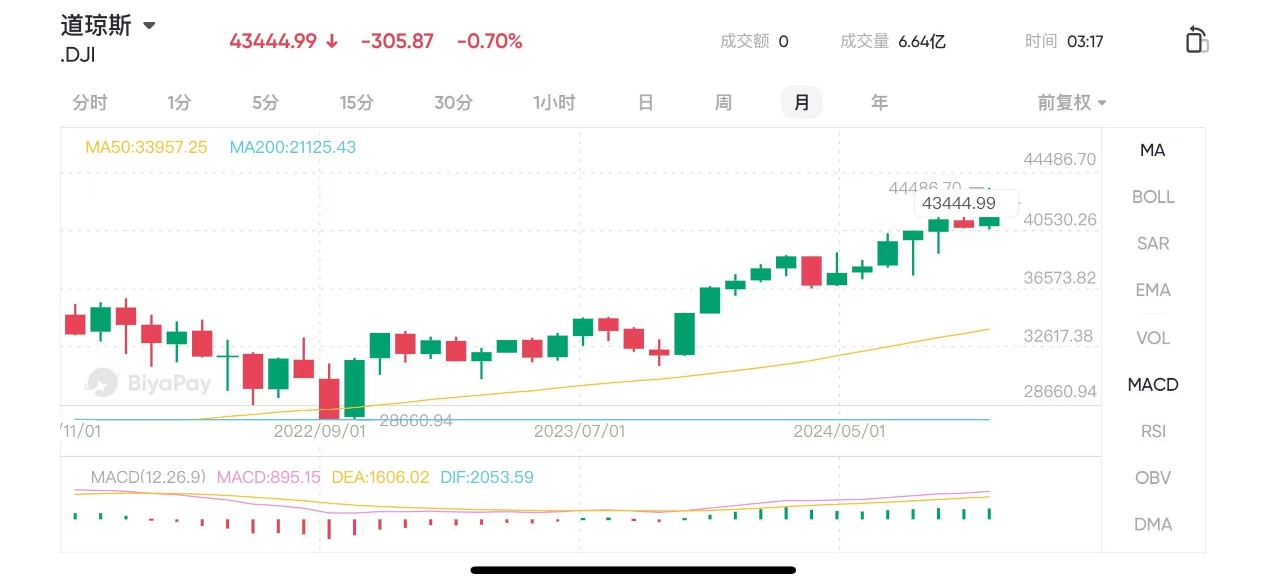
Today we are not going to interpret policies or short-term stock predictions, we will talk about how to judge whether the stock market is high or low , this is the real stuff that will benefit you for life.
First of all, I want to say a somewhat counterintuitive fact. When it comes to investing, entering the bull market is more likely to result in losses. Many people hear that “when the bull market comes, even fools can make money” and then enter excitedly, only to end up losing a lot of money and feeling worse than fools themselves. It may seem counterintuitive, but it actually fits human nature. People who have just entered the market are generally cautious and may buy a stock worth 10,000 to 20,000 yuan to test the waters. Because the bull market has been rising, it is normal to make a profit of 30% -50%. Then they feel that they are too smart and powerful, like a chosen stock trader. They quickly invest their savings of tens of thousands, hundreds of thousands, or even more. Little do they know that this is usually the tail of the bull market. Most of your money is invested at the highest point, how can you not lose money?
The reason sounds simple, but many people lose money on this simple logic. So how can we avoid the curse of losing money in the bull market? In fact, a careful analysis reveals that the core reason for losing money in the bull market is buying at a high level, commonly known as buying at a high level. So you must be thinking that if we can judge when it is a high level, can we avoid it? The idea is clear, yes, this is the key. No one can judge the absolute high and low points of the stock market, but there are some methods to roughly judge the relative high and low positions. Learning these methods may not guarantee making big money, but at least it can greatly reduce the probability of being exploited.
Price-To-Earnings Ratio Method to Determine Stock Price
Let’s take a look at how to judge by Price-To-Earnings Ratio. Friends who know Price-To-Earnings Ratio don’t need to hurry to quit. Knowing the noun explanation and being able to understand and apply it are two different things.
Considering the different audience bases, we will gradually analyze from shallow to deep. Most people should have heard of a basic economic law - prices always fluctuate around value.
This rule is universal in the economic field. Specifically, in the stock market, the stock price and market value of a Listed Company are a kind of price.
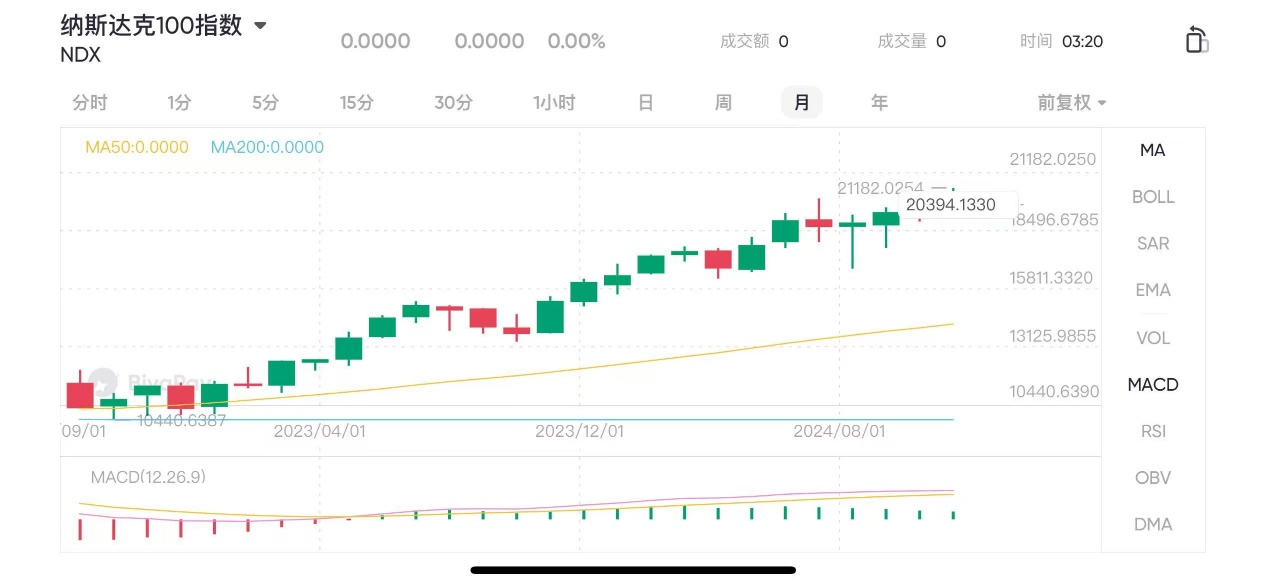
So what is value? In the long run, the most crucial factor affecting stock prices is the company’s profits. The more money a company earns each year, the higher its value. This is a simple truth that should be understandable to everyone. Therefore, we can use company profits to represent value. An index like NASDAQ100 is essentially a collection of 100 constituent stocks. For an index, the index point is its price; the total profit of a constituent stock is the value of the index.
The economy is constantly growing, and corporate profits are constantly increasing. Therefore, the price value law of the stock market should have an upward tilt over time. This is also why it was mentioned earlier that the high point of each index is generally higher than the previous high point. Here, let’s first take a look at the situation of the long-standing US stock market. If we take the profit index of the S & P 500 as the value, the green line in the figure, this profit index is calculated based on the profit growth rate of 500 Constituent Stocks over the years. You only need to know that it can reflect the profit situation of Constituent Stocks, and then take the S & P 500 index point as the price. Put the two curves in one figure to get such a graph.
Looking at the past 50 years, the S & P 500 index has sometimes been above or below the profit index. While the overall trend is consistent, the index fluctuates around profits. After each deviation, there is a driving force for prices to return to value. The greater the deviation, the stronger the driving force for return. It can be clearly seen that at the end of June 2024, there was a significant upward deviation in prices compared to value, which naturally led to a downward driving force for value. This is the main logic we use to indicate the risk of US stocks.
Capital Markets has a mature indicator system to reflect the high and low market positions, which is more objective and quantitative. The most commonly used one is Price-To-Earnings Ratio, abbreviated as PE. I will often abbreviate it as PE later. The Price-To-Earnings Ratio for stocks is the market value of Listed Companies/one year’s Net Profit, and the Price-To-Earnings Ratio for indices is the sum of the market value of constituent stocks/the sum of the one-year Net Profit of constituent stocks. In this chart, the Price-To-Earnings Ratio is understood as the price/value line, which can quantitatively measure whether the relative value of prices has deviated upward or downward, and the degree of deviation.
From the perspective of investors, Price-To-Earnings Ratio can be roughly understood as the break-even period. For example, if a restaurant can earn 100,000 a year, you 300,000 buy it, then the Price-To-Earnings Ratio of the restaurant is 300,000 market value/100,000 profit = 3 times Price-To-Earnings Ratio, which means that you can break even in 3 years. For example, if the market price of a house is 1 million, if you buy it and rent it out for 20,000 yuan per year, then the house is 50 times Price-To-Earnings Ratio, which represents 50 years to break even. However, in the real estate field, this Price-To-Earnings Ratio is called the “sale-to-rent ratio”.
There are three other important data points: median, danger value, and opportunity value.
The median Price-To-Earnings Ratio refers to the value in the middle of the Price-To-Earnings Ratio of all stocks in the market. Looking at historical statistics, the median P/E ratio of US stocks is between 15 and 20 times. Specifically, in the past few decades, the median Price-To-Earnings Ratio of the S & P 500 Index has been about 16 to 17 times . If it is lower than this value, we can consider the Price-To-Earnings Ratio to be relatively low, that is, relatively cheap, and vice versa.
The “danger value” of Price-To-Earnings Ratio refers to the market’s Price-To-Earnings Ratio being too high, implying that the stock market may be overvalued, investment risks are high, and the possibility of a stock market correction is increased. When the Price-To-Earnings Ratio of the S & P 500 Index exceeds 20 to 25 times, it is usually considered overvalued and belongs to the “danger zone”. If the Price-To-Earnings Ratio exceeds 25 times or higher, the market valuation is usually considered to have entered the “bubble zone”, and the risk of stock market decline increases. When we invest, we should try to sell above this danger value. For example, during the dot-com bubble in 1999 and 2000, the Price-To-Earnings Ratio of the S & P 500 Index was close to 30 times or higher , and the market was widely considered to be in a bubble state, and the subsequent stock market crash confirmed this.
The “opportunity value” of Price-To-Earnings Ratio refers to a low Price-To-Earnings Ratio in the market, indicating that stocks may be undervalued and investors have the opportunity to buy stocks at lower prices, waiting for the market value to rebound. According to historical data, when the Price-To-Earnings Ratio of the S & P 500 Index is below 10 to 12 times, the market is usually considered undervalued and in the “opportunity zone”. In this case, investors may find more value stocks and potential return opportunities. For example, in the 1980s and after the 2008 financial crisis, the Price-To-Earnings Ratio of the Standard & Poor 500 fell to around 10 times, and the market entered the undervalued area. The subsequent rebound brought rich returns.
Defects of Price-To-Earnings Ratio Judgment Method
The above content can be considered as popular science, which helps you break away from the understanding of novices. The following content is about advanced fields, and fund managers also use these methods. The historical Price-To-Earnings Ratio method provides us with a method to judge the market position, which is very important and can be said to be the most important in stock fund investment. However, this method is not omnipotent and still has two serious shortcomings.
The first drawback of the historical Price-To-Earnings Ratio is that it does not consider the growth rate of profits, only static profits. Earlier, I said that Price-To-Earnings Ratio can be loosely understood as the break-even period. In the example of the restaurant mentioned earlier, the annual 100,000 profit is 3 times the Price-To-Earnings Ratio 300,000 bought, and the break-even period is 3 years. However, this example has a strong assumption that the 100,000 profit remains unchanged every year, while the real situation is that this profit is likely to change, and it may grow or decline.
The second disadvantage of the historical Price-To-Earnings Ratio method is that it does not take into account the risk-free rate of return. Everyone who makes an investment is making a choice.For example, if you have 500,000 yuan in your hand now, we can buy stocks or funds, national bonds, bank deposits, houses, gold, and even more fancy things like Bitcoin, antique calligraphy and paintings. Different investment varieties have different yields and risks. In China, we can consider buying national bonds as risk-free. As long as the country is still there, the money can definitely be returned to you with interest. Generally, we consider the 10-year national bond interest rate as a risk-free rate. If I buy the CSI 300 index fund, the risk I bear is definitely much greater than buying national bonds. We bear higher risks, and theoretically, I must have a higher yield before I will buy it. So there is the concept of Risk Premium, where Risk Premium = 1/PE - 10-year government bond yield, PE is market value/Net Profit, and 1/PE is Net Profit/market value.
Earlier, we talked about the rent-to-sale ratio in real estate, which is Price-To-Earnings Ratio. There is also an indicator in the house, which is the rental return rate, which is the annual rent/house price, and 1/PE is a similar concept to represent the return rate of stocks. Then, using this return rate - the 10-year national bond interest rate is the Risk Premium of stocks. The so-called Risk Premium is the rate of return compensation I receive for bearing risks. For example, if a company’s market value is 10 billion and its profit is 1 billion a year, then the stock return rate is 10%. Assuming the 10-year national bond yield is 2%, then the Risk Premium is 8%. The higher the Risk Premium, the higher the return compensation I receive for taking risks, which means the lower the stock market position, the cheaper the stock price. It should be emphasized that 1/PE is not the true stock return rate. We are only constructing such an objective indicator to reflect and judge the relative high and low of the stock market.
To achieve substantial returns in the field of US stock investment, it is ultimately necessary to test the theory through trading. When choosing an investment platform, compliance and fund security, transaction costs, coverage of investable varieties, platform usability, and User Experience can be measured. For example, Futu Securities, Tiger Securities, BiyaPay, etc. can all trade US and Hong Kong stocks. The platform is compliant, the fund security is guaranteed, and the deposit and withdrawal cards are not frozen, solving the pain points of many investors when investing in US and Hong Kong stocks.

BiyaPay makes crypto more popular!
Contact Us
Company and Team
BiyaPay Products
Customer Services
Resources
Telegram digital currency community:
https://t.me/BiyaPay666
Community


Sign In
Sign Up
Sign In
Sign Up
Regulation Subject
BIYA GLOBAL LIMITED registered as Financial Service Provider (FSP number: FSP1007221) in New Zealand, and is a member of the Financial Dispute Resolution Scheme, a New Zealand independent dispute resolution service provider.
BIYA GLOBAL LLC registered with the US Financial Crimes Enforcement Network (FinCEN), as a Money Services Business (MSB), registration number: 31000274115551, and regulated by FinCEN.
BIYA GLOBAL LLC To enhance investor protection, BIYA GLOBAL LLC is expediting its Broker-Dealer license application process in full compliance with U.S. SEC and relevant regulatory requirements.
©2019 - 2025 BIYA GLOBAL LIMITED