
- Remittance
- Exchange Rate
- Stock
- Events
- EasyCard
- More
- Download


Bitcoin breaks through 69000, maybe the bull market is really here, can you go all in? Just 2 steps,

Published on 2024-10-23 Updated on
2024-11-04


In the vast universe of Financial Marekt, Bitcoin has always been a brilliant and mysterious star, attracting the attention of countless investors. Recently, the trend of Bitcoin’s market has been particularly noteworthy. After fluctuating over the weekend, BTC closed at the high point of 69519 early this morning, and ETH also slightly boosted the market’s rebound trend. However, in such a market, investors must not blindly chase short-term trends, because in the highly probable main uptrend, paying too much attention to short-term trends can easily lead to losing sight of the big picture and falling into the dilemma of “selling for profit”.
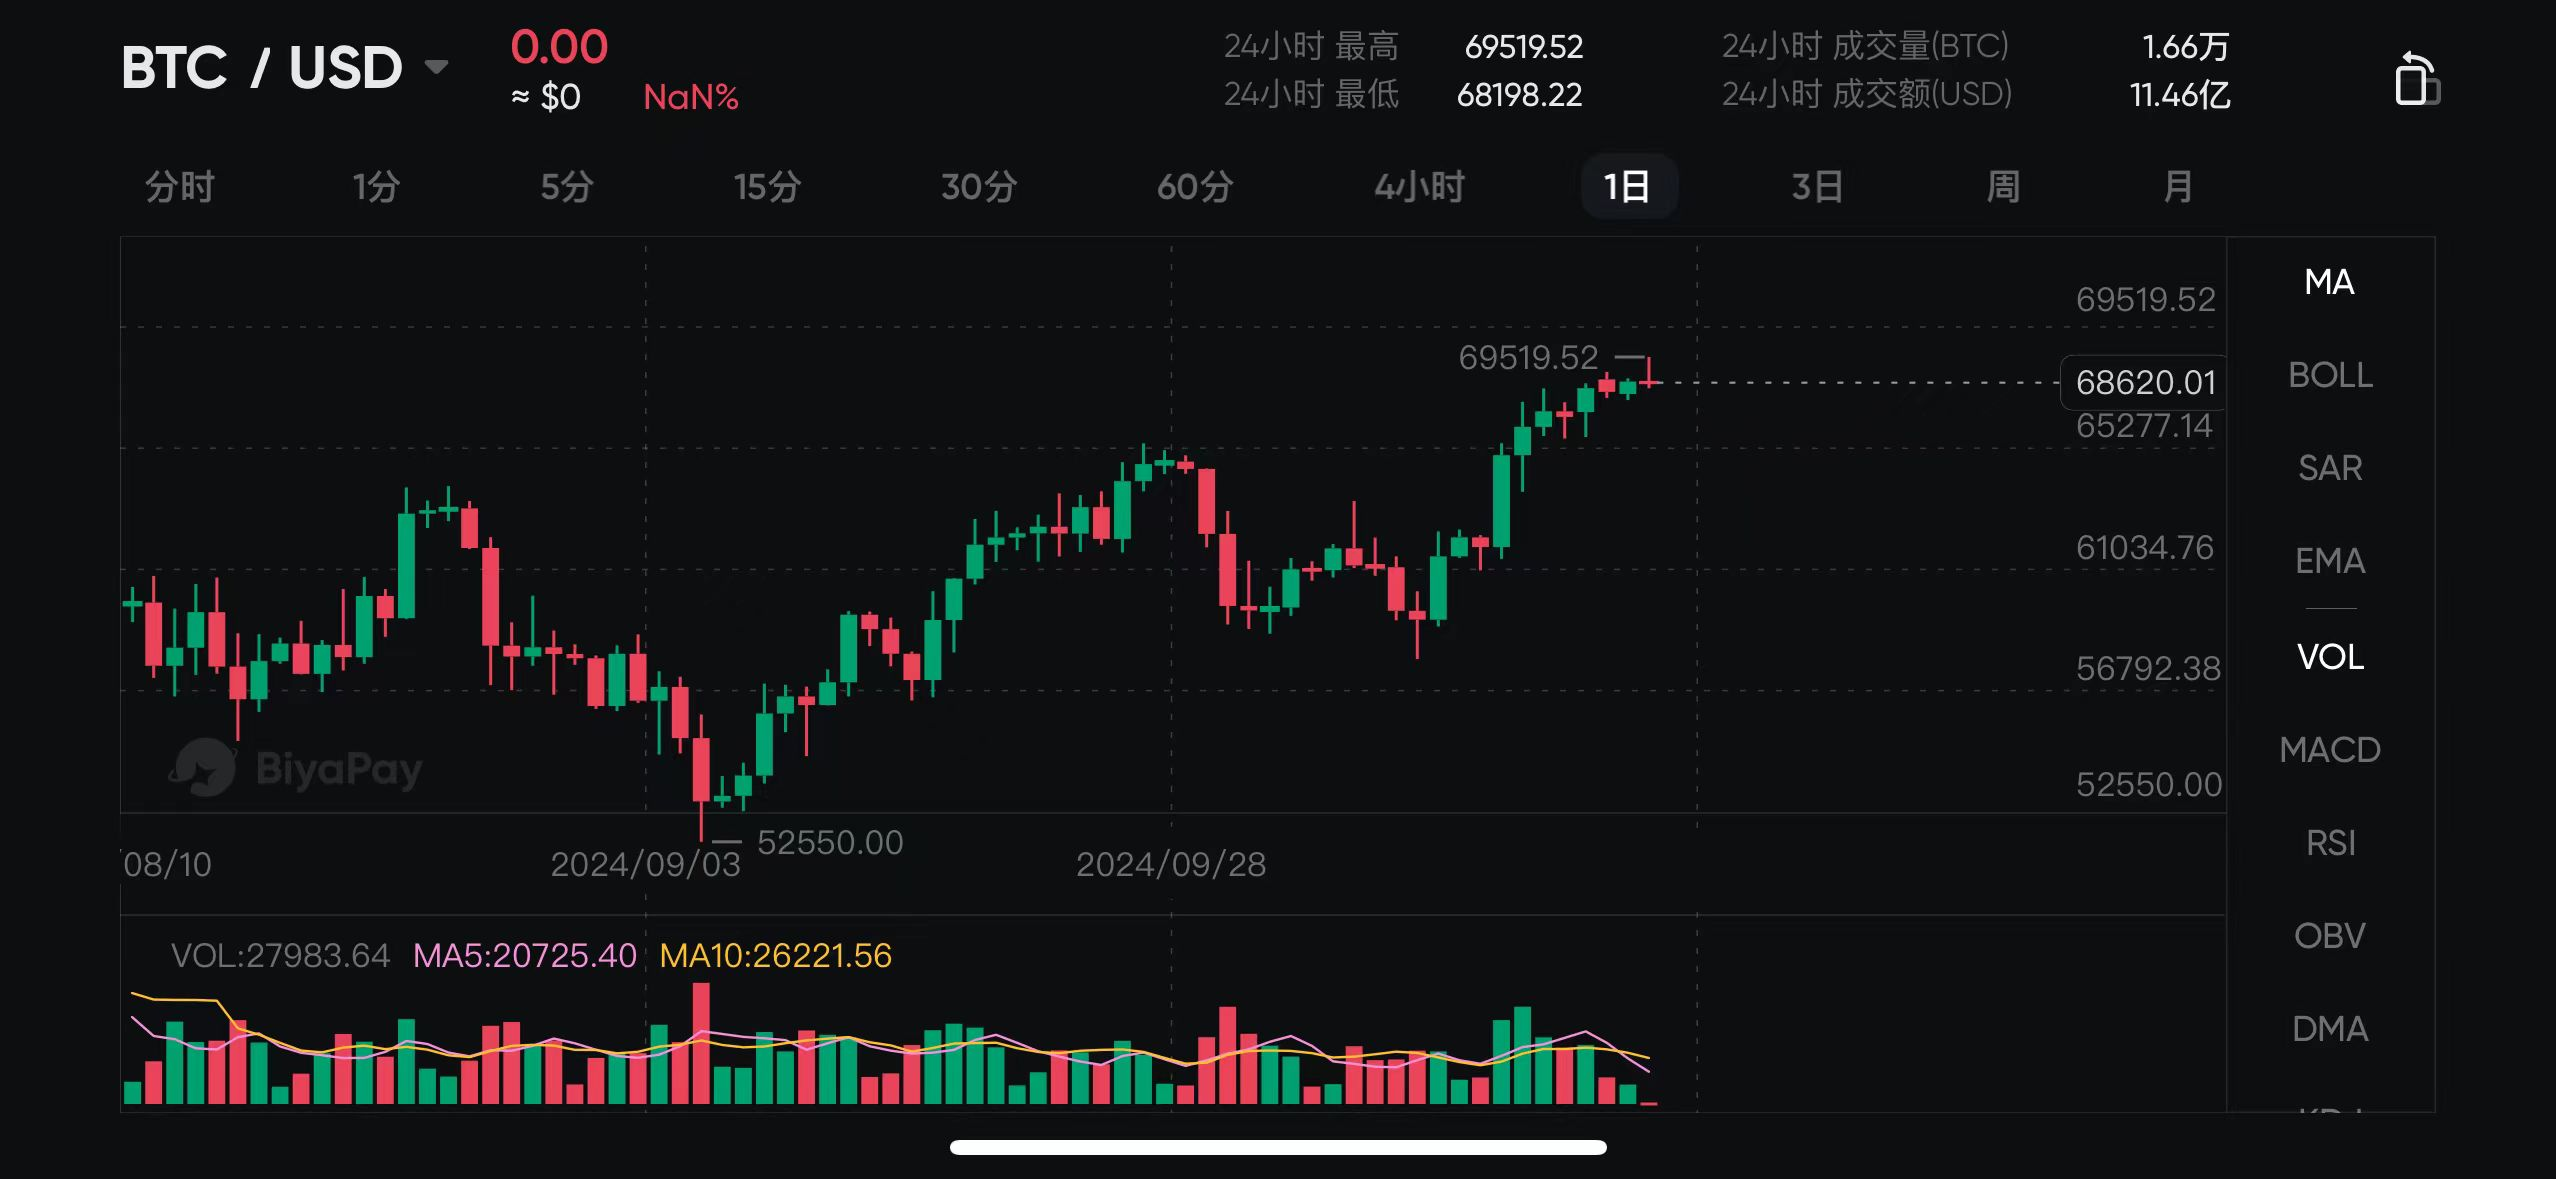
Since October, the environment of interest rate cuts and elections has prompted Bitcoin to rise from the 60,000 to a position close to 70,000. At the same time, MEME coins are flying, and most counterfeit products are also close to bottoming out, which seems to indicate the beginning of a new cycle.
When will the bull market arrive?
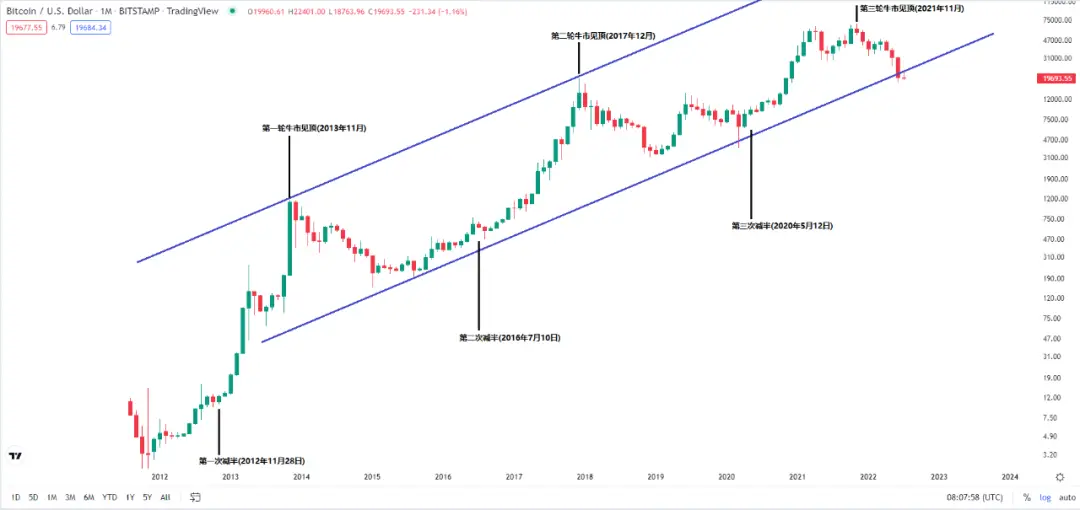
So, when will the violent bull market of Bitcoin really arrive? This is a question in the minds of many investors. Many people are discussing this question, and the answer usually points to after the Bitcoin halving. Historical data clearly shows the market performance of Bitcoin after the halving.
The first halving occurred on November 28, 2012, when the price was about $12. A year and a half later, the market entered a bull market and finally reached its peak in November 2013, with a price of $1,152, an increase of about 95 times.
The second halving occurred on July 9, 2016, at a price of $664. After a three-month period of volatility, the market entered a bull market and reached its peak in December 2017, with prices approaching $19,000, an increase of about 30 times.
The third halving was on May 12, 2020, at a price of around $9,300. After five months of volatility, the market entered a bull market and reached a historical high in November 2021, with an increase of about 7 times.
Just a few months ago, we experienced the fourth halving, and the market is still in a volatile phase. However, it is worth noting that October is usually the best month for market performance, so in the near future, the Bitcoin market may usher in a breakthrough consolidation period. According to historical patterns, the market may start to rise strongly within three to five months and is expected to reach the peak of the bull market in the second quarter of 2025. Based on past patterns, the 533 days after the halving is the time when the market can reach its peak, which is consistent with the expansion of the base pattern.
However, although this kind of data deduction makes people excited, as if a bull market is about to come, making investors eager to go all in immediately, afraid of missing this wave of market, reality always goes against their wishes. Bitcoin has not yet shown a clear bull market signal.
How to confirm the arrival of a bull market?
This makes us wonder if we can find a more rational and safe way to go long from a technical analysis perspective if we no longer rely on market sentiment or blindly believe in so-called predictions. How can we avoid blindly following the trend through clear technical signals?
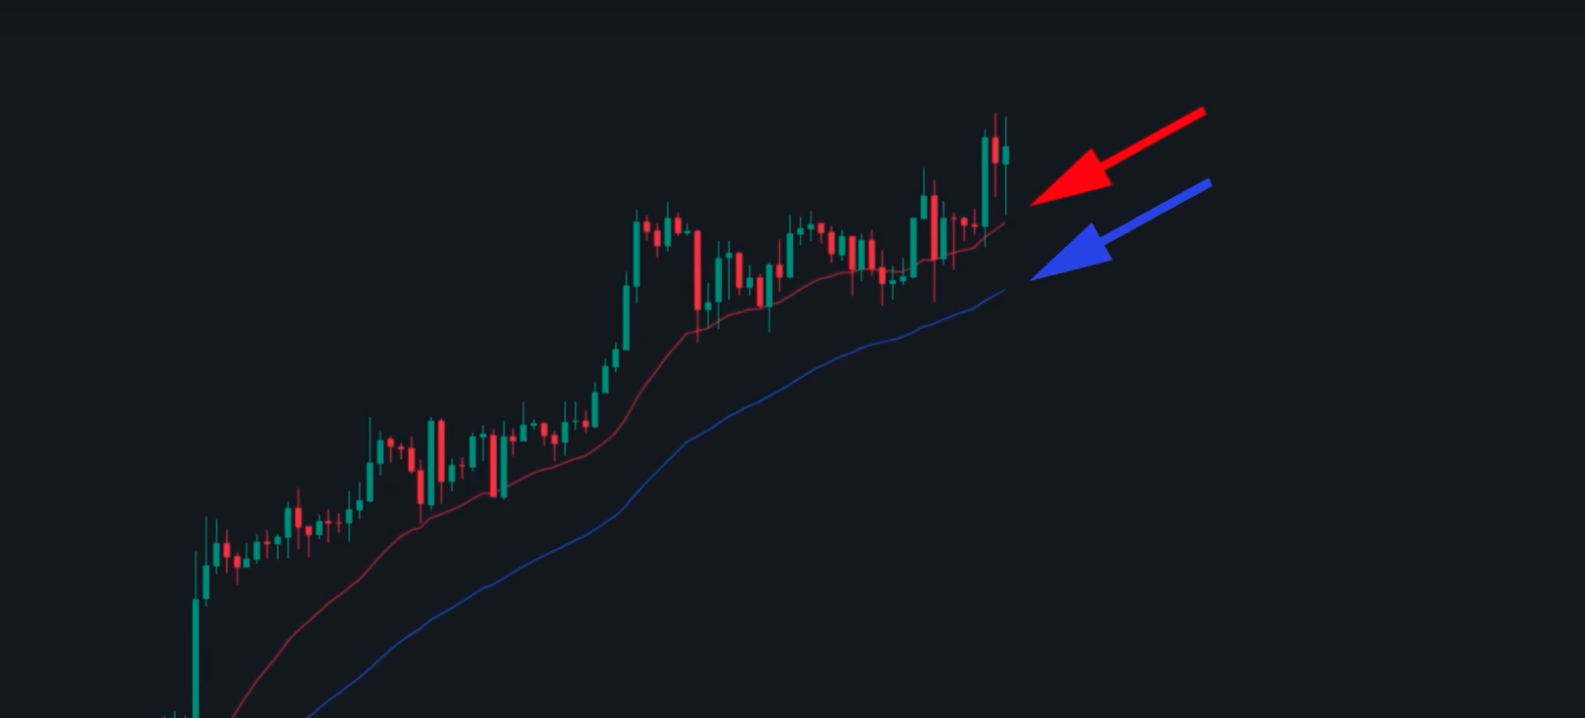
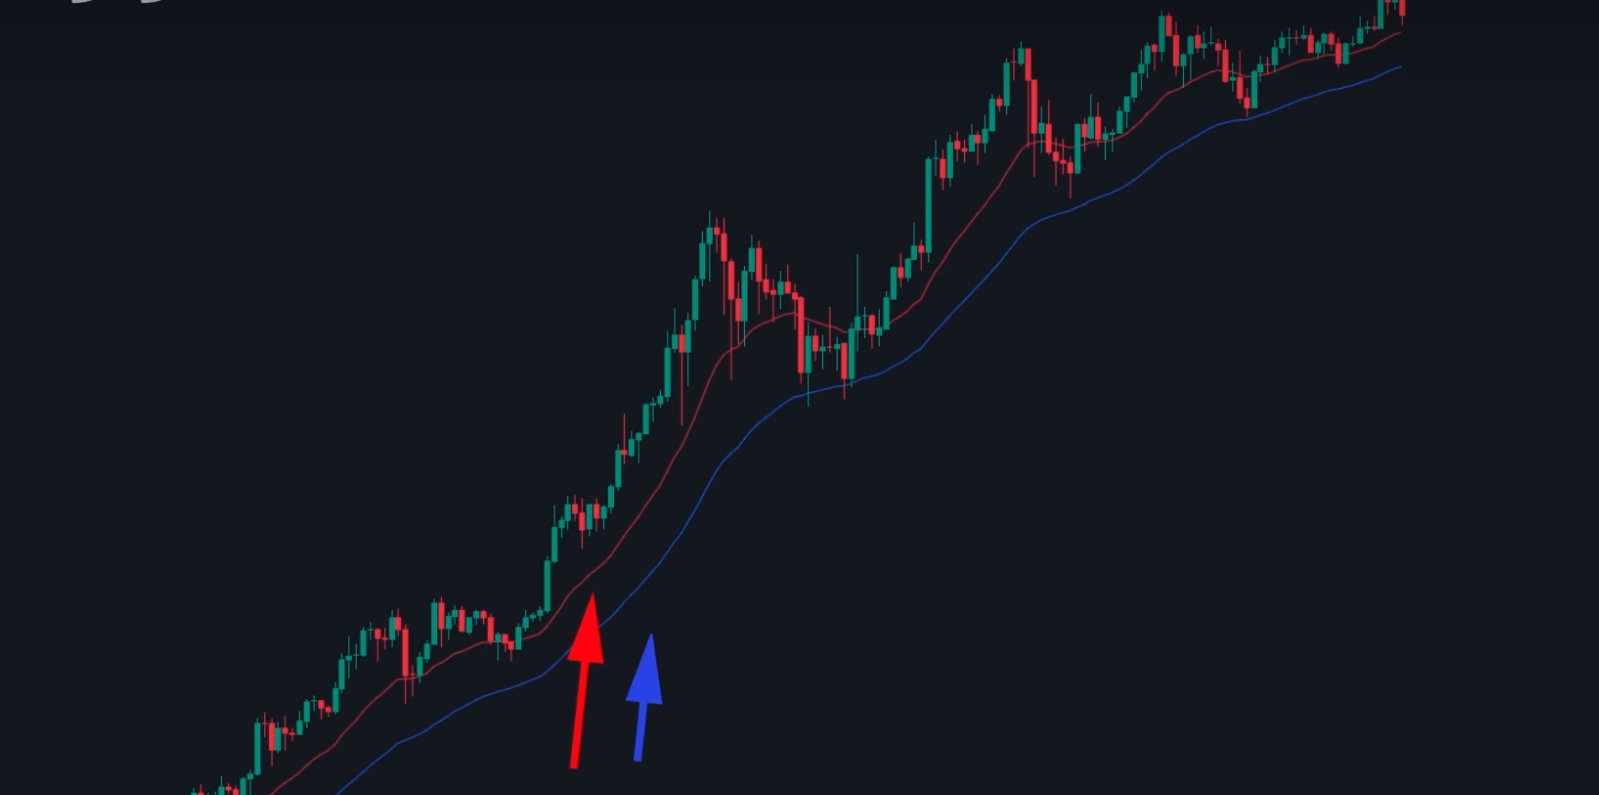
Firstly, the primary condition for a bull market is the formation of a bullish arrangement between the EMA20 and EMA50 moving averages on the daily chart, which means that the short-term moving averages are above the long-term moving averages. This arrangement clearly reflects the market entering an upward trend, indicating that the buying power is gradually taking over, and is the main signal confirming the start of a bull market.
Another key feature of a bull market is that prices gradually form higher highs and lows within the daily time window. This indicates that the market is not just a short-term rebound, but has established a continuous upward structure. Such price patterns need to be tested over time, usually accompanied by multiple retracements, but overall show a steady upward trend.
The above is a concise conclusion, but the real value lies in a deep understanding of the logic and details behind these signals in order to effectively apply them in actual trading. On the surface, the arrangement of moving averages and price structure may seem simple and clear, but without understanding the market dynamics behind these signals, they are likely to be just empty indicators.
The bull market we are discussing refers to the bull market under daily and monthly time windows, rather than short-term fluctuations in small time windows. It usually takes one to two months to gradually form higher highs and lows on the daily chart, which means that the formation of a bull market is a relatively slow process in a large time window. Traders need to be patient and wait for this structure to gradually form.
We place moving averages as the primary condition for a bull market because they can objectively filter prices. Price patterns are only subjective market judgments, and moving averages can help confirm the trend of Bitcoin under the daily time window. It usually takes one to two months to form a complete price structure. Although moving averages have a certain lag, they do not affect our judgment of the trend of the bull market.
The bull market is coming, what should investors do?
Distinguish between short-term volatility and bull market trends and pay attention to details
It usually takes some time for the price structure of a bull market to form on the daily chart. During this slow adjustment process, traders often feel numb and think that the market has not changed much. However, in reality, the bull market structure is gradually forming, and prices are quietly completing the rise of highs and lows.
Just like we are used to having 24 hours in a day, but if it is reduced to 1440 minutes, time seems to become even longer. The market is the same. During the one to two month gestation period, although it seems plain on the surface, the actual trend is brewing. The long wait makes traders easily lose patience and even ignore the process of building a bull market structure in the market, which is called time numbness.
During this incubation period, you may still see some fluctuations in Bitcoin. For example, you may find short-selling opportunities in the trading system, where the price will experience a rapid pullback of 8% to 10%, but usually rebound quickly. Despite frequent pullbacks, you will find that short positions cannot sustain profits, the market cannot be closed, and even if the direction is correct, the short-selling logic still fails.
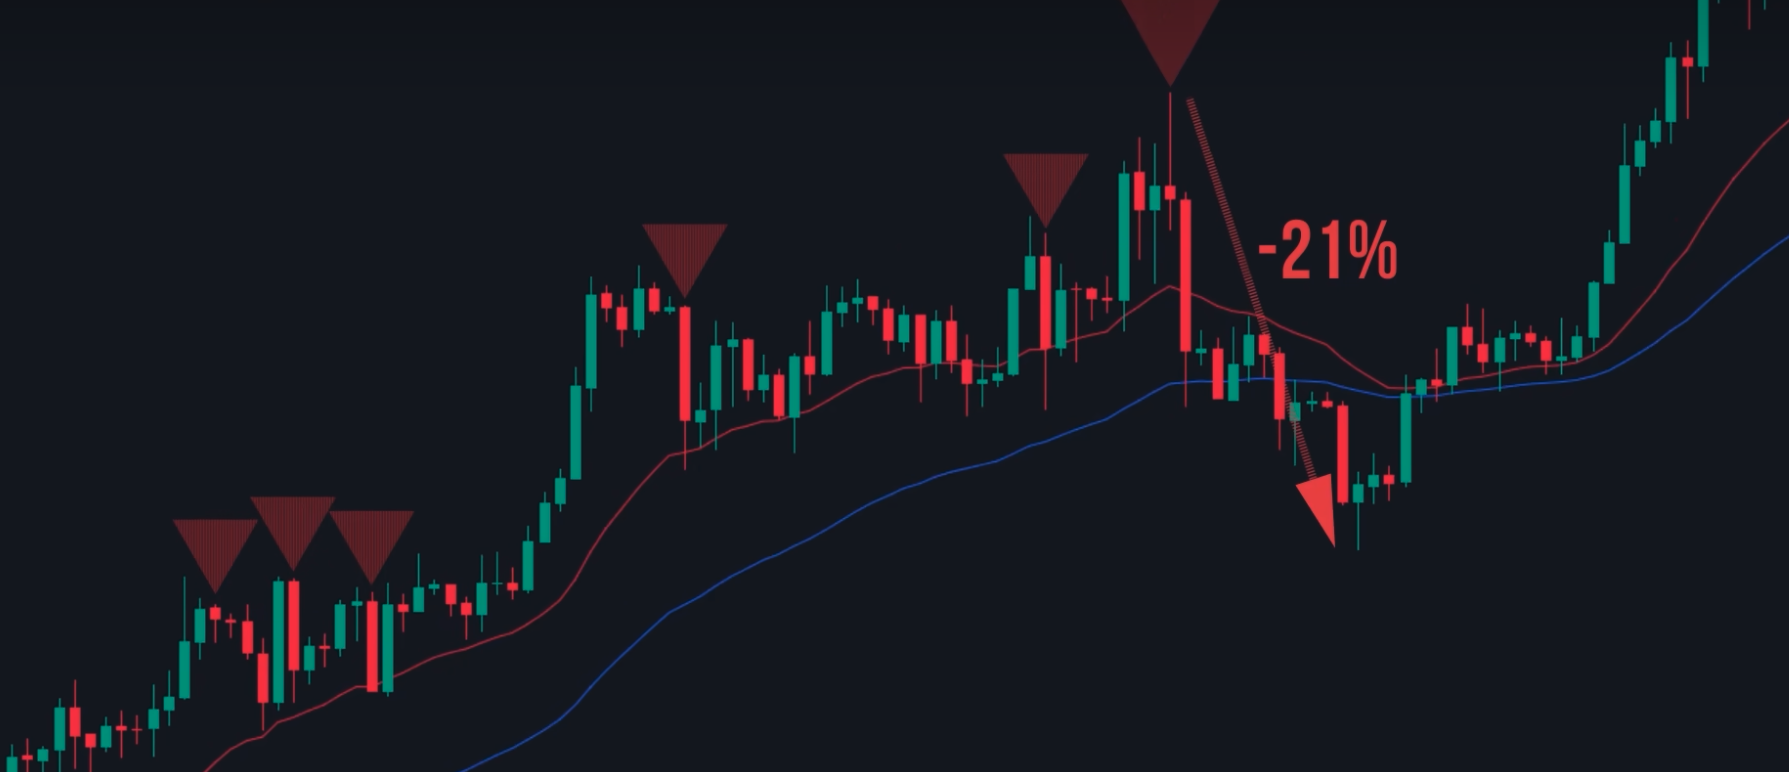
For example, in October 2023, when the bull market started and Bitcoin stood firmly above EMA20 and EMA50, there were still six significant pullbacks, the last of which fell by 21%. These pullbacks are actually normal market fluctuations. Does it look like the final shock before the trend rises as mentioned by teachers?
Be patient and find important indicators to judge the trend
In the process of forming a bull market structure in the market, we will inevitably miss the buying point on the left side. Trading on the left side often means betting that this is the last drop when the price falls, hoping to bottom fish. However, trading on the left side is extremely risky because the price may continue to fall. Trading on the right side only waits for the opening confirmation of the price pattern and the EMA moving average, and the risk is relatively small. Therefore, missing the buying point on the left side is inevitable.
However, this also triggers two common psychological misunderstandings among traders. One is that traders are obsessed with the previous low point, always hoping that the price can fall back to the previous low area again, and repeatedly have the mentality of “I will accept the low before the drop” or “I will go all in before the drop”. The other is that traders often ignore the fact that the price has formed a new high and low point structure, continue to wait for the new low point to appear again, and fail to seize the new opportunities established by the market.
Use moving average groups and filters to find long positions and avoid risks
So, how can we find low-risk long opportunities? Or the EMA moving average group we just mentioned. When the opening slope of the moving average group gradually increases, the moving average has a supporting role. We can use the support area of the EMA20 and EMA 50 moving average groups as a low-risk long area.
At the same time, we can also use the band filter to find long positions. In the four-hour time window, we can see that from October 2013 to February of the following year, the band filter had a total of twelve oversold signals at the four-hour level, averaging once every seven days. Among these twelve oversold signals, only one did not have a decent rebound, while the remaining eleven rebounded to varying degrees.
There are many amateur enthusiasts in the market who like to exaggeratedly predict that the price will rise to a certain position at a certain point in time based on a hand-drawn pressure level, a bullish candle, or so-called insider information that the institutional investors have entered the market. However, it is obvious that the bull market will not come because of someone’s loud voice or extreme wording.
Professional traders know that in order to make money in the market, the primary task is to filter out risks. Undoubtedly, the sources of information that make you anxious are the biggest sources of risk, often becoming the cost or fuel for the start of a bull market.
Make money in the bull market, suitable deposit and withdrawal tools to ensure the smooth landing of funds
Learning how to make money in a bull market is very important, but finding a safe and stable deposit and withdrawal is equally important. Imagine if you made 10 million in this bull market, but your bank card was frozen due to choosing the wrong withdrawal method, wouldn’t you suffer a heavy loss? So how can you withdraw money safely and reliably in a bull market?
Here I have to mention a multi-asset trading wallet, BiyaPay, which is the safest withdrawal platform I have found so far.
The specific operation plan is as follows:
① You can transfer the exchange’s USDT to BiyaPay. ② Then exchange it for US dollars or other fiat currencies at a 1:1 ratio in BiyaPay ③ Then withdraw to banks such as Wise or OCBC ④ Finally, directly remit to the mainland bank card or Alipay WeChat
Although there will be handling fees and exchange losses, this is a legal behavior, and your funds will become clean. Of course, you will need to pay some handling fees and exchange losses, but these are all to make your funds legal, so this is the cost we should pay. Learn these legal withdrawal paths, and your ROI can be safely obtained!
Summary
Today, we shared the characteristics and key details of the bull market, as well as how to capture low-risk long opportunities on the right side. Every step stands up to scrutiny, hoping that investors can effectively manage risks and patiently wait for the bull market to arrive. But can we really go all in with Bitcoin breaking through 69000? The answer is obviously no. Although the price trend of Bitcoin is exciting, market uncertainty still exists. We cannot blindly invest all our funds just because of the short-term price increase. In the field of financial investment, caution is always the key to success. We need to consider various factors comprehensively, including market trends, technical indicators, macroeconomic environment, etc., to make wise investment decisions. Only in this way can we steadily move forward in the volatility of the Bitcoin market and achieve our investment goals.

BiyaPay makes crypto more popular!
Contact Us
Company and Team
BiyaPay Products
Customer Services
Resources
Telegram digital currency community:
https://t.me/BiyaPay666
Community


Sign In
Sign Up
Sign In
Sign Up
Regulation Subject
BIYA GLOBAL LIMITED registered as Financial Service Provider (FSP number: FSP1007221) in New Zealand, and is a member of the Financial Dispute Resolution Scheme, a New Zealand independent dispute resolution service provider.
BIYA GLOBAL LLC registered with the US Financial Crimes Enforcement Network (FinCEN), as a Money Services Business (MSB), registration number: 31000274115551, and regulated by FinCEN.
BIYA GLOBAL LLC To enhance investor protection, BIYA GLOBAL LLC is expediting its Broker-Dealer license application process in full compliance with U.S. SEC and relevant regulatory requirements.
©2019 - 2025 BIYA GLOBAL LIMITED