
- Remittance
- Exchange Rate
- Stock
- Events
- EasyCard
- More
- Download


What is the panic index VIX and which related ETFs are worth paying attention to? How to use VIX for

Published on 2024-10-10 Updated on
2024-11-05


In the market, when there is a significant deviation between the public’s “expectations” and the revealed reality, asset prices may experience huge fluctuations. The driving force behind this gap between “expectations” and “reality” often exceeds the impact of a certain data or event itself. Therefore, grasping the market sentiment, understanding the market expectations, knowing how others in the market think, whether everyone is in a state of panic or in a stable state, this point plays a very important role in anticipating market behavior.
To understand market sentiment, it’s impossible for us to ask questions one by one. Someone has already helped us solve this problem in advance. The “panic index” exists for this purpose. Today, the editor will take you to understand this important index that can touch market sentiment and the US stock investments we can make.

What is the VIX volatility index?
The “panic index” we usually refer to is the VIX volatility index, which refers to the Chicago Board Options Exchange Volatility Index (Chicago Board Options Exchange Volatility). Its trading code is VIX, which is interpreted by most institutions as a leading market sentiment indicator. Therefore, the VIX volatility index is called the panic index.
It was launched by the Chicago Board Options Exchange (CBOE) in 1993. In 2003, CBOE updated the VIX volatility index with Goldman Sachs, based on the core index of US stocks, the Standard & Poor 500 index, and estimated the expected volatility of a wide range of exercise prices by aggregating the weighted prices of put and bullish options on the index.
The VIX volatility index is often used to measure the implied volatility of S & P 500 Index options, which is a way to understand the market’s expectations for market volatility in the next 30 days. Although the VIX volatility index reflects the degree of volatility in the next 30 days, it is expressed as an annualized percentage and appears as a probability of normal distribution.
For example, assuming the VIX volatility index is 15, it means that investors in the market generally expect the annualized volatility of the S & P 500 Index to be 15% in the short term (within 30 days). Therefore, it can be inferred that the index options market expects the S & P 500 Index to fluctuate up or down by 15%/√ 12 = 4.33% in the next 30 days. That is to say, the pricing assumption of index options is that the probability of the S & P 500 Index’s volatility within plus or minus 4.33% in the next 30 days is 68%.
Calculation formula for VIX volatility index
The VIX volatility index is calculated in real time based on the real-time price of S & P 500 index options. Specific option contracts include standard CBOE SPX options (expiring on the third Friday of each month) and weekly CBOE SPX options (expiring every Friday). It is worth noting that the expiration time of the options used to calculate the VIX volatility index must be between 23 and 37 days.
Here is the official calculation formula:
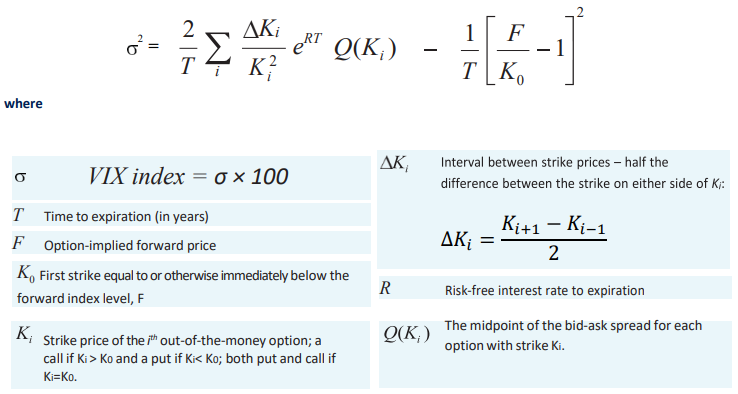
VIX volatility index and market sentiment
Through the above formula, we can easily find that the calculation process of VIX volatility index is very complicated. However, for most traders, specific calculations are not necessary. We only need to understand the market sentiment represented by different values of VIX volatility index.
The VIX volatility index indirectly predicts the level of market panic by calculating the open interest and price fluctuations of derivatives (options). Its principle is that when the market panic is high, there is greater selling pressure/buying of derivatives, and when the market panic is low, there is less demand for derivatives.
When the VIX volatility index is high, it indicates that investors expect significant market fluctuations, which may be positive or negative. Only when investors believe that there is neither significant downside risk nor significant upside potential, will the VIX volatility index be low.

What guidance does it have for investors?
In Mature Market, VIX is an index that almost all investors must pay attention to. It is mainly used for three aspects: observing market risks and investor sentiment, predicting market trends and fluctuations, and adjusting technical analysis and trading strategies.
The original intention of VIX design is to warn the market latent risk, so VIX is often used by investors as an important basis for positioning increase and decrease.
The VIX volatility index has several key thresholds, which are 15, 20, and 40.
When the VIX volatility index is below 20 points, it indicates that investors are optimistic about the market and unwilling to take risks for their investments, resulting in a relatively stable market performance.
On the contrary, when the VIX volatility index is higher than 20 points, it reflects that investors have significant differences in the market, and the market may experience significant fluctuations.
Usually, when the VIX volatility index exceeds 40 points, it indicates that investors are extremely pessimistic about the market and may experience irrational panic, which may lead to a short-term rebound.
On the other hand, when the VIX volatility index is below 15 points, it indicates that investors are extremely optimistic about the market, and the market may experience irrational prosperity, which may be accompanied by selling pressure.
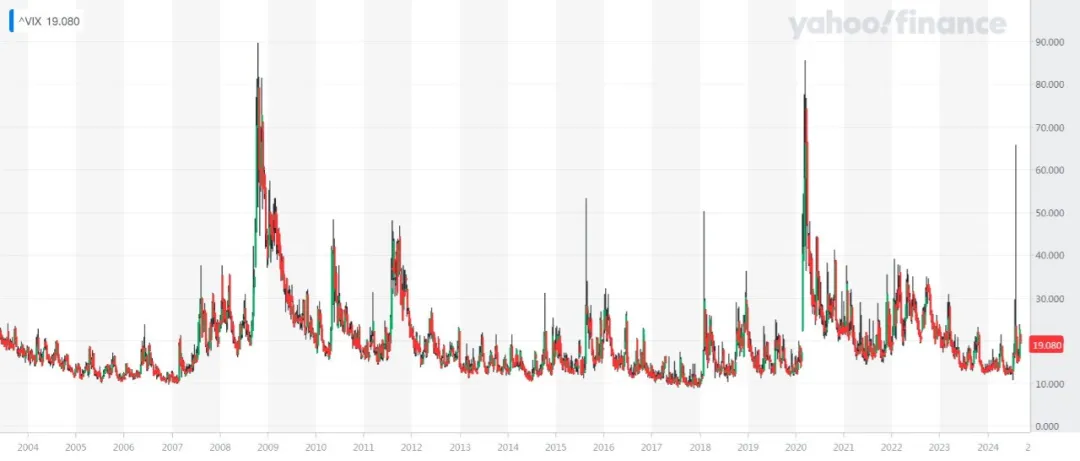
In addition, when a major risk event occurs, the VIX volatility index is generally around 40 points. During the 2008 financial crisis, the peak of the VIX volatility index reached 80 points, equivalent to an expected market volatility of about 23% in the next 30 days.
Characteristics of VIX volatility index and corresponding strategies
Understanding the characteristics of the VIX volatility index can better guide our investment decisions. Here are a few of its characteristics:
1 Meaning Reversion
According to the VIX volatility index, the VIX fluctuates in the range of 10-30 most of the time, with a historical high of 89.53, which occurred during the Lehman crisis in 2008. The second highest occurred during the epidemic in 2020, and August 5th of this year was the third highest in history. The historical low is 8.56, and the average VIX value from 1990 to the present is 19.56.
Volatility maintains a long-term center at any historical time. When market fluctuations cause VIX to deviate significantly, it will quickly return to the long-term center area. Although most of the time it fluctuates within a range, VIX still frequently experiences very steep soaring and falling processes.
VIX hits several highs every year, which means that the US stock market always experiences various crises leading to sudden drops. However, as the world’s strongest Capital Markets, every drop is overcome or calmed down, so VIX correspondingly falls sharply, and the time at the top is not too long, usually not more than a month.
This way, we can adopt the strategy of shorting related ETFs and waiting for their return when the VIX starts to fall after a surge.
2. VIX has a strong negative correlation with the S & P 500 index
By comparison, it can be found that the trend of VIX is almost opposite to that of S & P 500, and this phenomenon is most obvious when S & P plummets.
However, it should be noted that there will be the same trend for a small part of the time, and it is not a 100% negative correlation.
At the same time, VIX fluctuations generally occur slightly earlier than the S & P 500, so VIX can also be used as a forward-looking indicator for the S & P 500.
Therefore, when expecting significant market fluctuations, you can briefly buy long ETFs on the VIX volatility index to protect your investment portfolio or engage in short-term speculation.
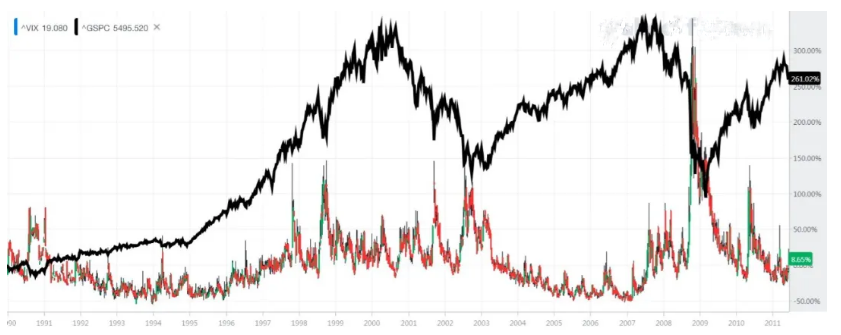
(Note: For ease of comparison, the percentage chart of S & P 500 and VIX is used here, with the black line representing S & P 500 and the candlestick representing VIX.)
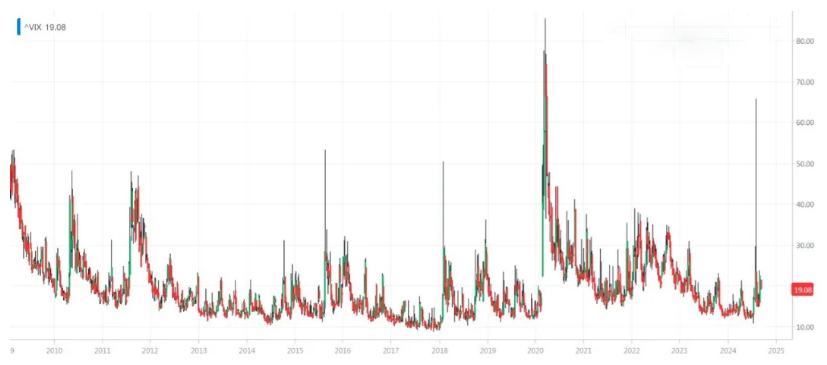
3. It has a clustering effect
The spike in VIX rarely occurs once, but often occurs multiple times in a relatively short period of time, a phenomenon researchers call the clustering effect.
The following chart shows the trend of VIX from 2009 to recent times. It can be seen that regardless of the size of the fluctuations, most of the peaks are spaced 4-6 months apart.
The VIX volatility index is influenced by investors’ psychology. During the emotional sensitive period of investors, some small fluctuations that occur in Financial Marekt will also be amplified and expressed on the VIX volatility index. In addition, most investments
Those who follow the crowd have a herd mentality. Every 4-6 months, the VIX volatility index will enter a sensitive period. At this time, it is necessary to closely monitor whether the VIX has any abnormal movements that break through the oscillation range.
Therefore, if VIX is in a low range for a long time and is close to the expected peak period, it can be considered to briefly go long on related ETFs.
What VIX-related products can investors trade?
First of all, it should be noted that the VIX volatility index itself is not tradable. Currently, the main traders in the market are futures or options that track the VIX.
After the development of ETFs, there are also ETFs corresponding to VIX options that investors can trade. There are many ETF /ETN products related to the VIX index. The following are the varieties with relatively large trading volume and active activity.
1、iPath S&P 500 VIX Short-Term Futures ETN (VXX)
The tracking target is the S & P 500 VIX short-term futures index, which mainly invests in indices related to VIX short-term futures. Prices usually rise when market volatility increases, making it suitable for short-term volatility trading.
2、ProShares VIX Short-Term Futures ETF (VIXY)
The tracking target is the S & P 500 VIX short-term futures index, which mainly holds VIX short-term futures contracts and aims to provide short-term volatility exposure related to the VIX volatility index.
3、ProShares Ultra VIX Short-Term Futures ETF(UVXY)
The tracking target is the S & P 500 VIX short-term futures index (1.5x leverage), a 1.5x leverage ETF that amplifies the volatility of VIX short-term futures and is suitable for short-term traders with high-risk returns.
4、VS Trust 2x Long VIX Futures ETF(UVIX)
The tracking target is the S & P 500 VIX long-term futures index (2x leverage), a 2x leverage ETF that also amplifies the volatility of VIX short-term futures and is suitable for high-risk short-term traders, providing higher leverage than UVXY.
5、ProShares VIX Mid-Term Futures ETF(VIXM)
The tracking target is the S & P 500 VIX medium-term futures index, which mainly invests in VIX medium-term futures, provides exposure related to VIX medium-term volatility, and is suitable for hedging or investing in expected medium-term volatility changes.
6、iPath S&P 500 VIX Mid-Term Futures ETN(VXZ)
The tracking target is the S & P 500 VIX medium-term futures index, which mainly invests in VIX medium-term futures with lower volatility than short-term futures, but still provides hedging when the market is uncertain.
7、ProShares Short VIX Short-Term Futures ETF(SVXY)
The tracking target is the S & P 500 VIX short-term futures index (-0.5x leverage), which is also an inverse ETF that provides the opposite 0.5x return to the VIX short-term futures index. It has lower volatility and is suitable for more conservative short volatility strategies.
8、-1x Short VIX Futures ETF(SVIX)
The tracking target is the S & P 500 VIX short-term futures index (-1 times leverage), an inverse ETF that offers 1x returns opposite to the VIX short-term futures index and is suitable for investors who short when market volatility decreases.
How investors trade
The above related products provide trading opportunities. Interested investors can choose to go to the multi-asset trading wallet BiyaPay to monitor the real-time trend of the above stocks, balance risk and profitability, and choose the appropriate time for online trading.
In addition, BiyaPay can also be used as a professional tool for depositing and depositing funds for US and Hong Kong stocks. You can recharge digital currency on this platform, exchange it for US dollars or Hong Kong dollars, withdraw it to your bank account, and then transfer the funds to other brokerage accounts to buy stocks. The platform has a fast and unlimited transfer speed, which allows you to quickly grasp the market and not miss investment opportunities.
Faced with high VIX volatility index, investors how to layout
When facing high VIX volatility index, investors can take corresponding defensive measures to protect their investment portfolio. Here are some defensive strategies for income generation during high VIX periods.
1. Diversify investment portfolio
During the high VIX period, the market fluctuates greatly and risks increase significantly. Diversifying investment portfolios is an effective defense strategy. Diversifying investments across different asset classes and industries can reduce the volatility of the overall investment portfolio and prevent single risks.
2. Use options for hedging
Options are an effective tool that can help investors hedging risks in high-volatility markets. Investors can purchase PUT options to hedging their stock positions, thus obtaining protection in the event of a significant market decline. Options portfolios can also be compiled to achieve more refined risk management.
3. Adopt hedging strategies
During high VIX periods, hedging strategies are particularly important. Investors can obtain protection in the event of significant market fluctuations by purchasing hedging products such as volatility ETFs or VIX futures, or establish a “protective cushion” to avoid potential risks.
Although VIX is an important market indicator, investors still need to be cautious. VIX is not an absolute tool for predicting market trends, but is used to help investors understand market sentiment and risk appetite. Investors need to comprehensively consider various factors such as VIX, technical indicators, and fundamentals to make comprehensive investment decisions.
It is crucial to maintain a calm mind and invest rationally during market fluctuations. Investors should develop corresponding investment strategies based on their own risk tolerance and investment goals, and be ready to deal with market uncertainties at any time.
The panic index VIX is an important reference indicator for investors when market risks increase, which can help them better understand market sentiment and risk appetite, and formulate corresponding investment strategies.
By diversifying investment portfolios, using options for hedging, and adopting hedging strategies, investors can effectively avoid risks and protect their assets.
Overall, the VIX volatility index, as a barometer of market volatility, plays an important role in our judgment of market sentiment and anticipation of market trends. Through the high and low fluctuations of the VIX, we can insight into changes in market sentiment and adjust our investment portfolio reasonably. At the same time, the VIX also provides us with various profit opportunities, which are expected to make significant profits through short-term trading. However, the volatility of the VIX is relatively high, and investors participating in it need to ensure that they have certain market experience and risk tolerance, and invest cautiously.

BiyaPay makes crypto more popular!
Contact Us
Company and Team
BiyaPay Products
Customer Services
Resources
Telegram digital currency community:
https://t.me/BiyaPay666
Community


Sign In
Sign Up
Sign In
Sign Up
Regulation Subject
BIYA GLOBAL LIMITED registered as Financial Service Provider (FSP number: FSP1007221) in New Zealand, and is a member of the Financial Dispute Resolution Scheme, a New Zealand independent dispute resolution service provider.
BIYA GLOBAL LLC registered with the US Financial Crimes Enforcement Network (FinCEN), as a Money Services Business (MSB), registration number: 31000274115551, and regulated by FinCEN.
BIYA GLOBAL LLC To enhance investor protection, BIYA GLOBAL LLC is expediting its Broker-Dealer license application process in full compliance with U.S. SEC and relevant regulatory requirements.
©2019 - 2025 BIYA GLOBAL LIMITED