
- Remittance
- Exchange Rate
- Stock
- Events
- EasyCard
- More
- Download


Rising in the east and falling in the west, how can Xiaobai go long on China in the US stock market?

Published on 2024-10-09 Updated on
2024-11-05


On Thursday, October 3rd local time, the three major US stock indexes collectively fell As of the close, the Dow Jones Industrial Average fell by 0.44%, the S & P 500 fell by 0.17%, and the Nasdaq fell by 0.04%. The three major European stock indexes fell across the board Among them, the United Kingdom FTSE 100 index fell by 0.10%, the France CAC40 index fell by 1.32%, and the Germany DAX index fell by 0.78%. Analysts said that the continued tension in the Middle East has hit market risk appetite, putting pressure on European and American stock markets to fall.
However, China Concepts Stock and related ETFs rose against the trend.
China Dragon DRAG
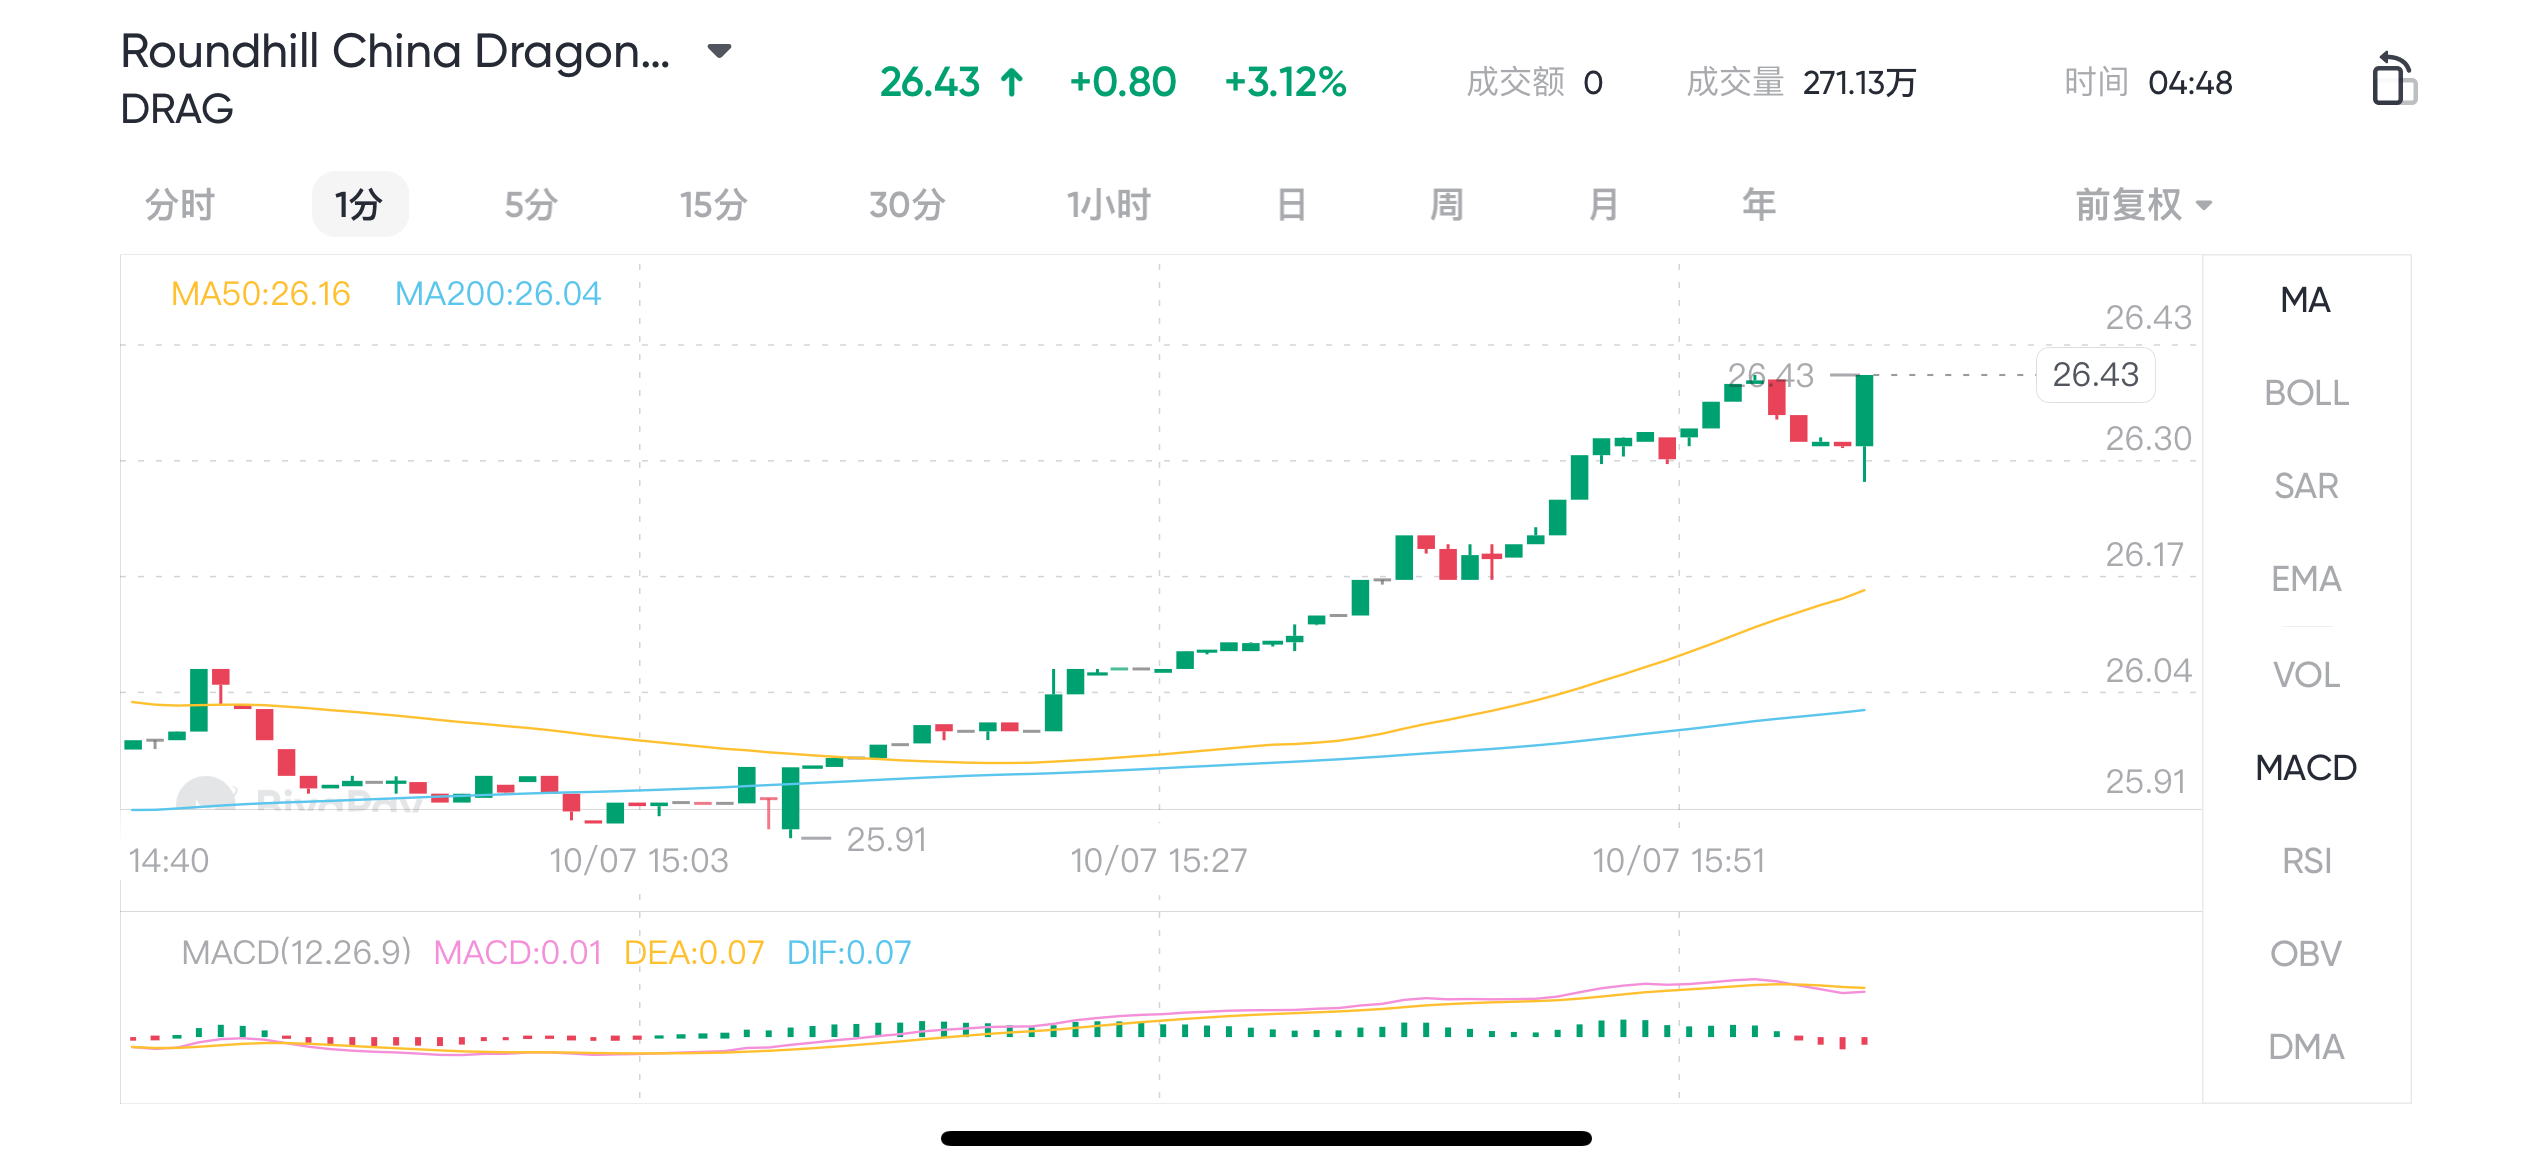
A new ETF, called The Roundhill China Dragons ETF (DRAG), which tracks the performance of China’s largest companies, landed in the US on Thursday amid a surge in the Chinese stock market DRAG aims to track an equal-weighted basket of stocks consisting of 5 to 10 of the largest and most innovative Chinese technology companies. Its constituent stock currently includes Tencent, Pinduoduo, Alibaba, Meituan, BYD, Xiaomi, JD.com**, Baidu, and NetEase.** Publishers collectively refer to these companies as the “Chinese Dragon”.
Roundhill Investments said that as of the launch, the nine mega-tech companies in general were significantly stronger than their peers in terms of scale economy, solid fundamentals and growth, demonstrating a competitive advantage. The ETF will be rebalanced quarterly. Dave Mazza, CEO of the company, said that the difference between DRAG and other ETFs that provide exposure to China, such as the $7.90 billion Jinrui Fund CSI Overseas China Internet Fund (KWEB) and the $6.40 billion iShares iShares China Large Cap ETF (FXI), lies in its concentration.
DRAG’s fee rate is 0.59%, which is slightly lower than most similar ETFs.
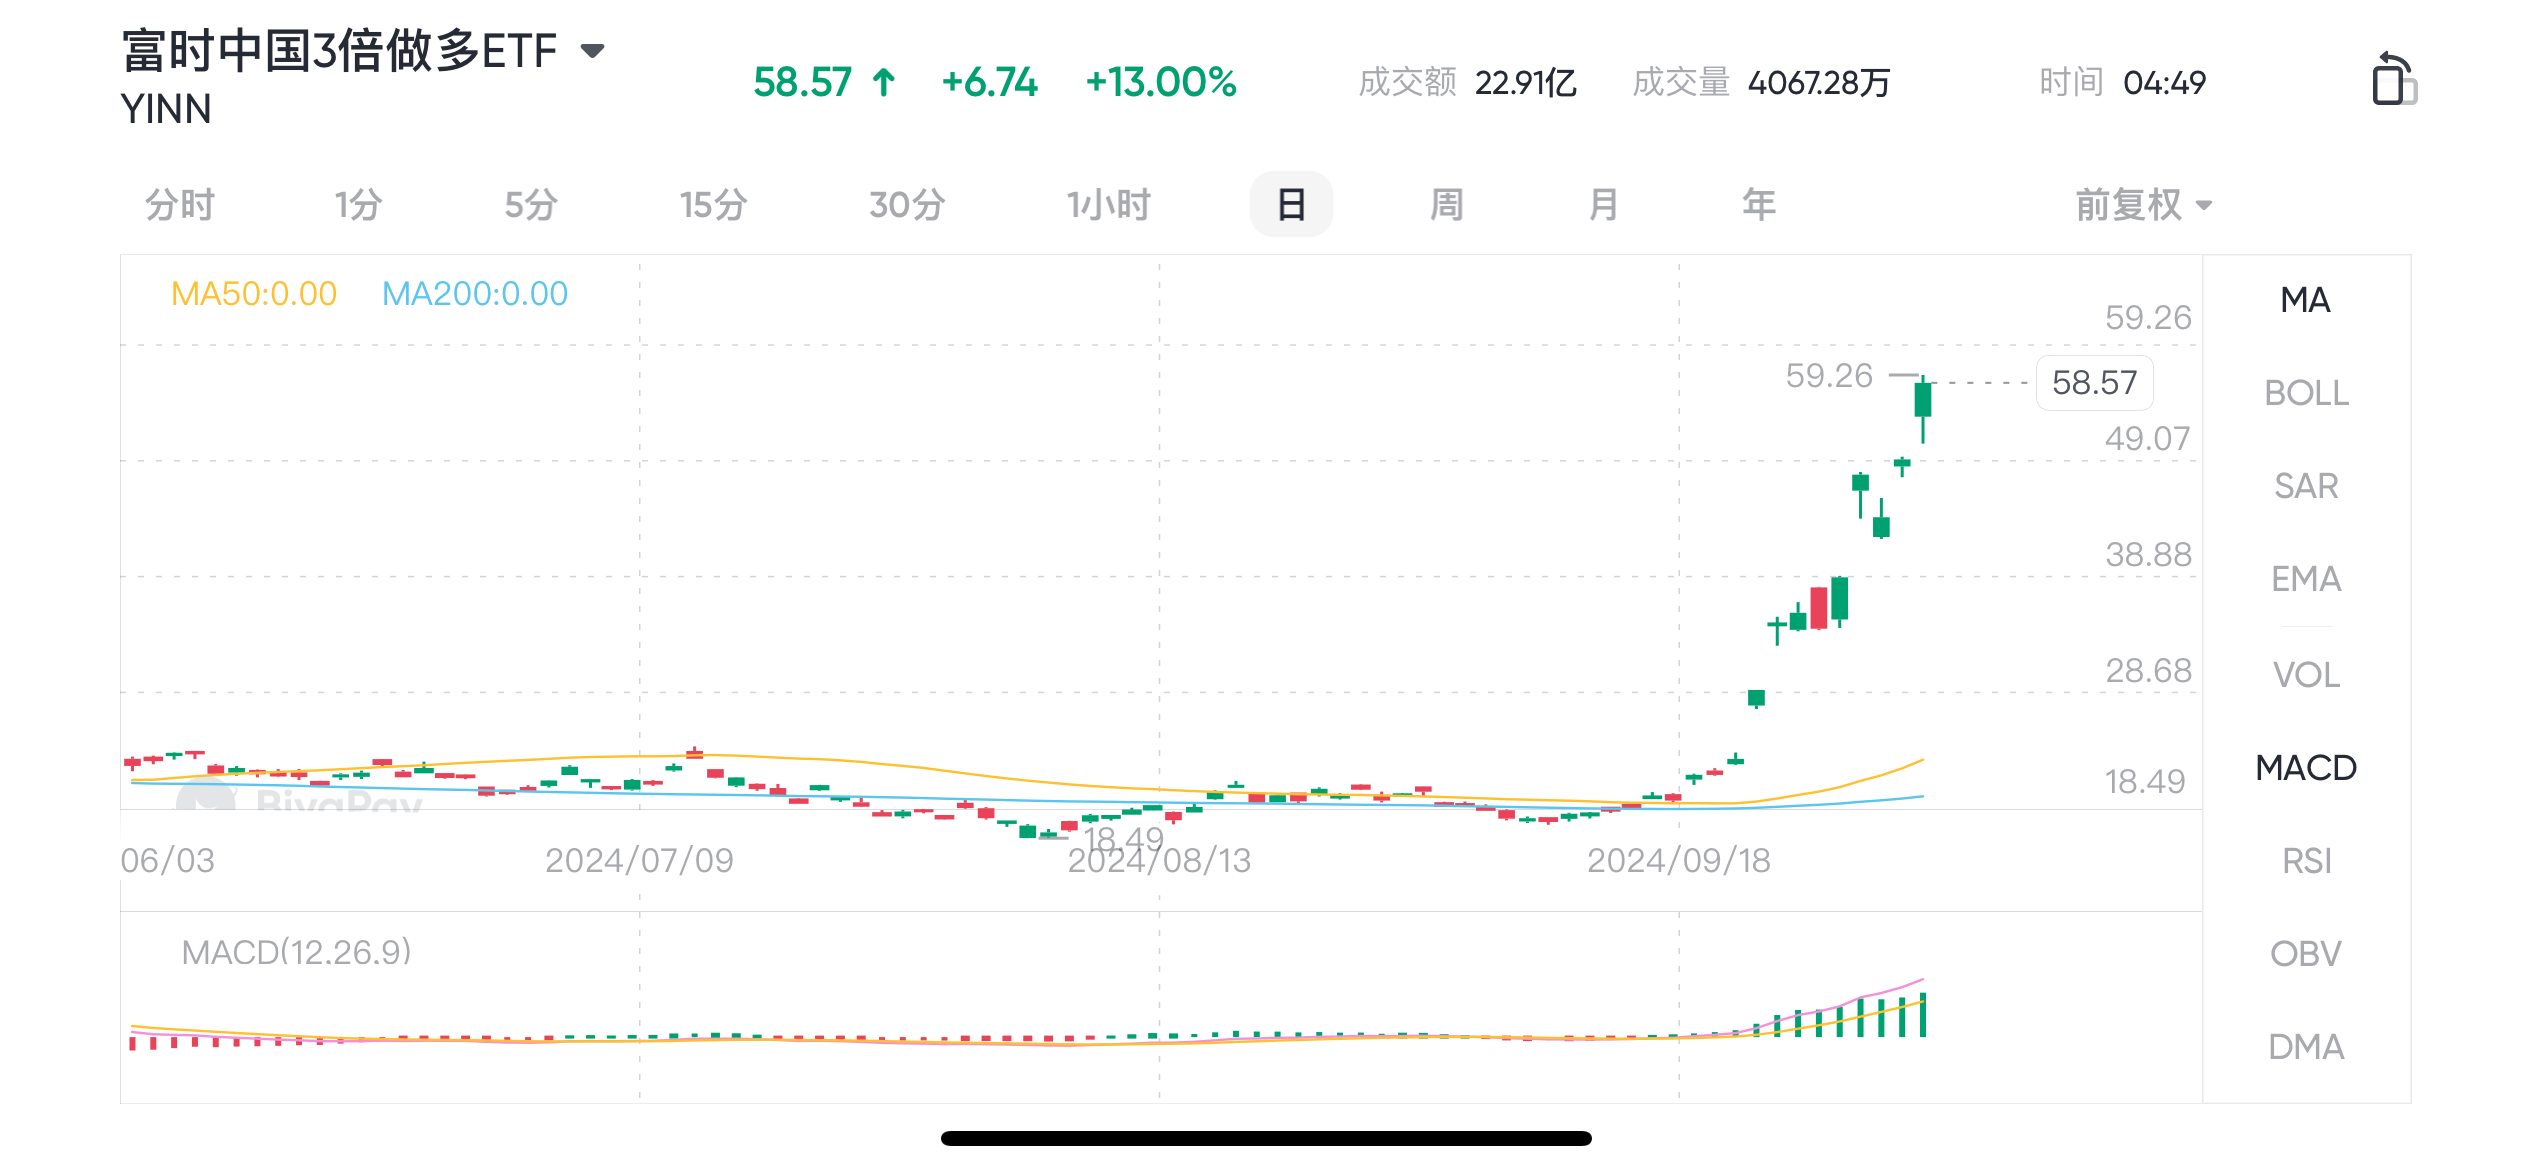
In fact, there are many ETFs targeting Chinese assets in the US stock market, among which the well-known one is YINN . Today we will focus on this ETF.
What is YINN?
Basic information
YINN, Direxion’s daily FTSE China bull market share triples, targeting daily net value changes before fees, which is 300% of the performance of the FTSE China 50 Index. The index is composed of the 50 largest and most liquid Chinese Listed Companies currently traded on the Hong Kong Stock Exchange. The fund does not make diversified investments.
Code: YINN
Full name: Direxion Daily FTSE China Bull 3X ETF
Establishment time: December 3, 2009
Exchange: New York Stock Exchange (NYSE)
Related Index: FTSE China 50
Trading Currency: USD
Share published: 600 million
Management Size: $1.171 billion
Trading volume: 35.64 million shares
Turnover rate: 44.49%
Number of shares held: 50
Due to YINN being a leveraged ETF, attention should be paid to the keywords “daily” and “before deducting fees”. Therefore, the return it seeks is three times the daily return of its benchmark index, and it should not be expected that these funds will provide three times the benchmark cumulative return for more than one day.
Major positions
For leveraged ETFs, they rely on a series of derivative contracts and swaps to achieve the purpose of doubling volatility, so their own position analysis is of no value. What we need to pay attention to is their underlying income-linked FTSE China 50 index holdings.
FTSE China 50 refers to the FTSE China 50 Index (please note that this A50 is different from the domestic FTSE China A50), calculated by FTSE Russell. The FTSE China 50 Index includes the 50 largest and most liquid Chinese stocks, including H-Share, Red Chip, and P-shares, all of which are listed on the Hong Kong Stock Exchange (SEHK).
The selection of Constituent Stocks for the FTSE China 50 Index is based on two main criteria: market value and liquidity. This means that selected companies not only need to have a large market value in the market, but also need to have good trading liquidity to ensure that the index accurately reflects the overall market performance. At the same time, in order to avoid excessive concentration on any single stock, the upper limit of the weight of each Constituent Stock is set at 9% (but it is not adjusted in real-time, and will be adjusted annually if exceeded). This weight limit helps with Risk Diversification and ensures that the performance of the index is not greatly affected by extreme fluctuations in a single stock.
The Constituent Stock of this index is not fixed, but undergoes a routine review and adjustment every year to ensure that the most representative and influential companies in the market are included. This rigorous screening and updating process ensures the vitality of the index and its sensitivity to market changes.
For investors seeking to invest in the Chinese stock market, the FTSE China 50 Index is not only an important reference indicator, but also a barometer reflecting market trends. As its constituent stocks are all industry leaders, the index is often seen as a benchmark for the Chinese stock market. Investors can observe the trend of this index to gain insight into the trend of the Chinese stock market and provide strong support for their investment decisions.
Industry distribution
If you directly purchase YINN, it is equivalent to tripling your confidence in China, with outstanding results.
How to calculate the profit and wear of leveraged ETFs
The so-called leverage loss, assuming an initial net value of 1, investors buy 1000 shares of YINN for $1000. Due to the use of triple leverage, the financing amount is $2000, and the total assets are $3000. On that day, FTSE China 50 rose by 5%, YINN rose by 15%, and the total assets were $3000 (1 + 5%) = $3150. After deducting the financing of $2000 (even if we do not calculate the financing cost and management fee here), the net assets are $1150, and the unit net value at the end of the first day is 1.15.
Due to the daily rebalancing mechanism of the leveraged ETF, which ensures that the price tracked the next day remains the same as the previous day’s 15% increase, financing will be conducted at three times the latest net assets, which is $3450 (1150 * 3). If the index falls by 5% the next day and YINN falls by 15%, but the total assets are $3277.5 (3450 * (1-5%)), the net assets after deducting the financing of $2300 are $977.5, which means the net asset value at the end of the second day is 0.9775.
For the underlying index tracked (FTSE China 50), the net value at this time is 1 * 1.05 * 0.95 = 0.9975, which is a yield of -0.25%. However, the yield of YINN at this time is already -2.25%, which has generated a wear and tear cost of 1.5% relative to the return change of three times the underlying index (-0.75%).
If the stock market index continues to fluctuate recently, it means that you will continue to bear leverage losses, as well as transaction costs such as financing interest. The ultimate result is that the index does not show significant fluctuations during this period, but the net assets of leveraged ETFs held by investors continue to decline.
However, if you encounter a one-way market, holding a leveraged ETF will also amplify your profits .
For example, changing the above assumption, if the index continues to rise by 5% the next day, YINN rises by 15% that day, the total assets are 3450 * (1 + 5%) = 3622.5 US dollars, and the net assets after deducting the financing of 2300 US dollars are 1322.5 US dollars, that is, the unit net value at the end of the second day is 1.3225.
For the underlying index (FTSE China 50), the net value at this time is 1 * 1.05 * 1.05 = 1.1025, that is, the yield is 10.25%, but the yield of YINN at this time is already 32.25%. Relative to the return change of the triple underlying index (30.75%), the wear cost becomes a “wear benefit” of 1.50%.
Although there are indeed some special years, the rapid one-way rise of the index will allow the yield of leveraged ETFs to expand faster.
Conclusion
This week alone, $2.50 billion has flowed into the four largest US-listed ETFs linked to the Chinese stock market, with KraneShares’ KWEB recording its largest ever one-day inflow on Tuesday. Fund managers and hedge funds are flooding into the Chinese stock market at a record rate. If you want a piece of the action, you might as well monitor the aforementioned US stocks and ETFs on compliance trading platforms such as Schwab Wealth Management, Interactive Brokers, BiyaPay, etc., so that you can detect opportunities in time and make a decisive move when the time is right.

BiyaPay makes crypto more popular!
Contact Us
Company and Team
BiyaPay Products
Customer Services
Resources
Telegram digital currency community:
https://t.me/BiyaPay666
Community


Sign In
Sign Up
Sign In
Sign Up
Regulation Subject
BIYA GLOBAL LIMITED registered as Financial Service Provider (FSP number: FSP1007221) in New Zealand, and is a member of the Financial Dispute Resolution Scheme, a New Zealand independent dispute resolution service provider.
BIYA GLOBAL LLC registered with the US Financial Crimes Enforcement Network (FinCEN), as a Money Services Business (MSB), registration number: 31000274115551, and regulated by FinCEN.
BIYA GLOBAL LLC To enhance investor protection, BIYA GLOBAL LLC is expediting its Broker-Dealer license application process in full compliance with U.S. SEC and relevant regulatory requirements.
©2019 - 2025 BIYA GLOBAL LIMITED